Royal Wave Pro M4
- インディケータ
-
Vahidreza Heidar Gholami
 I'm a software engineer with over 15 years of experience in programming and software development. As an active member of the MQL5 community, I strive to deliver high-quality products. My goal is to create efficient and productive tools for traders, and I have a wealth of innovative ideas to achieve
 - バージョン: 4.6
- アップデート済み: 17 6月 2022
- アクティベーション: 10
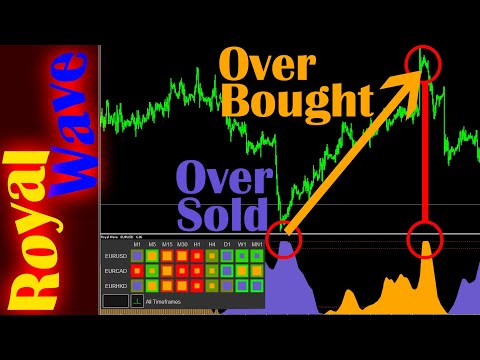
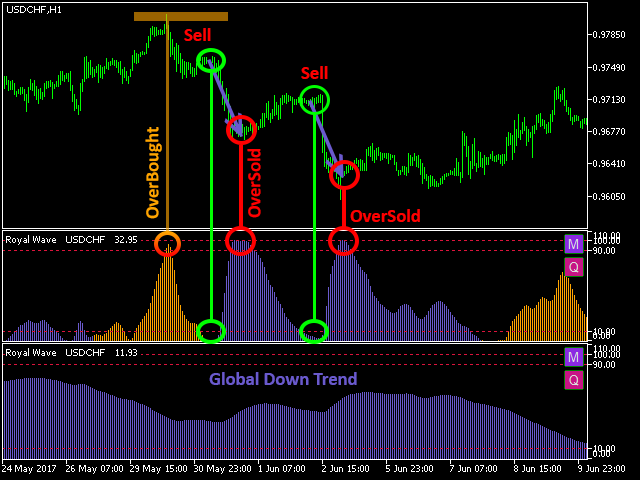
Royal Wave is a Trend-Power oscillator which has been programmed to locate and signal low-risk entry and exit zones. Its core algorithm statistically analyzes the market and generates trading signals for overbought, oversold and low volatile areas. By using a well-designed alerting system, this indicator makes it easier to make proper decisions regarding where to enter and where to exit trades.
Features
- Trend-Power Algorithm
- Low risk Entry Zones and Exit Zones
- Predictions for Overbought and Oversold areas
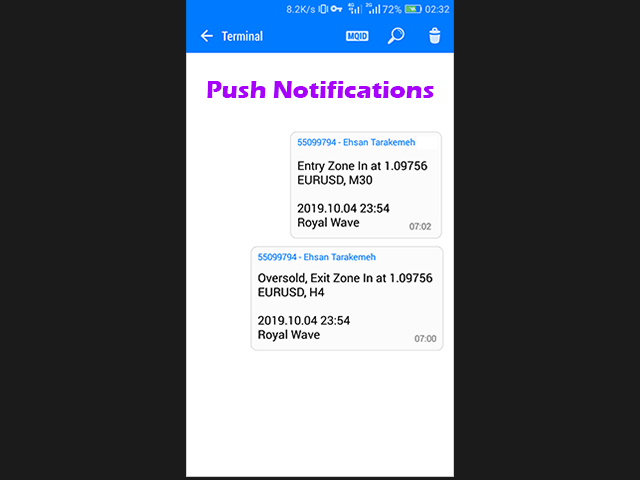
- Sound Alerts, Push Notifications,Zone Flasher, ...
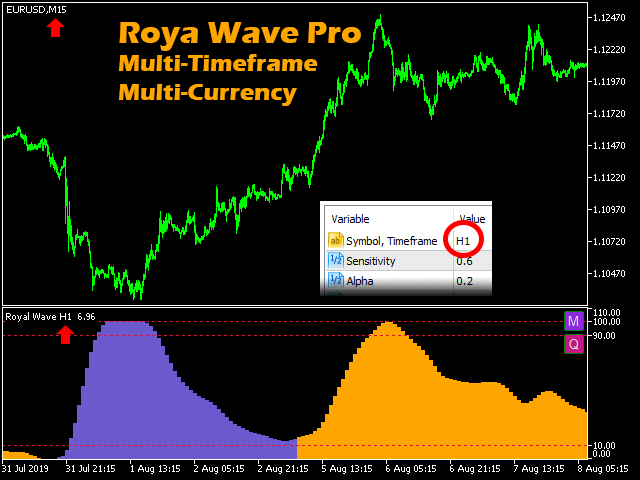
- Multi-Timeframe and Multi-Currency Analysis
- Signal Matrix
- Cross Window
- No Repainting
- Please don't hesitate to contact me directly if you have any question or difficulty related to this product. You will get instant responses to your questions sent through MQL5 messenger.
- Watch the tutorial video at the end of this description.
- Don't forget to subscribe to my YouTube Channel.
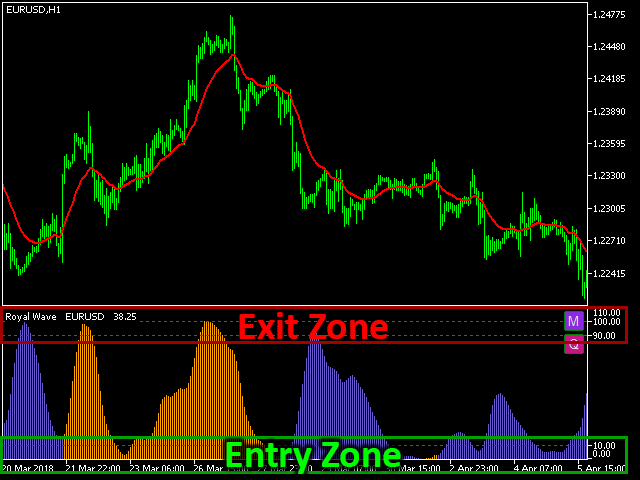
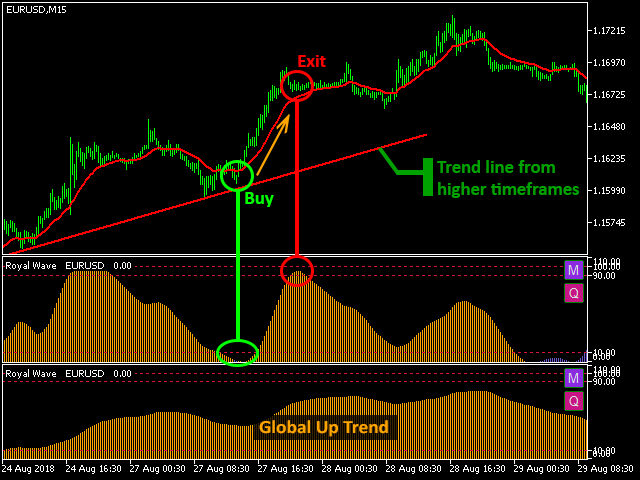
Entry Zones
Once the oscillator value is about zero it means there’s going to be a big movement in the price in the near future because traders from almost all timeframes are agree on the current price and have united to move the price by a big step in one direction. Therefore, Royal Wave tries to predict low-risk entry zones where price wants to move only in one direction until the oscillator reaches the exit zone. Entry zones are always going to be the close enough start of a big movement in the price.
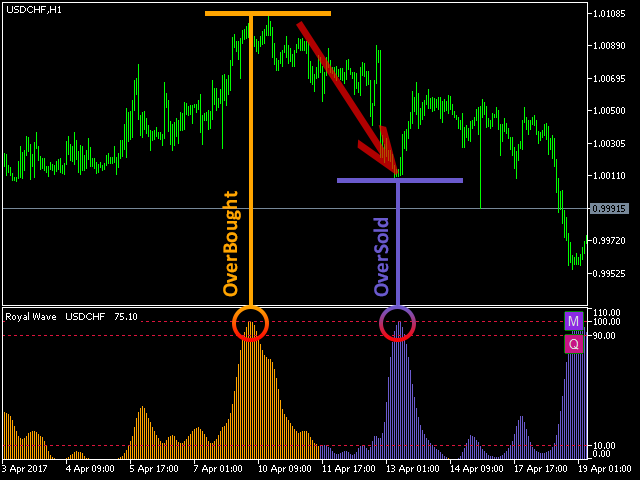
Exit Zones
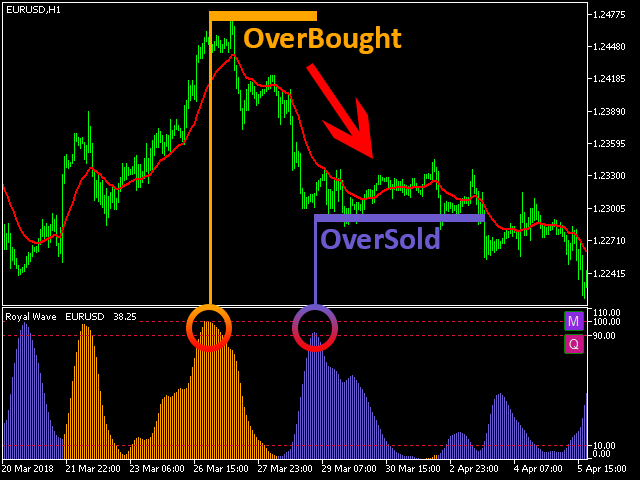
Once the oscillator is in the exit zone close to 100, it’s predicting an overbought when the color is yellow or an oversold when the color is blue. This zone can be used to exit a trade or update a stop loss level because of the high probability of reversals in these areas.
Exit Zone points are potential candidates to be reversal points in a trend. By using the Royal Wave Signal Matrix, some of these areas can be identified as low-risk areas to enter a reversal trade.
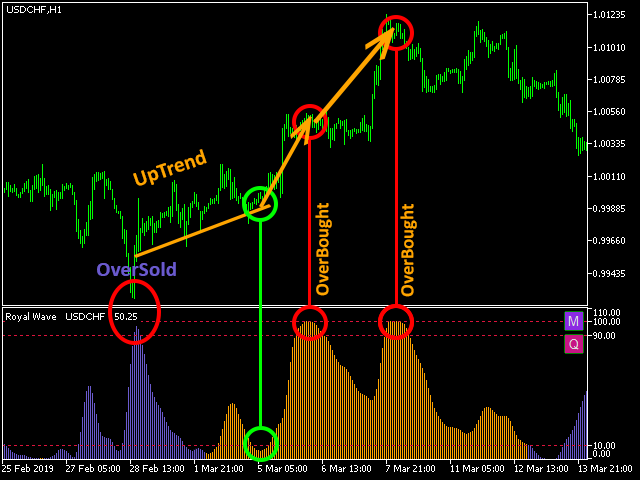
Trend and Power
The value of the oscillator represents the current power of the trend which oscillates between 0 and 100. When the power is rising, a yellow color indicates a strong uptrend and a blue color indicates a strong downtrend. A decreasing power shows consolidation which means there is no trend in the price and the trader should wait for the entry zone.
Signal Matrix
Gives an informative view of several symbols for all timeframes in one matrix. Each cell of this matrix is a brief representation of a symbol's price behavior from a single timeframe. Please watch the tutorial video for more details.
Cross Window
See and compare data from an arbitrary symbol and timeframe within a chart with a different symbol and timeframe. This tool can be used to develop multi-symbol and multi-timeframe strategies. Please watch the tutorial video for more details.
Test Recommendations
- Use different values for Alpha and Beta. Test both 0.1 and 0.2 values for Alpha on different timeframes.
- Alerting functions, Signal Matrix and Cross Window might not work in the test process properly. it's the MetaTrader restrictions for playing sounds and drawing objects in the strategy tester.
Input Parameters
| Input Name [Range] | Description |
|---|---|
| Symbol, Timeframe | Use this input to set different Symbols or Timeframes for the indicator. For example, on a EURUSD chart you can write USDJPY, H1 for the input. By adding a minus sign before the name of the symbol (-USDJPY, H1), Royal Wave will use the inverse of USDJPY which is JPYUSD. Symbol inversion makes it possible to have the same base or quote currency for the chart and the indicator. |
| Sensitivity [0.0, 1.0] | This input makes the oscillator sensitive to local price movements. The closer to 1, the more it gets sensitive. |
| Alpha and Beta inputs [0.0, 1.0] | To catch longer trends and for noise canceling increase these inputs. For getting the overall trend add a second Royal Wave with a higher timeframe or with higher values of Alpha and Beta. |
| Smooth Period | Makes the signal smoother. Enter 0 if smoothing is not required. |
| Zone Flasher | When using Royal Wave on multiple displays/charts, by color-flashing on entry and exit zones it draws your attention to the chart which potentially requires some trading action. |

Имею несколько индикаторов от продавца, все очень качественные, автор отзывчив, и терпеливый)), но этот индикатор просто жемчужина!!