Order Block Indicator MT5
- インディケータ
- バージョン: 2.0
- アップデート済み: 13 7月 2026
- アクティベーション: 5

DoIt Order Blocks - Multi-Timeframe Order Block Indicator for MT5
Most multi-timeframe order block indicators for MT5 give you two bad options: keep switching between charts or display so many rectangles that none of them feels important.
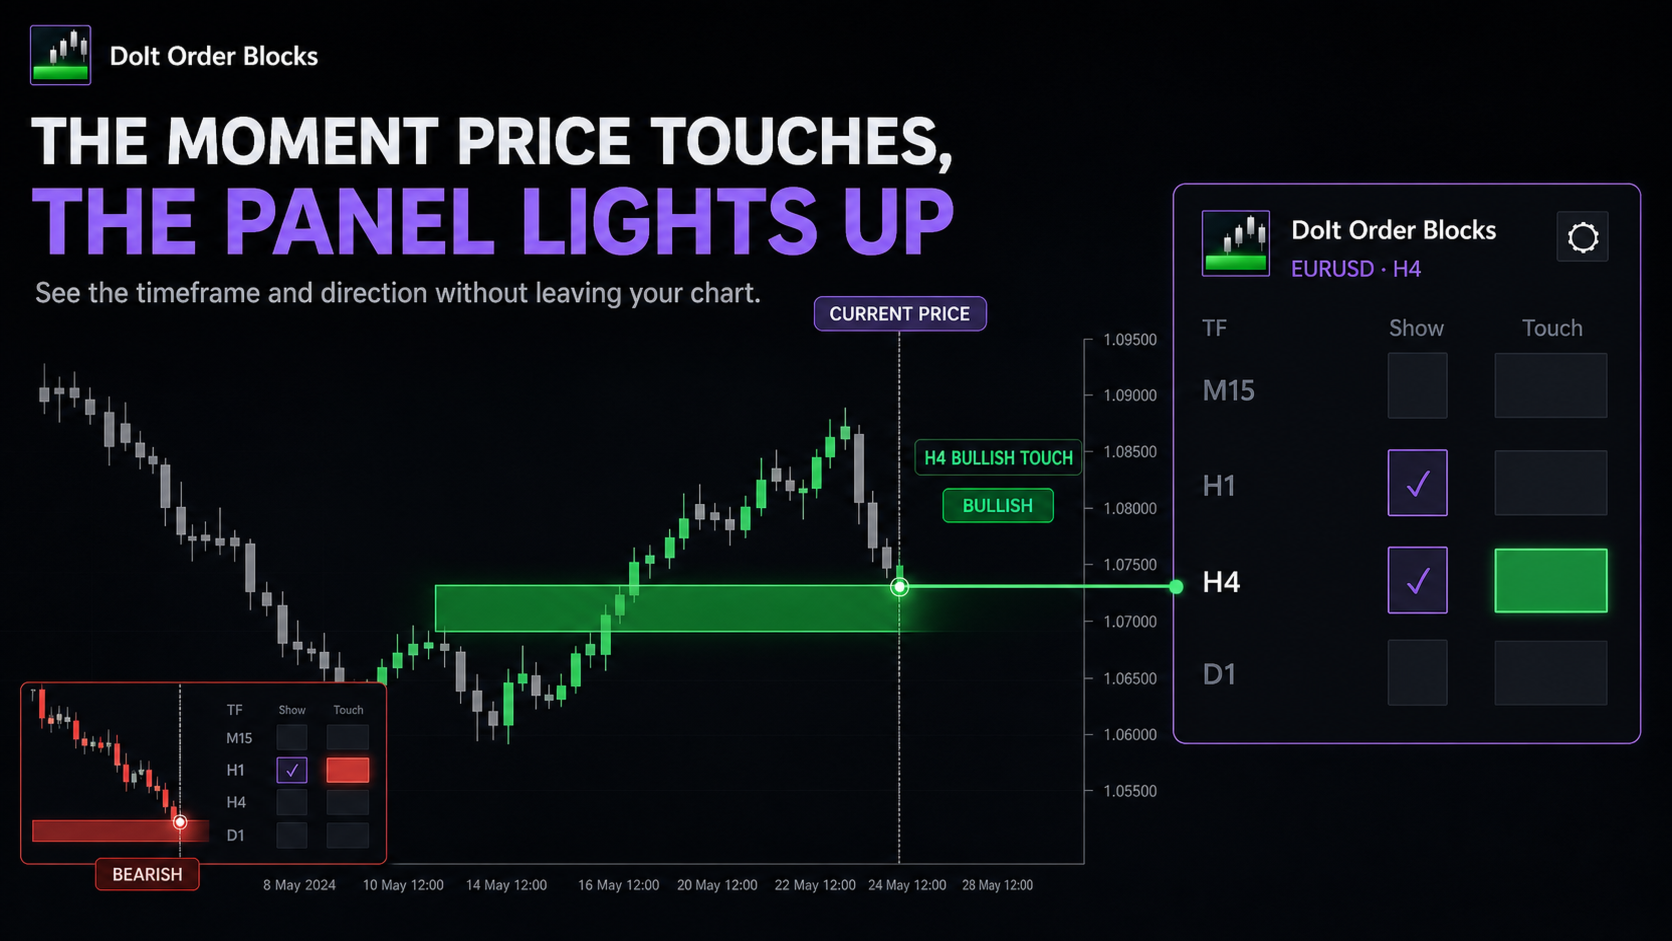
DoIt Order Blocks detects bullish and bearish zones from up to four timeframes on one chart. It tells you which timeframes are active and when price is touching one of their blocks, so you can stop searching and start waiting for price to reach your area.
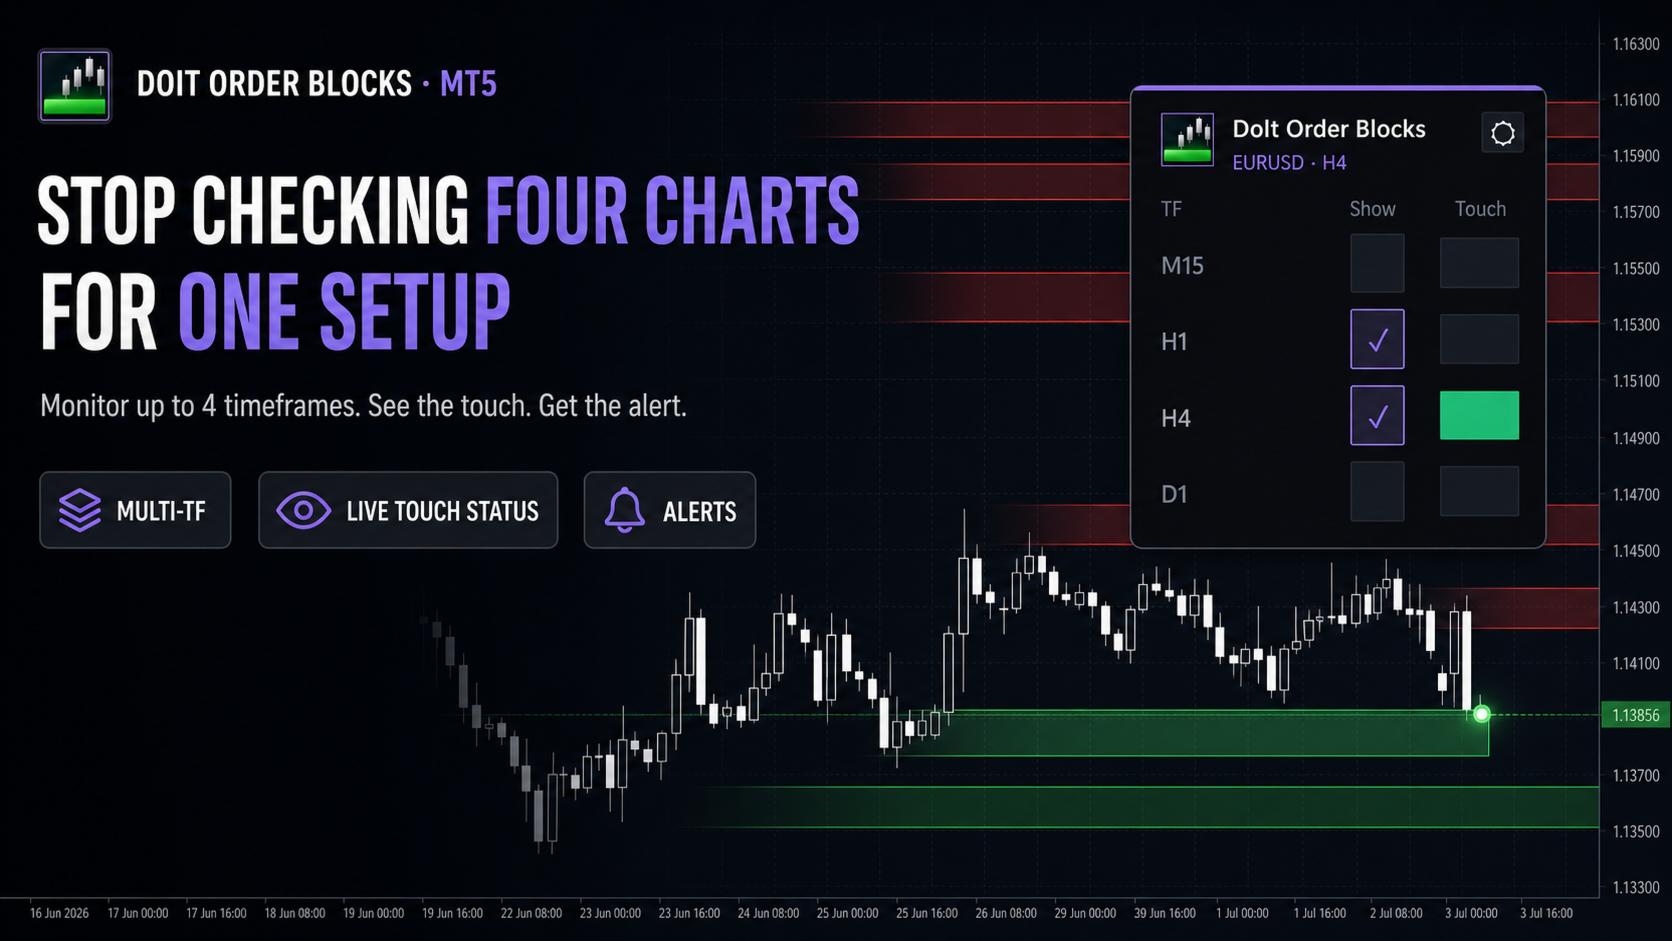
STOP CHECKING FOUR CHARTS FOR ONE SETUP
- Monitor one to four independently selected timeframes.
- Show or hide each timeframe directly from the panel.
- See the current touch state for every active timeframe.
- Draw bullish and bearish zones with separate colours, fills and transparency.
- Display wick, body and 50 percent reference levels.
- Add timeframe labels directly to the zones.
- Limit the historical scan with a configurable starting date.
The new panel keeps the decision in front of you: which timeframes are enabled and which ones price is touching now. No tab cycling. No trying to remember where the H4 zone was while you are looking at M5.
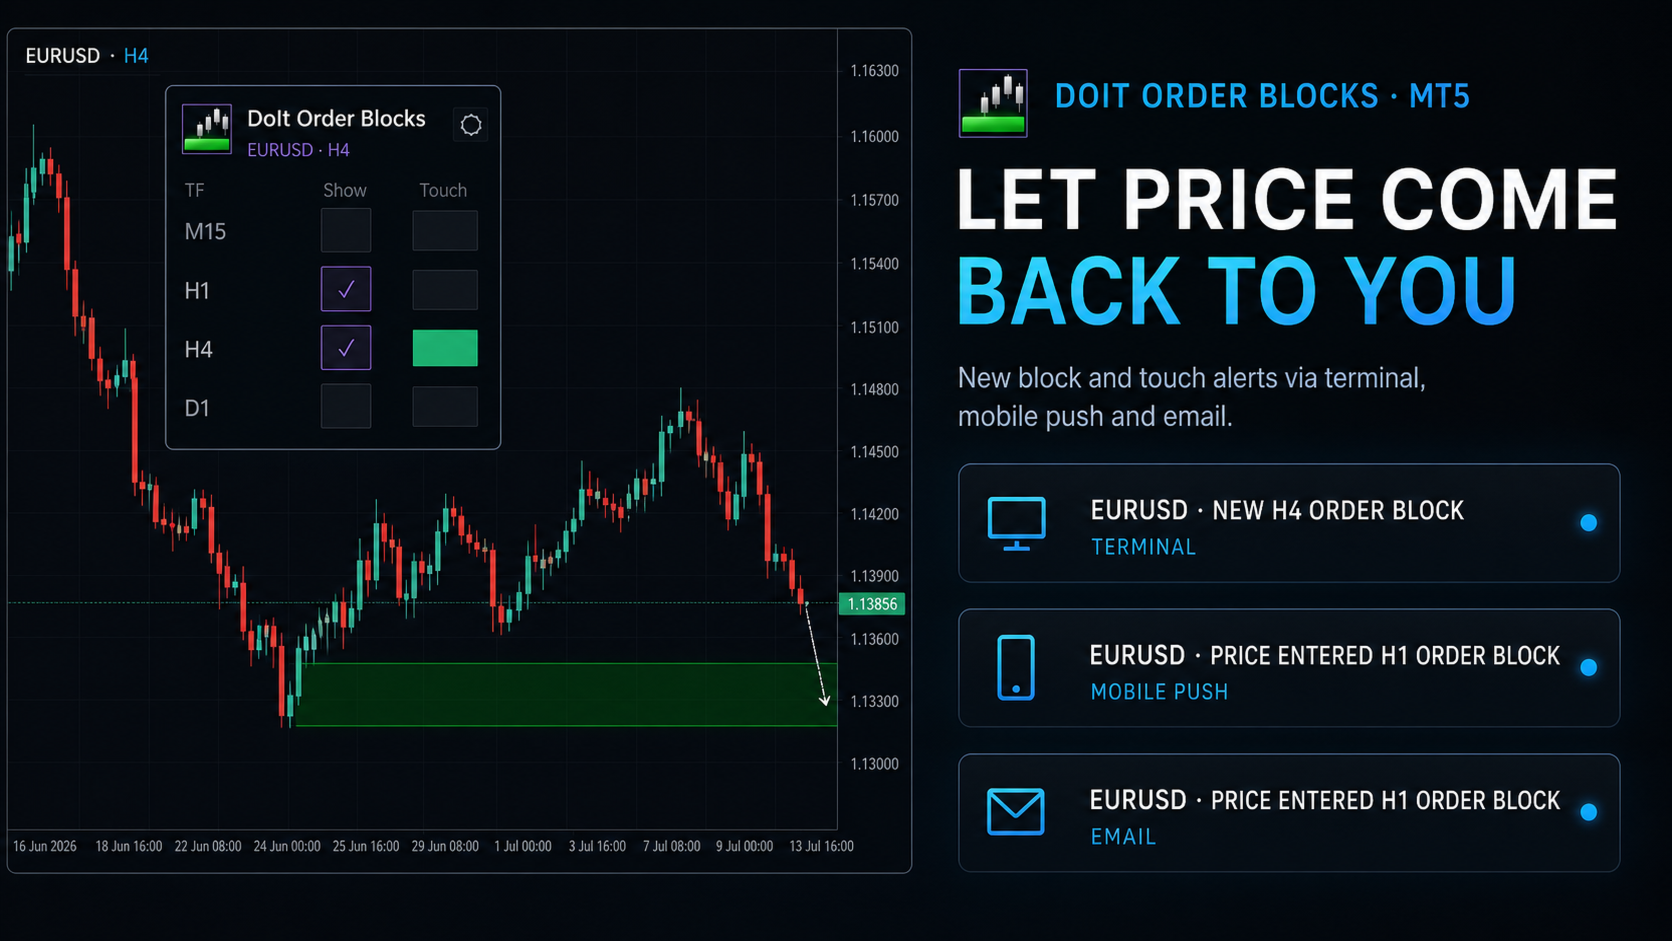
LET PRICE COME BACK TO YOU
DoIt Order Blocks can notify you when a new block is detected and when price touches an active zone. Terminal, mobile push and email alerts let the market come back to you instead of forcing you to watch every candle.
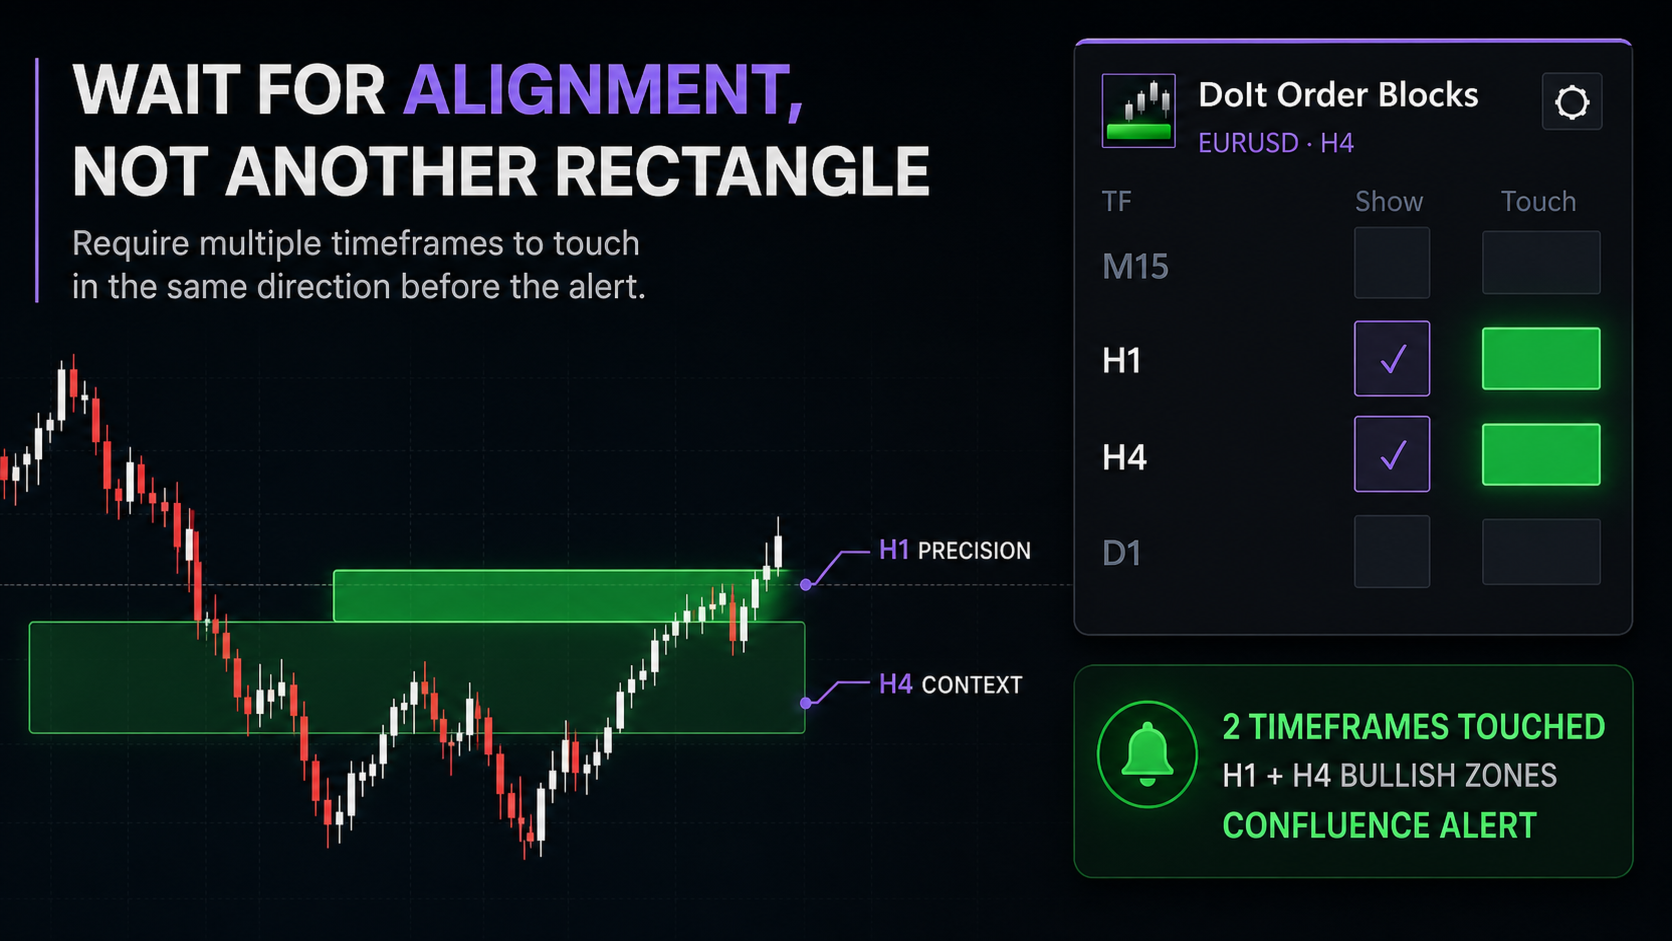
You can require several monitored timeframes to be touched at the same time before receiving a confluence alert. This is built for traders whose process depends on alignment between higher and lower timeframes.
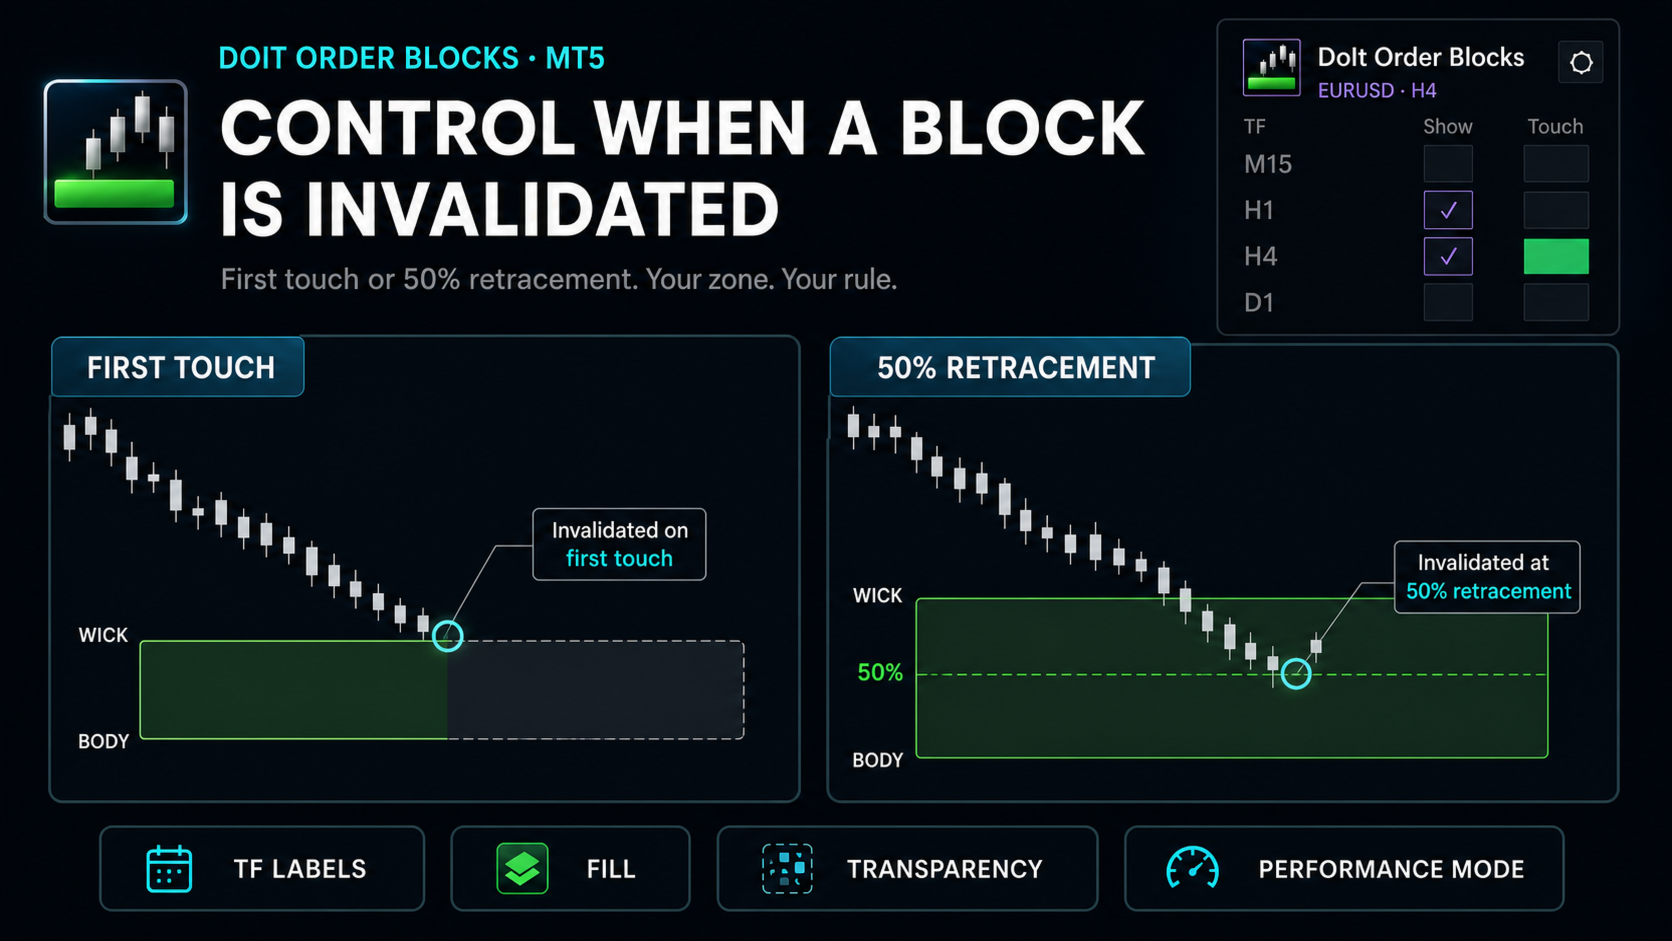
Zone behaviour is configurable. Invalidate a block on the first touch or after a 50 percent retracement. Adjust candle and price tolerance. Enable Performance Mode for longer histories or multi-chart setups. Control zone fill, lines, labels and visibility.
BUILT FOR TRADERS WHO WANT FEWER BLIND SPOTS
DoIt Order Blocks is for discretionary traders who already use order blocks but are tired of rebuilding the same context on every timeframe.
Choose this product when you want a fast, clean zone-and-touch workflow. Choose Order Blocks ICT Multi TF when your model specifically requires Fair Value Gap confirmation, detailed block-construction filters and session-filtered entry and exit alerts.
It shows you where the decision matters. Your entry model decides what to do there. If your current workflow depends on remembering four different charts, this is the part you can stop doing manually.


Another reliable indicator from Diego. No performance issues either the PC or the indicator like some others here. Reliable.