Overlay Chart Indicator
- インディケータ
- バージョン: 1.1
- アップデート済み: 27 7月 2022

Overlay indicator on chart between 2 pairs
The Timeframe Overlay indicator displays the price action of timeframes on a single chart, allowing you to quickly assess different timeframes from a single chart.
The advantage is to observe and follow the correlations of price movements in real time to help you find potential trades at a glance.
---- Symbol 1 ----
Symbol = EURUSD
Correlation Inverse = false
Display = true
Ratio = 1.0
Ponderation = 5
---- Symbol 2 ----
Symbol = USDJPY
Correlation Inverse = false
Display = true
Ratio = 1.0
Ponderation = 5
---- Miscellaneous ----
Start Time (default: 6:00) = 6:00
Font Size = 14
Shift Size (0, 1, 2) = 0
Price Scale = false
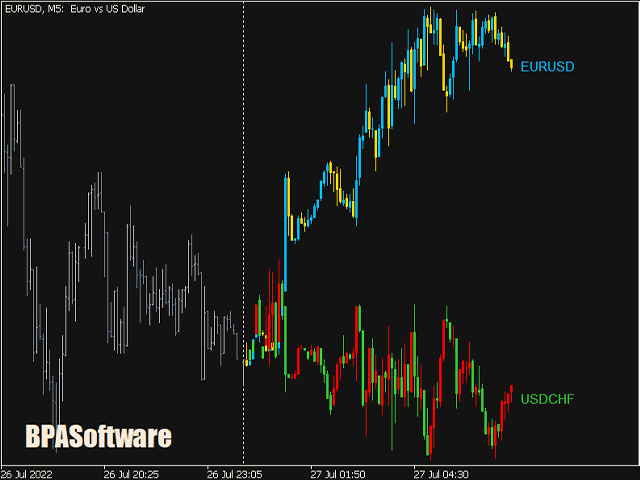

BOM, INDICADOR BACANA PRA QUEM QUER VER A DIFERENCA ENTRE EURUSD E USDCHF, SO PODERIA SER MELHOR COM OS INDICADORES NAS LATERAIS, POIS NA CONFIGURACAO STANDER ELE FICA FORA.