Chartos

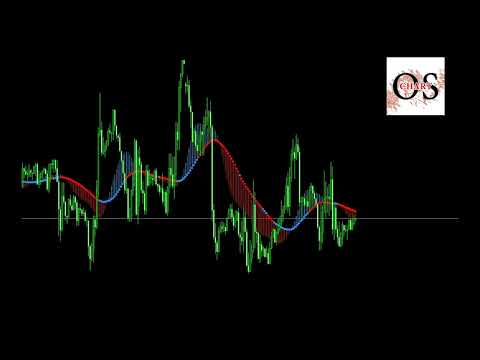
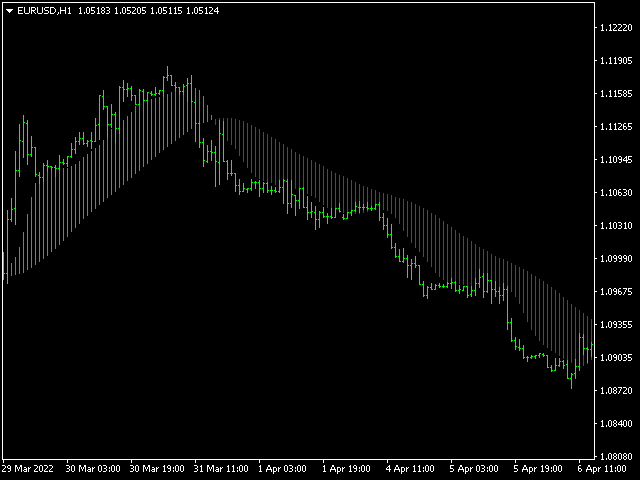
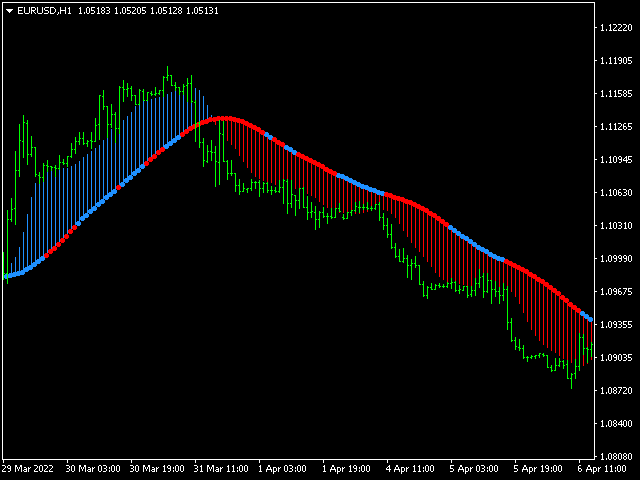
Trend indicator with oscillator.

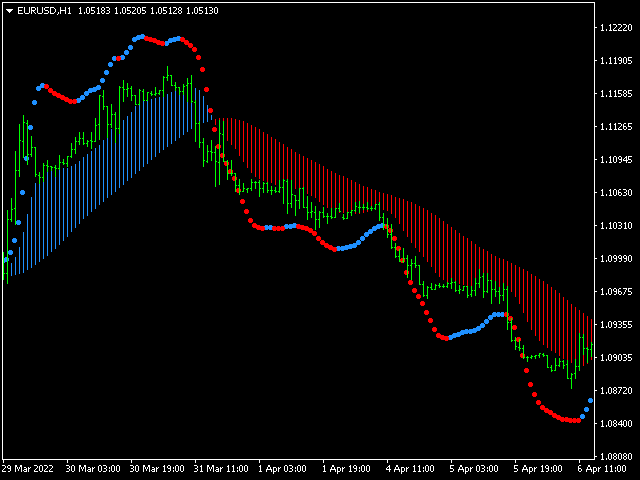
Displays price area between two moving averages and an oscillator.

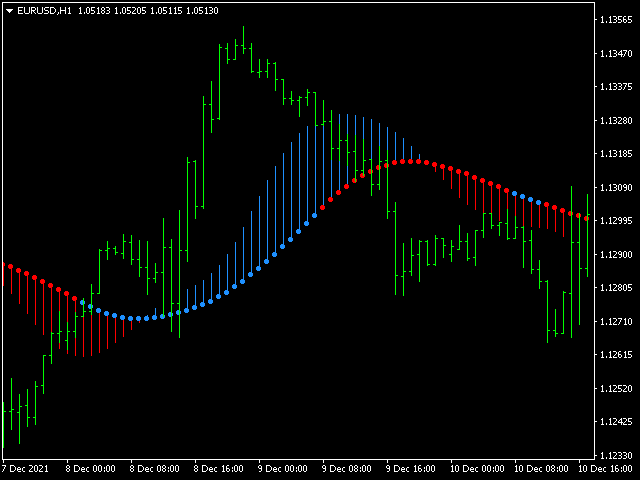
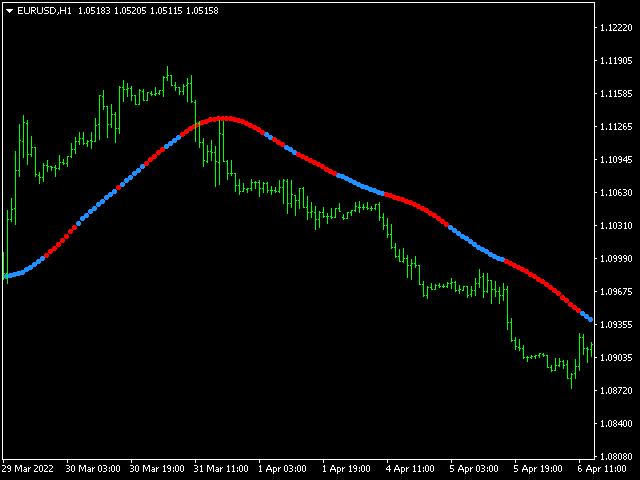
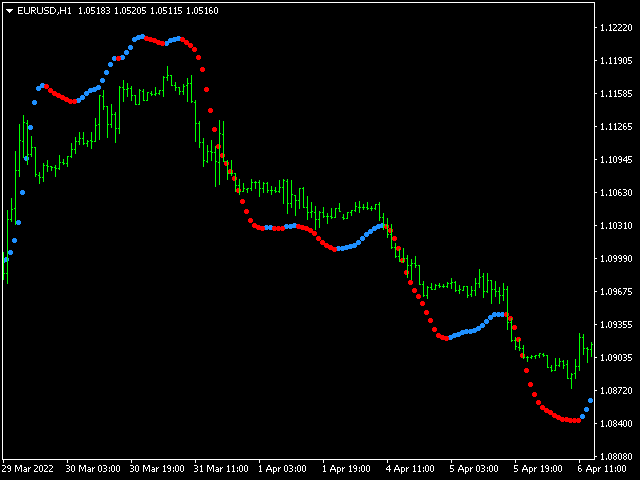
An uptrend is indicated in red, a downtrend in blue.

Settings:

  • Slow MA Period - Slow MA period
  • Fast MA Period - Fast MA period
  • Smoothed Data - Smoothing data
  • Show Area MA - Display MA price areas
  • Show Oscillation - Display MA oscillation
  • Move Oscillation to Slow MA - Display an oscillator on a slow MA
  • Color Up - Uptrend color
  • Color Down - Downtrend color
  • Size Arrow - The size of the oscillator icons
  • Code Arrow - Oscillator icon code
All prices are calculated on the opening of the bar
The indicator does not redraw.
おすすめのプロダクト
COLORED TREND MA / MACD CANDLES draw MA Candles above/below Moving Average in a single color draw MA as a leading Line like a Supertrend draw MA as a Channel => MA High and Low draw MACD Candles above and below 0 and Signal-Line Your  Advantage: a simple view of the trend direction a simple view over the higher trend direction a calmer chart for the eye clear rules can be defined Settings: Bars to process : 6000 is my default, this value is up to you Value Quick-Set : pre-Settings MACD 12 / 26
FREE
APriceChannel is a modification of the standard Price_Channel indicator. The EA draws 2 levels - the upper level shows the price High for the specified period of time, the lower level shows the price Low for the same period. In addition to the period, you can set vertical offset in points to widen the channel up and down. This prevents false breakouts of current support/resistance levels. Inputs Period - time period in bars - the number of bars to calculate the price High/Low. Offset up and dow
FREE
iMACD in iMA is indicator to change color in iMA if iMACD is upper of zero (up trend) or lower of zero (down trend). It is a useful tool to track when the upside and the downside iMACD on iMA. You can to get source code from here . Parameters MA_Periods — Period for iMA. MA_Method — Method for iMA. MACD_FastEMA — Fast EMA for MACD. MACD_SlowEMA — Slow EMA for MACD. MACD_SignalSMA — SMA signal for MACD. MACD_ApliedPrice — Price used for MACD. BarsCount — How many bars will show the line. Revers
FREE
TIO Oscillator - Индикатор собственной разработки, показывающий каждую минуту значения от  М1, М5, М15, М30, Н1, Н4. При превышении критических уровней, например 80 и 20, на всех таймфреймах, мы имеем сильный сигнал на разворот движения.  В индикаторе есть 4 режима подсчета средних значений. Подберите уровни и режимы под свой стиль торговли. Как и все индикаторы, он не Грааль. Это лишь помощник для вашей Торговой Стратегии.
FREE
Special offer : ALL TOOLS , just $35 each! New tools   will be   $30   for the   first week   or the   first 3 purchases !  Trading Tools Channel on MQL5 : Join my MQL5 channel to update the latest news from me SuperTrend by Kivanc Ozbilgic with Scanner をご紹介します。これは、マーケットトレンドに先んじるための多機能で強力なツールで、カスタマイズ可能な機能とリアルタイムのアラートが備わっています ATR の計算方法は、柔軟に対応するために RMA (相対移動平均)と SMA (単純移動平均)から選べます。デフォルト設定では、 ATR 期間が10、乗数が3に設定されており、 SuperTrend は効率的に買いと売りのシグナルを識別します。 組み込みのスキャナーとアラートシステムは、複数の通貨ペアやタイムフレームを監視し、リアルタイムの
FREE
Schaff Trend Cycleとは Schaff Trend Cycle(STC)は、トレンドの転換点をタイムリーに捉えるために設計されたオシレーター系インジケーターです。従来の移動平均やMACDと比較して、サイクル的な動きとモメンタムを組み合わせることで、トレンドの始まりと終わりをより明確に把握できます。 主な特徴 トレンド転換シグナルの明確化:上昇トレンドではサイクルラインが上向きに、下降トレンドでは下向きに推移します。 レンジ相場でのだましを抑制:サイクル周期を考慮した平滑化処理により、短期的なノイズを減少させます。 パラメーター調整が容易:期間や平滑化係数を変更するだけで、動作感度を初心者から上級者まで幅広く調整可能です。 計算ロジック概要 モメンタムの算出 指定期間の価格変化をもとに、短期および長期のモメンタムを計算します。 サイクル平滑化 モメンタムに対し、二重平滑化(ダブル・スムージング)を適用し、サイクル的な振動成分を抽出します。 正規化処理 0~100の範囲に正規化し、オシレーターとして表示します。 シグナル生成 水平ライン(通常は25と75)を上下に抜
FREE
The Hull Moving Average (HMA), developed by Alan Hull from 2005, one of the most fast-moving Average, reduce lag and easy to use to identify Trend for both Short & Long term. This Indicator is built based on exact formula of Hull Moving Average with 3 phases of calculation: Calculate Weighted Moving Average (WMA_01) with period n/2 & (WMA_02) with period n Calculate RAW-HMA: RAW-HMA  = 2 * WMA_01(n/2) - WMA_02(n) Weighted Moving Average with period sqrt(n) of RAW HMA HMA = WMA (RAW-HMA, sqrt(n)
FREE
The indicator displays signals according to the strategy of Bill Williams on the chart. Demo version of the indicator has the same features as the paid, except that it can work only on a demo account . Signal "First Wise Man" is formed when there is a divergent bar with angulation.  Bullish divergent bar - with lower minimum and closing price in the upper half. Bearish divergent bar - higher maximum and the closing price at the bottom half. Angulation is formed when all three lines of Alligator
FREE
MA Search 3
Mariusz Piotr Rodacki
This indicator allows you to overlay three different moving averages on the chart simultaneously. Each of these moving averages has additional settings such as: -Time frame -Shift -MA method -Applied price Using this indicator, you can easily set up three moving averages and find the one that suits you the best. You can also use this indicator to determine the trend when the moving averages cross.
FREE
The Moving Averages On-Off  let you  control the indicator  using  the keyboard  or a  button . You can choose if you want the indicator always shown or always hided while switching among different time frames or financial instruments . --->  This indicator is part of Combo Indicator OnOff It's possible to use three Moving Averages , defined as  Short ,  Medium ,  Long or Raimbow MA 5,10,20,50,100,200. Input MOVING AVERAGES You can customize the price type used for calculation : close, open
FREE
HMA Trend
Pavel Zamoshnikov
4.59 (69)
A trend indicator based on the Hull Moving Average (HMA) with two periods. The Hull Moving Average is an improved variant of the moving average, which shows the moment of trend reversal quite accurately. It is often used as a signal filter. Combination of two types of Hull Moving Averages makes a better use of these advantages: HMA with a slow period identifies the trend, while HMA with a fast period determines the short-term movements and signals in the trend direction. Features The movement d
FREE
The indicator draws two simple moving averages using High and Low prices. The MA_High line is displayed when the moving average is directed downwards. It can be used for setting a stop order for a sell position. The MA_Low line is displayed when the moving average is directed upwards. It can be used for setting a stop order for a buy position. The indicator is used in the TrailingStop Expert Advisor. Parameters Period - period of calculation of the moving average. Deviation - rate of convergence
FREE
Looking for entry points along the local trend without repaint! Arrows indicate entry points. Based on classic indicators. The indicator is easy to use. Settings Наименование Описание Frequency factor Signal frequency. The less, the more often. This affects the quality. Recommendations Recommended for use on major currency pairs. Timeframe from m5, m15, m30 Subscribe to my telegram channel, where we discuss intraday trading, ideas, indicators, etc., a link in my profile contacts.
FREE
Tipu Heikin-Ashi Panel is the modified version of the original Heiken Ashi indicator published by MetaQuotes here . A professional version of this indicator is available here . Features An easy to use Panel that shows the Heiken Ashi trend of selected timeframe. Customizable Buy/Sell alerts, push alerts, email alerts, or visual on-screen alerts. Customizable Panel. The panel can be moved to any place on the chart or minimized to allow more space. Heikin means "the average", and Ashi means "foot
FREE
Special offer : ALL TOOLS , just $35 each! New tools   will be   $30   for the   first week   or the   first 3 purchases !  Trading Tools Channel on MQL5 : Join my MQL5 channel to update the latest news from me Supertrend Fakeout インジケーターは、従来の Supertrend インジケーターを改良したバージョンで、より信頼性の高いトレンドシグナルを提供することを目的としています。 Fakeout Index Limit や Fakeout ATR Mult といった高度な機能を取り入れることで、このインジケーターは短期的な価格変動や市場ノイズによって引き起こされる誤ったトレンド反転をフィルタリングするのに役立ちます。 MT5バージョンを見る:  Supertrend Fakeout MT5 その他の製品を見る:   すべての製品 動作の仕組み Supertr
FREE
Discover the power of precision and efficiency in your trading with the " Super Auto Fibonacci " MT4 indicator. This cutting-edge tool is meticulously designed to enhance your technical analysis, providing you with invaluable insights to make informed trading decisions. Key Features: Automated Fibonacci Analysis: Say goodbye to the hassle of manual Fibonacci retracement and extension drawing. "Super Auto Fibonacci" instantly identifies and plots Fibonacci levels on your MT4 chart, saving you tim
FREE
OsMA Arrow MTF
Pavel Shutovskiy
3.9 (10)
The indicator displays crossing zero level by Moving Average of Oscillator (OsMA) in the form of arrows. The this is a multi-timeframe indicator, and it displays signals from other timeframes. The indicator notifies about a signal by means of a pop-up Alert window, or sending notification to e-mail. Parameters Time-frame - select timeframe to show indicator signals. Fast EMA Period - fast EMA. This is an exponential moving average from a price with a short period. Slow EMA Period - slow EMA. Th
FREE
The Sure Reverse Channel is a dynamic non repaint trend indicator with entry arrows, the indicator focuses on catching a reverse swing in the market by using channel and price action formula, the indicator comes with built-in money management . HOW TO TRADE : Open buy trade when buy arrow pops up and set your SL below arrow, for TP you have TP  which is opposite band. Open sell trade when sell arrow pops up and set your SL above arrow,   for TP you have TP  which is opposite band. band. Why is
FREE
TSO Moving Average Slope
Dionisis Nikolopoulos
3.67 (3)
The Moving Average Slope (MAS) subtracts the moving average level n-periods ago from the current moving average level. This way, the trend of the moving average can be drawn on the moving average line. Features Observe uptrends and downtrends at a glance. The indicator is non-repainting. Returns buffer values for the trend of the moving average to be used as part of an EA. (see below) Inputs Moving Average Period : The period of the moving average (MA). Slope Period : Number of periods between
FREE
MA Cloud mt4
Alexander Chertnik
4 (2)
Moving Average Cloud draws 4 MAs on chart simultaneously in histogram style. Indicator uses 4 MAs: slow sma & ema 200 and fast sma & ema 50. the range between 2 slows MAs and Fasts, represented by histograms on the MAs boundaries - creating kind of "cloud" that can be traded by all kind of MA strategies like support & resistance or other... Change of color of the same histogram points to momentum changing. Combined with other market analysis, can greatly improve trading results.
FREE
Power Trend Free - the indicator shows the trend strength in the selected period. Input Parameters The indicator has three input parameters: Period - a positive number greater than one, it shows the number of candlesticks used for calculations. If you enter one or zero, there will be no error, but the indicator will not be drawn. Applied Price - the standard "Apply to:" set meaning data used for the indicator calculation: Close - Close prices; Open - Open prices; High - High prices; Low - Low p
FREE
AIS MT4 INDICATOR 5 ALL INCLLUSIVE SET !!!!!!!!!!!!!!!!!!!!!!!!!!!!!!!!!!!!!!!!!!!!!!!!!!!!!!!!!!! ! ! ATTENTION ! LIMITATION OF FREE OFFER PERIOD IS IMPLICIT ! !   ! CONFIRMATION 2024-08-20 20:00                           ! ! !!!!!!!!!!!!!!!!!!!!!!!!!!!!!!!!!!!!!!!!!!!!!!!!!!!!!!!!!!! GUIDE CHAPTER 1 IMPORTANT INFORMATION <1> THIS INDICATOR IS ONE OF THE SERIES OF NEW AIS INDICATORS AIS MT4 INDICATOR 1 =ADVANCED CLASSIC= AIS MT4 INDICATOR 2 =MULTIFRAMES= AIS MT4 INDICATOR 3 =LINES= AIS M
FREE
User friendly indicator.  This indicator will help you catch the trend an fast as possible. Indicator developed based on moving averages. User can select which type of moving averages they want to use. Indicator draws an arrow when the moving average crosses. The moving average cross over arrow can be filtered with RSI, OsMA, and Parabolic Sar. There are options for selecting specific criteria for the filters.  Such as period of Rsi and Rsi levels. OsMA and Parabolic Sar criteria can also be sel
Follow The Line
Oliver Gideon Amofa Appiah
3.94 (16)
FOLLOW THE LINE GET THE FULL VERSION HERE: https://www.mql5.com/en/market/product/36024 This indicator obeys the popular maxim that: "THE TREND IS YOUR FRIEND" It paints a GREEN line for BUY and also paints a RED line for SELL.  It gives alarms and alerts of all kinds. IT DOES NOT REPAINT and can be used for all currency pairs and timeframes. Yes, as easy and simple as that. Even a newbie can use it to make great and reliable trades. NB: For best results, get my other premium indicators for more
FREE
移動平均は移動中に変化します。 インジケータは、移動平均を計算する期間を自動的に選択します。 動きの方向性が高いほど、平均化期間は長くなります。 トレンドが遅くなると、移動平均の期間が減少し、より速くなります。 これは傾向の変更により速く反応することを可能にする。  この指標は、トレンドまたはトレンド反転ポイントでうまく機能します。 横方向では、速い動きのあるものが遅いものを上に横切るときなど、インジケータは逆の方法で使用することができます-これは売りシグナルです。 または、チャネルを使用しておおよその購入ゾーンまたは販売ゾーンを決定することもできます。 チャンネル表示は、設定で有効にすることができます。  パラメータ: 自動計算のためのバー-このバー数について、インジケータは極端を検出し、最後の極端な時間に応じて移動平均の期間を計算します。 乗数-移動平均の差を設定します。 速度-ある期間から別の期間への移動平均の移行率を変更します。 channel-チャンネル表示を有効または無効にします。 インターフェイスの利便性のために他の設定もあります。 移動平均の期間を変更
FREE
QualifiedEngulfing - は ProEngulfing インジケーターの無料版です。 ProEngulfing - は Advance Engulf インジケーターの有料版で、 こちらからダウンロードできます。 ProEngulfing の無料版と有料版の違いは何ですか?無料版は1日に1つのシグナルの制限があります。 QualifiedEngulfingをご紹介します - あなたのMT4用のプロフェッショナルエンゴルフパターンインジケーター Precisionの力を解放して、QualifiedEngulfingを使用して外国為替市場での資格のあるエンゴルフパターンを特定および強調する先進的なインジケーターです。MetaTrader 4用に開発されたQualifiedEngulfingは、外国為替市場のエンゴルフパターンを確認およびハイライトするために設計された切り立ったアプローチを提供し、取引の決定に対して最も信頼性の高いシグナルのみを受け取ることを確認します。 QualifiedEngulfingの動作方法: QualifiedEngulfingは、エンゴルフパター
FREE
+ 2 bonus strategies! Alerts! I recommend watching my advisor -   Night Zen EA The indicator combines the most popular moving average strategies: Simple moving average crossover. Moving average crossover relative to the position of the slower moving average. 2 bonus strategies : The crossing of the fast moving average with the calculation of the opening prices of the slow moving average with the calculation of the closing prices taking into account the slower moving average. (The settings for th
FREE
A simple but effective helper that will allow you to track both global and local market trends. The indicator combines the work of two oscillators: Stochastic and RSI. Both indicators can be set to any timeframe. Advantages of Use Multitimeframe - you can adjust both indicators to the desired timeframes. To obtain the entry points, you can use the Elder's triple screen system. Highly customizable - you can configure not only the parameters of the indicators, but also their appearance (color and
FREE
Accuracy Meter
Ashkan Hazegh Nikrou
5 (2)
精度メーターの紹介: 精度メーターは、戦略の勝率を決定する強力なツールであり、メタトレーダー戦略テスターのようなすべてのトレードのエントリーポイントとエグジットポイントを示します。チャート上のインジケーターとしてシンプルなストラテジーテスターを使用し、さまざまなペアとタイムフレームにアタッチして調べることができます。戦略の正確さのパーセンテージ、ストップロスとリスクを報酬要素に変更し、それがトレーディングのアイデアにどのように影響するかを確認します。 Accuracy Meterはシンプルな戦略テスターです。この製品は、戦略テスターと同じチャート上の戦略の入口と出口にアクセスするのに役立ちます。この製品を使用すると、コストを節約し、不利益なEAを構築するためにお金を無駄にすることがありません。 よくある質問 : どのように私はこの指標に私の戦略を定義できますか? 精度メーターには、カスタムインジケーターのパスと名前を調整できる入力設定があり、買いバッファーと売りバッファーの番号も定義できます。 以下の設定を使用できます。     カスタム指標名     バッファ番号を購入
FREE
Signals and Alerts for Accelerator/Decelerator indicator based on these MQL5 posts: Accelerator Oscillator and Signals of the Indicator Accelerator Oscillator . Note : this tool is based on the code of Accelerator indicator developed by MetaQuotes Software Corp. Features The signals are triggered at   closing   of last bar/opening of a new bar; Any kind of alerts can be enabled: Dialog Box, Email message, SMS notifications for smartphones and tablets, and Sound alerts; Customizable arrows. By d
FREE
このプロダクトを購入した人は以下も購入しています
Gann Made Easy は、ミスター・ギャンの理論を使用した取引の最良の原則に基づいた、プロフェッショナルで使いやすい外国為替取引システムです。 W・D・ガン。このインジケーターは、ストップロスとテイクプロフィットレベルを含む正確な買いと売りのシグナルを提供します。 PUSH通知を利用して外出先でも取引可能です。 購入後に私に連絡して、取引のヒント、ボーナス、および「GANN MADE EASY」EA アシスタントを無料で入手してください。 おそらく、ギャンの取引手法についてはすでに何度も聞いたことがあるでしょう。通常、ギャンの理論は初心者のトレーダーだけでなく、すでにある程度の取引経験がある人にとっても非常に複雑なものです。なぜなら、ギャンの取引手法は理論的にはそれほど簡単に適用できるものではないからです。私はその知識を磨き、最良の原則を私の外国為替インジケーターに組み込むために数年を費やしました。 このインジケーターは非常に簡単に適用できます。必要なのは、それをチャートに添付し、簡単な取引推奨事項に従うだけです。このインジケーターは常に市場分析の仕事を行い、取引の機会を探しま
Trend indicator AI
Ramil Minniakhmetov
5 (71)
Trend Ai indicatorは、トレンドの識別と実用的なエントリポイントと反転アラートを組み合わせることで、トレーダーの市場分析を強化する優れたツールです。 この指標は、ユーザーが自信と正確さで外国為替市場の複雑さをナビゲートすることを可能にします トレンドAiインジケーターは、主要なシグナル以外にも、プルバックやリトレースメント中に発生するセカンダリエントリポイントを識別し、トレーダーが確立されたトレンド内の価格修正を活用できるようにします。 重要な利点: *MT4およびMT5の仕事 *明確な買いまたは売りシグナル *再描画しません ·すべての資産で動作します 私はeaやセットをtelegram it詐欺で販売しないように注意してください。 すべての設定はここでブログで無料です。  重要! 指示とボーナスを得るために購入後すぐに私に連絡してください! 私の他のプロダクトと同様、実質操作の監視はここに見つけることができます: https://www.mql5.com/en/users/mechanic/seller&nbsp ; 設定および入力: すべての
M1 Sniper
Oleg Rodin
4.89 (18)
M1 SNIPER は使いやすいトレーディングインジケーターシステムです。M1時間足向けに設計された矢印インジケーターです。M1時間足でのスキャルピングのためのスタンドアロンシステムとして、また既存のトレーディングシステムの一部としても使用できます。このトレーディングシステムはM1時間足での取引に特化して設計されていますが、他の時間足でも使用できます。元々、この手法はXAUUSDとBTCUSDの取引用に設計しましたが、他の市場においても役立つと考えています。 インジケーターのシグナルは、トレンドの方向と逆方向に取引できます。インジケーターのシグナルを利用して両方向に取引するのに役立つ特別な取引テクニックをご紹介します。この手法は、特別な動的なサポートとレジスタンスの価格帯を利用することに基づいています。 ご購入後、M1 SNIPER矢印インジケーターをすぐにダウンロードできます。さらに、M1 SNIPERツールのすべてのユーザーに、以下のスクリーンショットに表示されているApollo Dynamic SRインジケーターを無料で提供しています。この2つのインジケーターを組み合わせることで
An exclusive indicator that utilizes an innovative algorithm to swiftly and accurately determine the market trend. The indicator automatically calculates opening, closing, and profit levels, providing detailed trading statistics. With these features, you can choose the most appropriate trading instrument for the current market conditions. Additionally, you can easily integrate your own arrow indicators into Scalper Inside Pro to quickly evaluate their statistics and profitability. Scalper Inside
これはMT4のインジケーターで、再描画なしで取引に参入するための正確なシグナルを提供します。 外国為替、暗号通貨、金属、株式、インデックスなど、あらゆる金融資産に適用できます。かなり正確な見積もりを提供し、取引を開始して終了するのに最適な時期を教えてくれます。1つのシグナルを処理しただけでインジケーターの元が取れた例の 動画 (6:22)をご覧ください。Entry PointsPro インジケーターの助けを借りたほとんどのトレーダーの最初の1週間の結果が改善しています。 Telegramグループ に登録してください。Entry Points Proインジケーターのメリットは次の通りです。 再描画のないエントリーシグナル 再描画されるインジケーターでは一度表示されたシグナルが削除されて大きな金銭的損失につながることがありますが、これと異なり、表示されて確認されたシグナルは消えることがありません。 エラーなしの取引開始 インジケーターアルゴリズムによって取引を開始する(資産を売買する)理想的な瞬間を見つけることができます。それを使用するすべてのトレーダーの成功率が向上します。 あら
デイトレーダーマスターは、デイトレーダーのための完全なトレーディングシステムです。システムは2つのインジケーターで構成されています。 1つの指標は売買する矢印信号です。それはあなたが得る矢印インジケーターです。 2つ目のインジケーターを無料で提供します。 2番目のインジケーターは、これらの矢印と組み合わせて使用​​するために特別に設計されたトレンドインジケーターです。 インジケーターは繰り返さず、遅れないでください! このシステムの使用は非常に簡単です。 2色の線で表示されている現在のトレンドの方向に矢印信号をたどる必要があります。青は買いの傾向です。赤い色は売りの傾向です。青い矢印は買いシグナルです。赤い矢印は売りの合図です。トレンドラインの色と一致するように、矢印の色と信号の方向が必要です。 矢印インジケーターは、主に時間間隔M5とM15での日中取引のために作成されました。ただし、技術的には、システムは他の時間間隔で使用できます。 インジケータには、PUSHメッセージ機能を備えたポップアップアラートが装備されています。 購入後、必ず私に書いてください!私はあなたにシステムとの取引の
Game Changerは、あらゆる金融商品で使用できる革新的なトレンドインジケーターです。メタトレーダーを強力なトレンドアナライザーへと変貌させます。このインジケーターは再描画や遅延がありません。あらゆる時間枠で動作し、トレンドの特定、反転の可能性のシグナル、トレーリングストップ機能、そして迅速な市場反応のためのリアルタイムアラートを提供します。経験豊富なプロ、あるいは優位性を求める初心者の方でも、このツールは自信と規律を持ち、トレンドの根底にあるダイナミクスを明確に理解した上で取引を行うための力となります。 購入後すぐにご連絡いただくと、個人ボーナスを進呈いたします!強力なサポートとトレンドスキャナーインジケーターの無料コピーもご用意しておりますので、お気軽にプライベートメッセージでご連絡くださ. 私のEAやスペシャルセットはTelegramでは販売しておりません。Mql5のみで販売しており、セットファイルはこちらのブログでのみ公開し ております 。詐欺師にはご注意ください。他の方からセットを購入しないでください。 設定 トレンド変化時のアラートを有効にする - True/Fals
現在26%オフ 初心者やエキスパートトレーダーに最適なソリューション! このインジケーターは、独自の機能と新しい計算式を取り入れた、ユニークで高品質、かつ手頃な価格のトレーディングツールです。たった1枚のチャートで28の為替ペアの通貨強度を読み取ることができます。新しいトレンドやスキャルピングチャンスの引き金となるポイントを正確に特定することができるので、あなたのトレードがどのように改善されるか想像してみてください。 ユーザーマニュアルはこちら  https://www.mql5.com/en/blogs/post/697384 これが最初の1本、オリジナルだ! 価値のないクローンを買わないでください。 特別な サブウィンドウの矢印で強い通貨の勢いを表示 GAPがあなたのトレードを導く! 基準通貨や気配値が売られすぎ・買われすぎのゾーン(外相フィボナッチレベル)にあるとき、個別チャートのメインウィンドウに警告表示。 通貨がレンジの外側から反落した場合、プルバック/リバーサルのアラート。 クロスパターンの特別なアラート 複数の時間枠を選択可能で、トレンドを素早く確認できます
「 Dynamic Scalper System 」インジケーターは、トレンド波の中でスキャルピング取引を行う手法のために設計されています。 主要通貨ペアと金でテスト済みで、他の取引商品との互換性があります。 トレンドに沿った短期的なポジションオープンのシグナルを提供し、追加の価格変動サポートも提供します。 インジケーターの原理 大きな矢印はトレンドの方向を決定します。 トレンド波の中では、小さな矢印の形でスキャルピングシグナルを生成するアルゴリズムが機能します。 赤い矢印は強気方向、青い矢印は弱気方向です。 トレンドの方向には敏感な価格変動ラインが描かれ、小さな矢印のシグナルと連動します。 シグナルは次のように機能します。適切なタイミングでラインが現れるとエントリーシグナルが形成され、ラインが開いている間はポジションが保持され、完了すると取引が終了します。 推奨される動作時間枠はM1~H4です。 矢印は現在のローソク足に形成され、次のローソク足が開いている場合は、前のローソク足の矢印は再描画されません。 入力パラメータ Trend Wave Period - トレンド方向
SMC Easy Signal
Mohamed Hassan
4.69 (13)
2 copies left at $65, next price is $120 SMC Easy Signal was built to remove the confusion around the smart money concept by turning structural shifts like BOS (Break of Structure) and CHoCH (Change of Character) into simple buy and sell trading signals. It simplifies market structure trading by automatically identifying breakouts and reversals as they happen, allowing traders to focus on execution rather than analysis. Whether the market is continuing its trend or preparing to reverse, the i
市場の2つの基本原則に基づく日中戦略。 このアルゴリズムは、追加のフィルターを使用したボリュームと価格の波の分析に基づいています。インディケータのインテリジェントアルゴリズムは、2つの市場要因が1つに結合した場合にのみシグナルを出します。インディケータは、より高い時間枠のデータを使用して、M1チャート上の特定の範囲の波を計算します。そして波を確認するために、インジケーターはボリュームによる分析を使用します。 このインディケータはレディトレーディングシステムです。トレーダーが必要とするのは、信号に従うことだけです。また、インジケーターはあなた自身の取引システムの基礎になることができます。取引はミニッツチャートでのみ行われます。 インジケーターがMTFの原則を使用しているという事実にもかかわらず、インジケーターのアルゴリズムは可能な限り安定しています。 購入後、必ず私に書いてください!私の取引設定と推奨事項をあなたと共有します!
通貨強さウィザードは、取引を成功させるためのオールインワン ソリューションを提供する非常に強力な指標です。このインジケーターは、複数の時間枠のすべての通貨のデータを使用して、このまたはその外国為替ペアのパワーを計算します。このデータは、使いやすい通貨インデックスと通貨パワーラインの形式で表され、特定の通貨のパワーを確認するために使用できます。 必要なのは、取引したいチャートにインジケーターを接続することだけです。インジケーターは、取引する通貨の実際の強さを示します。このインジケーターは、トレンドに合わせて取引するときに有利に利用できる売買高の圧力の極値も示します。このインジケーターには、フィボナッチに基づく可能なターゲットも表示されます。 このインジケーターは、PUSH 通知を含むあらゆるタイプのアラートを提供します。 購入後ご連絡下さい。私の取引のヒントをあなたと共有し、素晴らしいボーナスインジケーターを無料で提供します! 幸せで有益な取引をお祈りします。
The Super Arrow Indicator provides non-repainting buy and sell signals with exceptional accuracy. Key Features No repainting – confirmed signals remain fixed Clear visual arrows: green for buy, red for sell Real-time alerts via pop-up, sound, and optional email Clean chart view with no unnecessary clutter Works on all markets: Forex, gold, oil, indices, crypto Adjustable Parameters TimeFrame Default: "current time frame" Function: Sets the time frame for indicator calculation Options: Can be set
特別オファー : ALL TOOLS 、各 $35 のみ! 新しいツール   は   $30   で   最初の 1 週間   または   最初の 3 回の購入 に提供されます!  Trading Tools Channel on MQL5 : 私の MQL5 チャンネルに参加して最新情報を受け取ろう Volumatic Support/Resistance Levels Scanner は、価格構造に出来高の文脈を追加するサポート・レジスタンス系インジケータです。直近のスイングポイント周辺に取引活動がどのように集中しているかを示すことで、買い/売りの関心が最も高まっている箇所を視覚化します。 MT5 版はこちら:  Volumatic Support Resistance Levels MT5 Scanner その他の製品はこちら:   All P roducts 1 · 概要 本インジケータは、直近の高値・安値から価格ゾーンを描き、そのゾーンごとに出来高ヒストグラムを重ねます。ヒストグラムの厚みは現在の出来高に応じて拡大・縮小し、市場がある価格レベルにどれだけ注目しているかを測る
Trend Screener
STE S.S.COMPANY
4.79 (95)
トレンドインジケーター、1つのツールに組み込まれたすべての重要なトレンド機能を備えたトレンドトレーディングとフィルタリングのための画期的なユニークなソリューション! これは、すべてのシンボル/商品(外国為替、商品、暗号通貨、インデックス、株式)で使用できる100%再描画されていないマルチタイムフレームおよびマルチ通貨インジケーターです。 期間限定オファー: サポートおよびレジスタンス スクリーナー インジケーターは、たった 50 ドルで永久的にご利用いただけます。(元の価格 250 ドル) (オファー延長) トレンドスクリーナーは、チャート内のドットで矢印トレンドシグナルを提供するインジケーターに続く効率的なインジケーターです。 トレンド分析インジケーターで使用できる機能: 1.トレンドスキャナー。 2.最大利益分析を備えたトレンドライン。 3.トレンド通貨強度メーター。 4.アラート付きのトレンド反転ドット。 5.アラート付きの強いトレンドドット。 6.トレンド矢印 毎日の分析例、毎日のシグナルパフォーマンス...など、トレンドスクリーナーインジケーターを使用して、ここで見つけること
Auto Optimized RSI は、正確な売買シグナルを提供するために設計された、使いやすいスマートな矢印インジケーターです。過去のデータを使ったトレードシミュレーションに基づき、各通貨ペアや時間足に最適なRSIの買い/売りレベルを自動で見つけ出します。 このインジケーターは、独立したトレードシステムとしても、既存の戦略の一部としても使用できます。特に短期トレーダーにとって便利なツールです。 従来のRSI(70/30など)の固定レベルとは異なり、 Auto Optimized RSI はリアルな価格の動きとバックテスト結果に基づき、ダイナミックにレベルを調整します。勝率、ドローダウン、平均利益/損失といった重要な統計をモニターし、現在の市場に適応して、本当に機能するシグナルを提供します。 RSIが最適化されたレベルをクロスすると、チャート上に買い・売りの矢印が表示され、成功率の高いエントリーポイントを見つけるのに役立ちます。 ご購入後にご連絡いただければ、追加のツールや特別なトレードのヒントを無料でお渡しいたします! 皆様のトレードが成功しますように!
Advanced Supply Demand
Bernhard Schweigert
4.91 (296)
現在33%オフ 初心者にもエキスパートトレーダーにも最適なソリューション このインジケーターは独自の機能と新しい公式を多数内蔵しており、ユニークで高品質かつ手頃な取引ツールです。このアップデートでは、2つの時間枠ゾーンを表示できるようになります。より長いTFだけでなく、チャートTFとより長いTF(ネストゾーンを表示)の両方を表示できます。すべてのSupply Demandトレーダーの皆さんのお気に召すはずです。:) 重要情報の公開 Advanced Supply Demandの可能性を最大化するには、 https://www.mql5.com/ja/blogs/post/720245 にアクセスしてください。   エントリーまたはターゲットの正確なトリガーポイントを正確に特定できれば取引がどのように改善されるか想像してみてください。新しい基盤となるアルゴリズムに基づいて構築されているため、買い手と売り手の間の潜在的な不均衡をさらに簡単に特定できます。これは、最も強い需要と供給のゾーンと、過去のパフォーマンス(古いゾーンを表示)がグラフィカルに表現されるためです。これらの機能は、最適な
このインジケーターを購入すると、プロ仕様のトレードマネージャーを無料で差し上げます。 まず第一に、このトレーディングシステムがノンリペイント、ノンリドロー、ノンラグのインジケーターであることを強調する価値がある。これにより、手動取引とロボット取引の両方に理想的なものになっています。 オンラインコース、マニュアル、プリセットのダウンロード。 「スマートトレンドトレーディングシステム MT5」は、新規および経験豊富なトレーダー向けにカスタマイズされた包括的なトレーディングソリューションです。10以上のプレミアムインジケーターを組み合わせ、7つ以上の堅実なトレーディング戦略を備えており、多様な市場状況に対応する多目的な選択肢となっています。 トレンドフォロー戦略:トレンドを効果的に乗り越えるための正確なエントリーとストップロス管理を提供します。 リバーサル戦略:潜在的なトレンドの反転を特定し、トレーダーがレンジ相場を活用できるようにします。 スキャルピング戦略:高速で正確なデイトレードおよび短期取引のために設計されています。 安定性:すべてのインジケーターはノンリペイント、ノンリドロー、ノ
現在20%OFF! 初心者やエキスパートトレーダーに最適なソリューションです。 このインディケータは、エキゾチックペア・コモディティ・インデックス・先物など、あらゆるシンボルの通貨の強さを表示することに特化したインディケータです。金、銀、原油、DAX、US30、MXN、TRY、CNHなどの通貨の強さを表示するために、9行目にどのシンボルでも追加することができます。独自の機能を多数搭載し、新しい計算式を採用したため、ユニークで高品質、かつ手頃な価格のトレーディングツールとなっています。新しいトレンドやスキャルピングチャンスのトリガーポイントを正確に把握することができるため、あなたのトレードがどのように改善されるか想像してみてください。 ユーザーマニュアル:ここをクリック   https://www.mql5.com/en/blogs/post/708876 すべての時間枠に対応します。あなたはすぐにトレンドを見ることができるようになります! 新しいアルゴリズムに基づいて設計されているため、潜在的な取引の特定と確認がより簡単になります。これは、8つの主要通貨と1つのシンボルの強弱
Special offer : ALL TOOLS , just $35 each! New tools   will be   $30   for the   first week   or the   first 3 purchases !  Trading Tools Channel on MQL5 : Join my MQL5 channel to update the latest news from me ICTの 反転フェアバリューギャップ (IFVG) の概念を活用した Inversion Fair Value Gaps Indicator でその力を解放しましょう!この最新ツールは、フェアバリューギャップ (FVG) を次のレベルに引き上げ、反転したFVGゾーンを特定して表示します。これらは、価格修正後に形成される重要なサポートおよびレジスタンスエリアです。スキャルパー、スイングトレーダー、長期投資家のいずれであっても、IFVGインジケーターはリアルタイムでの意思決定にとって貴重な洞察を提供します。 MT5バージョンはこちら:   Inversion Fair Va
これは、キャンドルの終値を予測する指標です。 このインジケータは、主にD1チャートでの使用を目的としていますが. この指標は、従来の外国為替取引とバイナリオプション取引の両方に適しています。 インジケーターは、スタンドアロンのトレーディングシステムとして使用することも、既存のトレーディングシステムへの追加として機能させることもできます。 このインジケーターは、現在のキャンドルを分析し、キャンドル自体の内部の特定の強度係数と、前のキャンドルのパラメーターを計算します。 したがって、この指標は、市場の動きのさらなる方向性と現在のキャンドルの終値を予測します。 この方法のおかげで、この指標は、短期の日中取引だけでなく、中期および長期の取引にも適しています。 インジケーターを使用すると、市場の状況の分析中にインジケーターが生成する潜在的な信号の数を設定できます。 インジケーターの設定には、このための特別なパラメーターがあります。 また、インジケーターは、チャート上のメッセージの形式で、電子メールで、およびPUSH通知の形式で、新しい信号について通知することができます。 購入後は必ず私に書いて
特別オファー : すべてのツール 、各 $35 ! 新しいツール   は   最初の 1 週間   または   最初の 3 回の購入 について   $30 !  MQL5 の Trading Tools チャンネル :最新情報を受け取るために私の MQL5 チャンネルに参加してください Stochastic Z-Score は、価格を Z-Score で正規化し、確率論的ロジックで範囲化し、HMA で平滑化するモメンタム・オシレーターです。長期的な文脈として ALMA を用います。オプション要素として、ヒストグラム、動的バンド、反転ラベルがあります。 MT5 版はこちら:  Stochastic Z Score MT5 Scanner MT4 版はこちら:  Stochastic Z Score MT4 Scanner その他の製品:   All P roducts Overview Stochastic Z-Score は、ボラティリティで正規化した Z-Score と確率的ロジックを組み合わせ、Hull Moving Average (HMA) で平滑化します。 価格の乖離を正
Hidden Cycles
Lev Vladimirovic Marushkin
5 (1)
Black Friday Sale – Limited Time! Grab Hidden Cycles for only $129 (regular price $179 ). This is your chance to boost your strategy with a powerful, easy-to-use cycle-based trading tool. Offer ends soon — don’t miss it! Based on Universal Laws — NOT Some Guy’s Algorithm: Let the market adjust to the Hidden Cycles Geometry — not the other way around. Most indicators are based on a man-made formula. They often lag, fail over time, or need constant re-optimization.  Hidden Cycles is different.
Gold Venamax   - これは最高の株式テクニカル指標です。 指標アルゴリズムは資産の価格変動を分析し、ボラティリティと潜在的なエントリーゾーンを反映します。 インジケーターの機能: これは、快適で収益性の高い取引のためのマジックとトレンド矢印の 2 つのブロックを備えたスーパー インジケーターです。 チャート上にブロックを切り替えるための赤いボタンが表示されます。 マジックはインジケーター設定で設定されているため、異なるブロックを表示する 2 つのチャートにインジケーターをインストールできます。 Gold Venamax は、異なる矢印バッファー (GV と SD) を備えた 2 つのチャートに配置できます。 これを行うには、設定で異なる Magic を選択する必要があります。たとえば、あるマジック = 999、別のマジック = 666 を選択します。次に、チャート上の赤いボタンで矢印バッファを選択できます。 インジケーター設定の各矢印バッファー (GV および SD) には、快適で収益性の高い取引のための個別の矢印フィルターがあります (UseFiltrGV = tru
Was: $299  Now: $99   Supply Demand uses previous price action to identify potential imbalances between buyers and sellers. The key is to identify the better odds zones, not just the untouched ones. Blahtech Supply Demand indicator delivers functionality previously unavailable on any trading platform. This 4-in-1 indicator not only highlights the higher probability zones using a multi-criteria strength engine, but also combines it with multi-timeframe trend analysis, previously confirmed swings
現在31%オフ! 初心者やエキスパートトレーダーに最適なソリューション! このインジケータは、独自の機能と秘密の数式を組み込んだ、ユニークで高品質かつ手頃な価格のトレーディングツールです。たった1枚のチャートで28の通貨ペアのアラートを表示します。新しいトレンドやスキャルピングチャンスの引き金となるポイントを正確に把握することができるので、あなたのトレードがどのように改善されるか想像してみてください! 新しい基本的なアルゴリズムに基づいて構築されているため、潜在的な取引の特定と確認がより簡単になります。これは、通貨の強さや弱さが加速しているかどうかをグラフィカルに表示し、その加速のスピードを測定するためです。加速すると物事は明らかに速く進みますが、これはFX市場でも同じです。つまり、反対方向に加速している通貨をペアにすれば、利益を生む可能性のある取引を特定することができるのです。 通貨の勢いを示す縦の線と矢印は、あなたの取引の指針となるでしょう。 ダイナミックマーケットフィボナッチ23レベルはアラートトリガーとして使用され、市場の動きに適応します。もしインパルスが黄色のトリガ
特別オファー : ALL TOOLS 、各 $35 のみ! 新しいツール   は   最初の週   または   最初の 3 つの購入   で   $30 になります!  Trading Tools Channel on MQL5 :最新情報を受け取るにはチャンネルに参加してください RSI Shift Zone Scanner は、RSI シグナルをプライスアクションと結び付け、市場センチメントが変化する可能性のある瞬間を特定します。RSI が設定レベル(デフォルトでは 70=買われ過ぎ、30=売られ過ぎ)を上抜け・下抜けすると、インジケーターはチャート上にチャネルを描画します。これらのチャネルはセンチメントが反転した可能性のある領域を示し、サポートやレジスタンスとして機能することがあります。 MT5 版はこちら:  RSI Shift Zone MT5 Scanner その他の製品:  All P roducts RSI が上限または下限をクロスすると、新しいチャネルが生成されます。 チャネルの境界はクロスしたローソク足の高値と安値に固定され、中間線が平均値を示します。 各チャネル
このインジケーターは実践的なトレードに最適な自動波動分析のインジケーターです! 場合... 注:   Tang Lun (Tang Zhong Shuo Zen) の命名規則の影響で、私は波のグレーディングに西洋の名前を使用することに慣れていません。基本的な波を ペン 、二次波のバンドを セグメント と名付けました。同時に、 セグメント にはトレンドの方向が指定されます (この命名方法は将来のノートで使用されます。最初に言っておきます)。ただし、アルゴリズムは曲がりくねった理論とはほとんど関係がないため、付けるべきではありません。これは、私の市場分析 によって要約された、絶えず変化する複雑な運用ルール を反映しています。 バンドは標準化され、人によって異なることがないよう定義されており、市場参入を厳密に分析する上で重要な役割を果たす人為的な干渉の描画方法が排除されています。 このインジケーターを使用することは、取引インターフェイスの美しさを改善することと同等であり、元の K ライン取引を放棄し、取引の新しいレベルに連れて行きます。また、宣伝の観点から顧客の認識も向上します。 イ
現在20%OFF! 初心者やエキスパートトレーダーのためのベストソリューション! このダッシュボードソフトウェアは、28の通貨ペアで動作しています。それは私達の主要な指標(高度な通貨の強さ28と高度な通貨インパルス)の2に基づいています。それは全体の外国為替市場の大きい概観を与えます。それは、すべての(9)時間枠で28の外国為替ペアのための高度な通貨の強さの値、通貨の動きの速度と信号を示しています。チャート上で1つのインディケータを使用して市場全体を観察し、トレンドやスキャルピングの機会をピンポイントで見つけることができたら、あなたのトレードがどのように改善されるか想像してみてください。 このインディケータには、強い通貨と弱い通貨の識別、潜在的な取引の識別と確認がより簡単になるような機能が搭載されています。このインディケータは、通貨の強さや弱さが増加しているか減少しているか、また、すべての時間枠でどのように機能しているかをグラフィカルに表示します。 新機能として、現在の市場環境の変化に適応するダイナミックなマーケットフィボナッチレベルが追加され、すでに当社のAdvanced
Special offer : ALL TOOLS , just $35 each! New tools   will be   $30   for the   first week   or the   first 3 purchases !  Trading Tools Channel on MQL5 : Join my MQL5 channel to update the latest news from me ボリュメトリックオーダーブロック多時間枠 インジケーターは、主要な市場参加者が注文を蓄積する重要な価格エリアを特定することで、より深い市場の洞察を求めるトレーダー向けに設計された強力なツールです。これらのエリアはボリュメトリックオーダーブロックとして知られており、サポートやレジスタンスの潜在的ゾーンとして機能し、取引の意思決定において重要な優位性を提供します。 MT5バージョンを見る:   Volumetric Order Blocks MT5 Multi Timeframe See more products at:   https://www.mql5.com/en
作者のその他のプロダクト
Индикатор сглаженного MACD (xMACD) Входные параметры: Fast EMA Period - период быстрой EMA Slow EMA Period   - период медленной EMA Signal SMA Period   - период сигнальной SMA Applied Price - тип цены (0 - CLOSE | 1 - OPEN | 2 - HIGH | 3 - LOW | 4 - MEDIAN | 5 - TYPICAL | 6 - WEIGHTED) Принцип работы Индикатор перерассчитывает стандартный технический индикатор MACD (дважды усредняет получаемые значения). Индикаторный буфер не перерисовывается.
FREE
Индикатор сглаженного Stochastic Oscillator (xStoh) Входные параметры: xK Period - K период xD Period - D период xSlowing - замедление xMethod - метод усреднения (0-SMA | 1-EMA | 2-SMMA | 3 - LWMA) xPrice field - тип цены (0 - Low/High | 1 - Close/Close) Принцип работы Индикатор перерассчитывает стандартный технический индикатор Stochastic Oscillator (дважды усредняет получаемые значения iStochastic).
FREE
The indicator calculates a combination of two moving averages and displays their trend in derivative units. Unlike traditional oscillators, the maximum and minimum values ​​in this indicator always correspond to the number of bars you want to track. This allows you to use custom levels regardless of volatility and other factors. The maximum and minimum values ​​are always static and depend only on the initial Bar review settings. The indicator can be used as an independent trading systemtrading
FREE
Индикатор сглаженного DeMarker  Oscillator (xDeM) Входные параметры: Period - период усреднения Принцип работы Индикатор перерассчитывает стандартный технический индикатор DeMarker Oscillato r (дважды усредняет получаемые значения). Период усреднения индикатора соответствует двойному периоду стандартного DeMarker  Oscillato r . Например : xDeM с периодом усреднения 7 соответствует DeM c периодом 14. Индикаторный буфер не перерисовывается.
FREE
Индикатор сглаженных Bollinger Bands (xBB) Входные параметры: xBB Period - период усреднения xBB Price - используемая цена ( 0 - CLOSE | 1 - OPEN | 2 - HIGH | 3 - LOW | 4 - MEDIAN | 5 - TYPICAL | 6 - WEIGHTED) xBB Deviation - отклонение xBBColor - цвет индикаторных линий xBB Width - толщина индикаторных линиц Принцип работы Индикатор перерассчитывает стандартный технический индикатор Bollinger Bands (дважды усредняет получаемые значения iBands). Период усреднения индикатора соответствует двой
FREE
The indicator searches for matches in history for a specified range of the latest known oscillated Moving Average data. Found matches are indicated on the graph as colored fields. Analysis of historical data (the behavior of quotes in history) will help make decisions in trading. The matches found are updated when a new bar is opened (i.e., the calculation is performed upon opening prices). The value of the increase accuracy (Accuracy) must be changed with a decrease in the timeframe, and de
FREE
Индикатор сглаженного Moving Average (xMA) Входные параметры: xMA Period - период усреднения xMA Method - метод усреднения  ( 0-SMA | 1-EMA | 2-SMMA | 3 - LWMA) xMA Price - используемая цена ( 0 - CLOSE | 1 - OPEN | 2 - HIGH | 3 - LOW | 4 - MEDIAN | 5 - TYPICAL | 6 - WEIGHTED) xMA Color - цвет индикаторной линии xMA Width - толщина индикаторной линии Принцип работы Индикатор перерассчитывает стандартный технический индикатор Moving Average (дважды усредняет получаемые значения iMA). Период с
FREE
Сигнальный индикатор "SDATA" рассчитывается на основе стандартного отклонения от простой средней скользящей пропорционально среднеквадратичному отклонению. Настройки индикатора: Data bars - количество баров для рассчета Deviation Data - среднеквадратичное отклонение Smooth Data - сглаживание данных Code Arrow Buy - код значка на покупку Color Arrow Buy - цвет значка на покупку Code Arrow Sell - код значка на продажу Color Arrow Sell - цвет значка на продажу В момент инициализации индикатора (при
The Extremum Average signal indicator works on all timeframes and any markets. Analyzes the smoothed data of extremums and gives signals to sell or buy. The indicator has only two settings: Number of Bars - the number of last bars to search for an extremum Period Average - Period (number of last bars) for data smoothing For each timeframe and market, you need to select its own values. Additionally, in the indicator settings, you can set your own style of signal display: Size Arrow Code Arrow B
The Changend signal indicator works on all timeframes and any markets. Analyzes data in the specified period and gives signals for a possible trend change (sell or buy). The indicator has only two settings: Period bars   - the number of last bars for data analysis Deviation level of bars  -the degree of deviation from the analyzed data Additionally, in the indicator settings, you can set your own style of signal display: Size Arrow Code Arrow Buy Color Arrow Buy Code Arrow Sell Color Arrow Sel
Full automatic. Does not require technical settings. Works on all currency pairs. The indicator has a built-in zigzag filter that limits repetitions of unidirectional signals (i.e. after a buy signal, the next one will be a sell signal, and vice versa). For the convenience of displaying, the indicator provides settings for the type of icons, their color and size: Size Arrow Code Arrow Buy Color Arrow Buy Code Arrow Sell Color Arrow Sell Indicator signals are not redrawn.
Tame the trend just got easier! The PDS indicator will signal the use of price sentiment. Just one setting! Study the offer of the indicator and get the opportunity for profitable trading based on a proven and tested strategy. The mathematical algorithm proves its performance even to skeptics under any market conditions. It goes well with any trading strategy. Never recalculates signals. Signals appear at the opening of the bar. Works with any financial instruments, including forex, cryptocurr
Martingale grid panel - a semi-automatic Expert Advisor with a built-in trading panel. The Expert Advisor is activated by standard MT4 tools (or via its own panel) and automatically sets Take Profit, Stop Loss, Trailing Stop. Automatically or manually opens averaging orders. Changes the volume of orders in accordance with the Martingale strategy. Works with all orders of the selected symbol or only those opened from the panel, when the ID number is set. The Expert Advisor (and its Free Demo) are
The Bars Deflection trend indicator can be used with any trading pair and on any time frame. With this indicator it is impossible to miss the beginning of a trend. Use Bars Deflection as a standalone strategy or as an addition to yours. Signal arrows appear on the chart at the moment the bar opens and are located at the breakout level of the reverse movement. Thus, the arrows not only indicate the possible direction of movement of the quote, but also act as levels for analyzing the placement of
The trend indicator processes each bar of the chart and displays signal arrow on it. In the default display settings: red arrow - sell signal blue arrow - buy signal If the arrows are missing on some bars, this means that the algorithm has not identified a consensus on the signal on this bar. The indicator does not have any technical settings for the algorithm. The process of finding a consensus is fully automated. For ease of visualization on charts, user settings allow you to set the size of
フィルタ:
レビューなし
レビューに返信