Anomalous dispersion
- インディケータ
- バージョン: 2.0
- アップデート済み: 10 6月 2026
- アクティベーション: 15

Technical Indicator: Anomalous Dispersion
Anomalous Dispersion is an innovative technical analysis tool based on the study of dynamic volatility and mathematical price variance. The indicator is specifically designed to detect hidden phases of market culmination, extreme energy compression, and to pinpoint high-probability, historically significant price levels.
Mathematical Concept
The underlying algorithm continuously analyzes and compares two distinct quadratic functions:
- Current Dispersion Period — evaluates the immediate "pulse" of the market and the real-time quadratic variance of the price relative to its moving average values.
- Historical Dispersion Period (Smoothed Dispersion) — serves as a historical benchmark, representing the normal, baseline variance level for the analyzed asset.
The market typically fluctuates between two key states:
- Normal Dispersion: The boundaries of the calculated range expand proportionally to the rise in current volatility, tracking standard market noise.
- Anomalous Dispersion: A mathematical paradox where, during a sharp price impulse, the quadratic functions reverse their behavior. Instead of expanding, the range boundaries "collapse" and invert (turn inside out).
Trading Logic and Level Mechanics
At the exact moments when anomalous dispersion occurs, the indicator captures "Moment X" — the price of the specific bar where the inverted compression began. A powerful, institutional-grade level is established at this precise price coordinate.
Why It Works:
Anomalous values represent zones of aggressive price churning where key battles between buyers and sellers take place (smart money redistributing and accumulating positions). The locked-in level acts as a price magnet: if the price impulsively breaks away from this zone, it tends to return for a retest in the majority of cases, as this area represents the equilibrium of supply and demand. Levels formed by these anomalies become pivotal target zones that the price naturally gravitates toward.
Visual Performance and Settings
The indicator is fully optimized for real-time operation (0% CPU overhead due to strict tick filtering within a single bar) and features highly customizable visual settings:
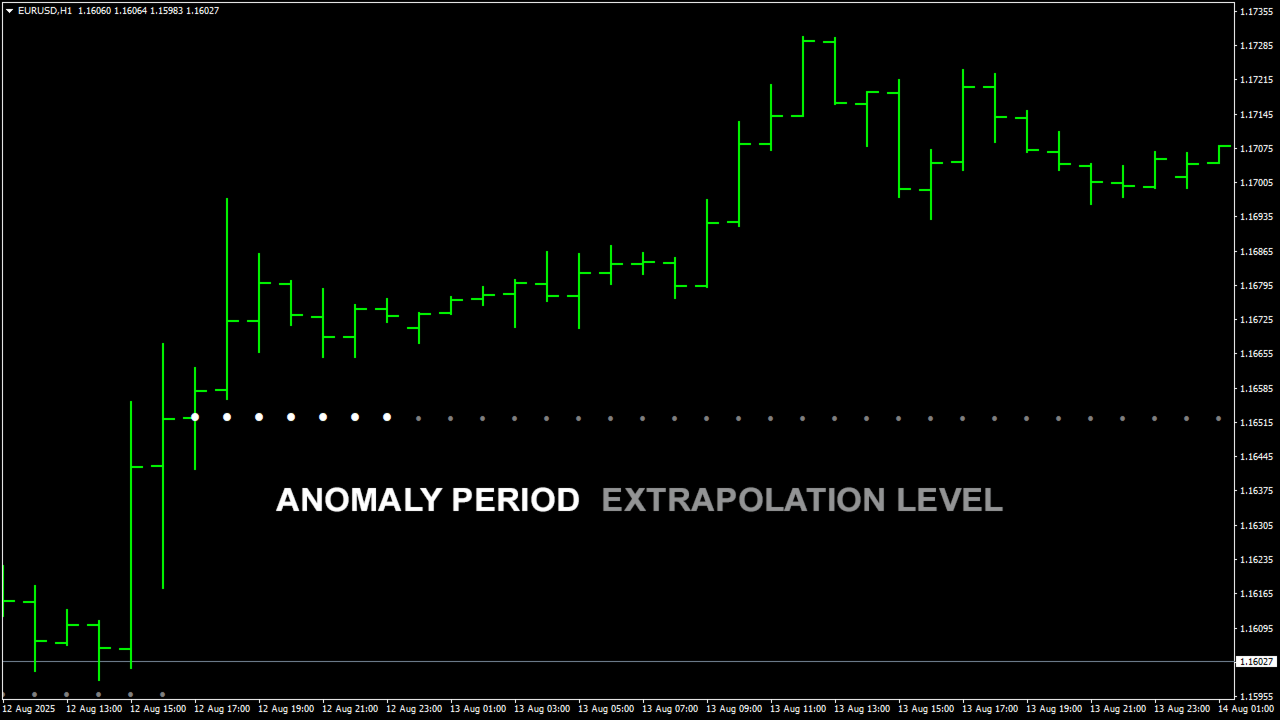
- Anomaly Period (Compression Phase): Displayed on the chart using one set of custom icons, visually demonstrating how long the market remains in an anomalous state.
- Extrapolation Level: Plotted as a horizontal line made of a different set of icons, locking in the exact price of the breakout.
- Customization: Users can individually adjust the color, size, and symbol code (Wingdings) for both types of displays. This allows for seamless operation of multiple indicator instances with different parameters on a single chart.
Technical Specifications:
- All calculations are performed strictly based on Open prices.
- The visual layout is completely non-repainting (values on closed bars remain permanently fixed).