Trend MA Candles
- インディケータ
- バージョン: 25.1
- アップデート済み: 16 2月 2025

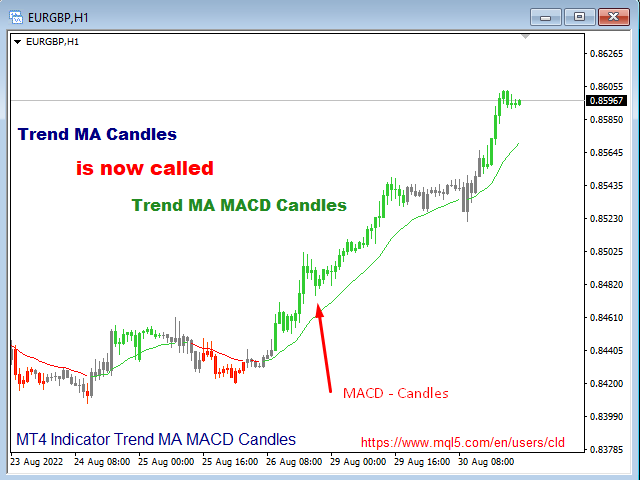
COLORED TREND MA / MACD CANDLES
- draw MA Candles above/below Moving Average in a single color
- draw MA as a leading Line like a Supertrend
- draw MA as a Channel => MA High and Low
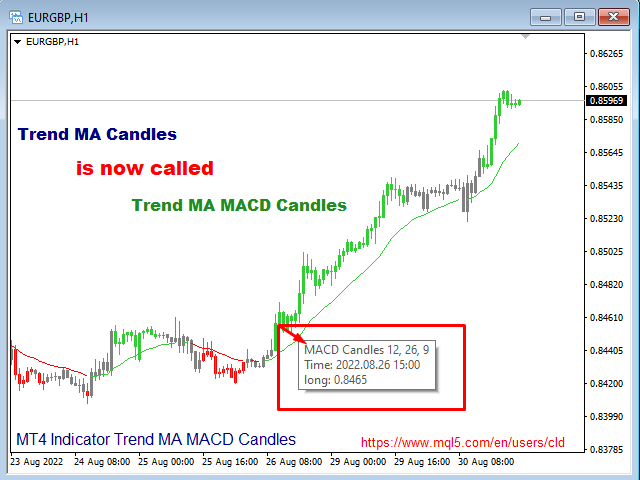
- draw MACD Candles above and below 0 and Signal-Line
Your Advantage:
- a simple view of the trend direction
- a simple view over the higher trend direction
- a calmer chart for the eye
- clear rules can be defined
- Bars to process: 6000 is my default, this value is up to you
- Value Quick-Set: pre-Settings
- MACD 12 / 26 / 9
- MACD 3 / 9 / 6
- MACD customize
- MA Candles
- Fast EMA: 12
- Slow EMA: 26
- MACD SMA: 9
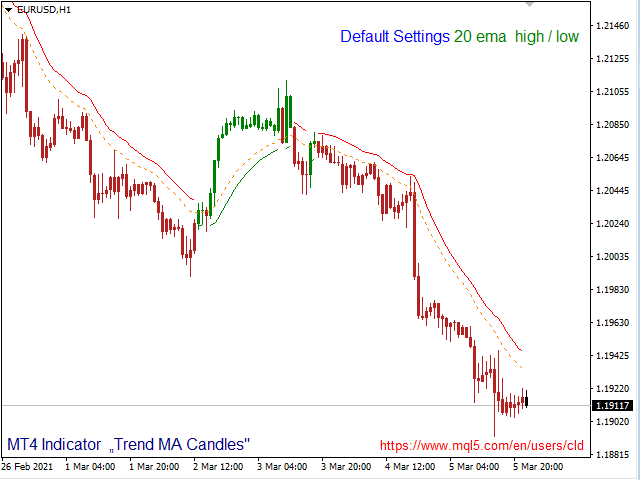
- MA Period: default 20, which is my favorite for all timeframes, I believe in the 20 ema as a proof for trend-direction (in combination with a higher timeframe)
- MA Shift: 0
- MA Mode: default exponential, is my favorite MA-Mode
- MA Price middle: Close price for the middle-line
- MA Price high: High price (high / low for a channel, close for all 3 lines, means a continuous line)
- MA Price low: Low price (high / low for a channel, close for all 3 lines, means a continuous line)
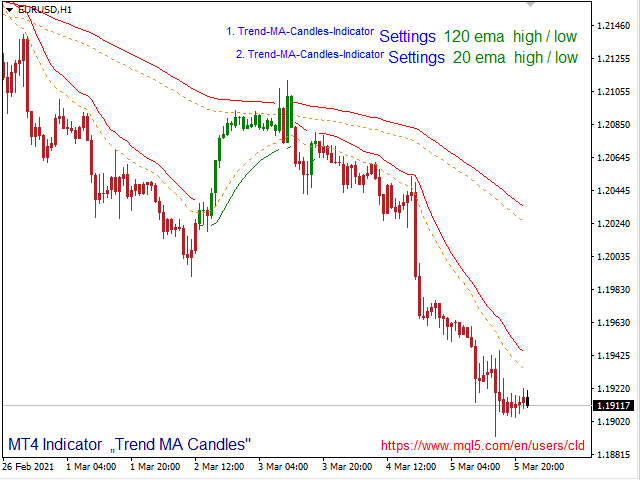
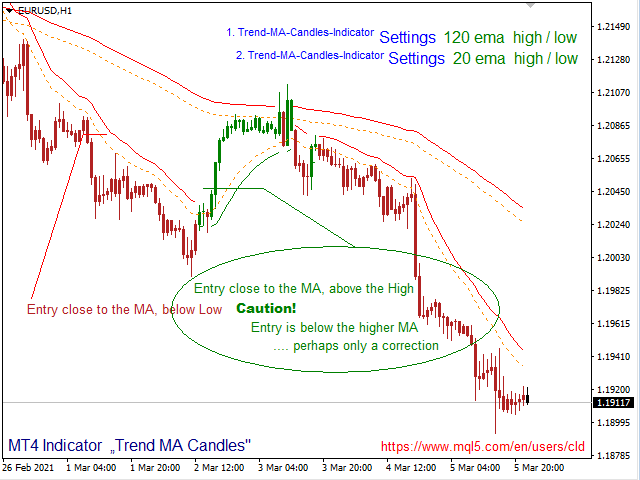
Rules I, as shown in screenshots, Trading the H1-Chart:
- H1:
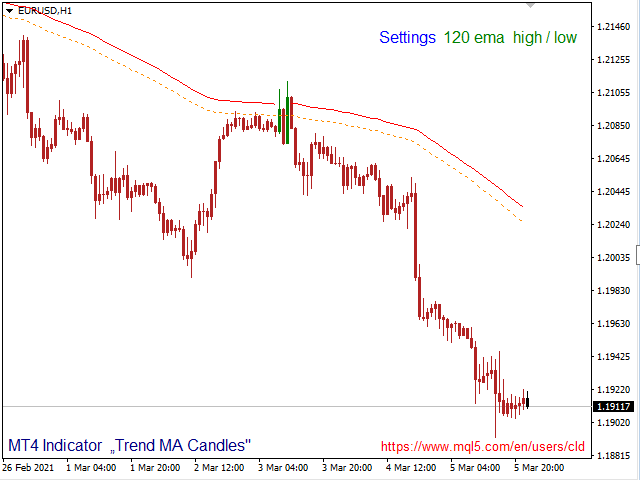
- 1. Trend-MA-Candles: colored Trend MA=120
- 2. Trend-MA-Candles: default
- short:
- red Candle closed
- Close needs to be below 20ema/low (green line)
- Entry a few pips below that Candle
- if the Candle is obvious very long, be careful, it could be wise to wait for an Entry closer to the MA
- if the 120ema is below that Entry-Candle / far away, it could just be a correction and not a trend-change
- the longer the trend runs, the more likely is a correction or a trend-change
- Risk => a few pip above the Entry-Candle
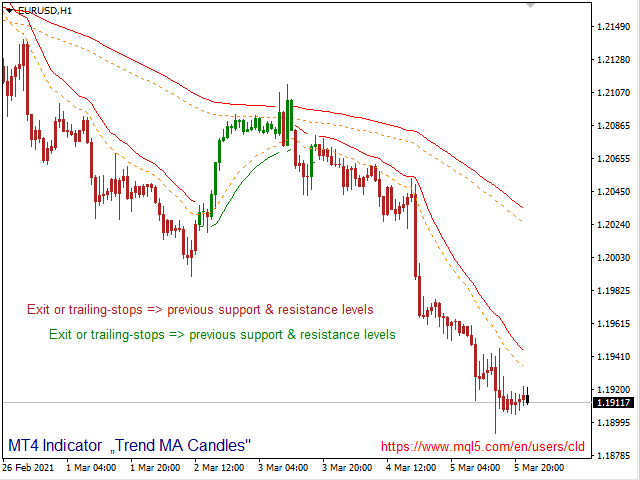
- Target => previous support and resistance levels
- long:
- green Candle closed
- Close needs to be above 20ema/high (red line)
- Entry a few pips above that Candle
- if the Candle is obvious very long, be careful, it could be wise to wait for an Entry closer to the MA
- if the 120ema is above that Entry-Candle / far away, it could just be a correction and not a trend-change
- the longer the trend runs, the more likely is a correction or a trend-change
- Risk => a few pips below the Entry-Candle
- Target => previous support and resistance levels
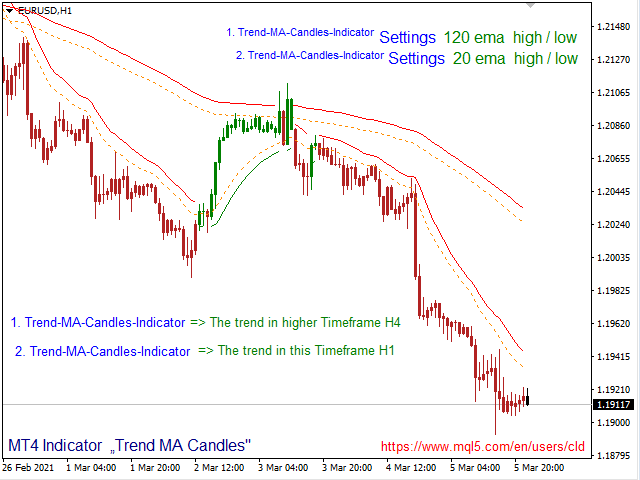
Rules II, watching H4, Trading H1:
- Settings H4:
- default
- Settings H1:
- default
- short / long:
- H4
- obvious Trend below / above MA
- H4 and H1 need to be in the same trend-direction
- H1
- red Candle closed / green Candle closed
- Close needs to be below 20ema/low (green line) / above 20ema/high (red line)
- Entry a few pips below that Candle / above that Candle
- if the Candle is obvious very long, be careful, it could be wise to wait for an Entry closer to the MA
- the longer the trend runs, the more likely is a correction or a trend-change
- Risk => a few pips above the Entry-Candle / below the Entry-Candle
- Target => previous support and resistance levels
Recommendations
- I don't trade after over-size-candles
- I only go for a clear trend on the higher time-frame
- I stay out before high-impact news hit the market
- Always on my mind, major Support and Resistance
- No trade without money-management, please calculate your risk, trade smart
- There is no guarantee of success as in any trading business / in my examples above


thx, can be used.