KT Currency Strength Meter MT5
- インディケータ
- バージョン: 1.0
- アクティベーション: 5

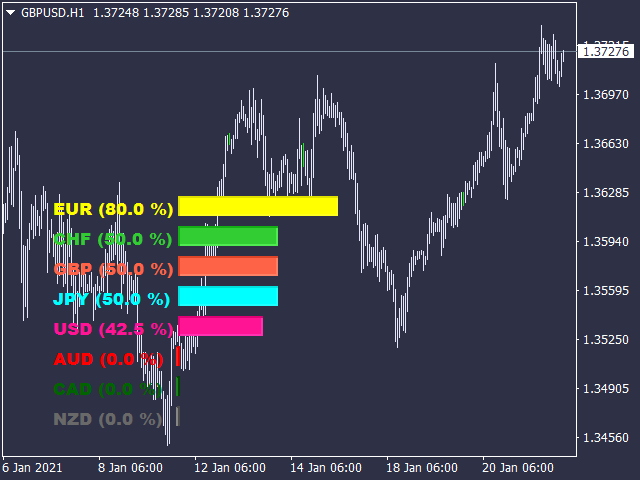
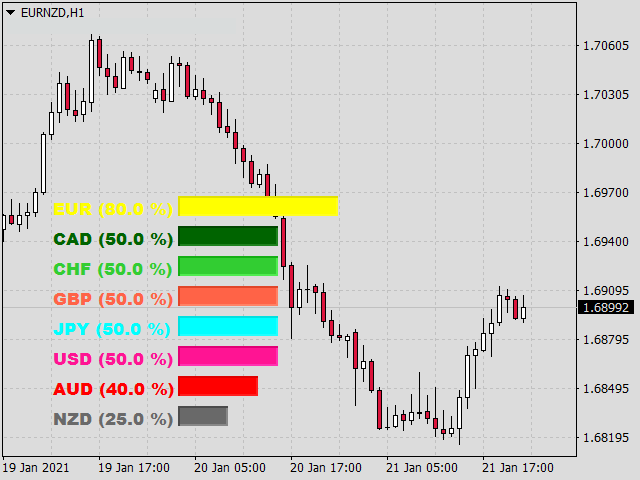
KT Currency Strength Meter は、主要なFX通貨ペアに集約された数学的計算式を適用することで、各通貨の強さと弱さを測定します。
固定された期間内の強気および弱気のローソク足に基づいて通貨の強さが計算されます。その後、アルゴリズムが最も強い通貨と最も弱い通貨をリアルタイムのデータで並べ替え、継続的に順位を更新します。
利点
- 強い通貨に対して弱い通貨を買うような誤った取引シグナルを除外することで、トレーディング戦略を即座に改善できます。
- 意図しないヘッジ取引や過剰取引を回避します。
- 最強通貨に対して最弱通貨を買うといった、リスクの高い逆張り取引を避けられます。
- 互いに打ち消し合うようなポジションをフィルタリングします。
- 最新データを用いてリアルタイムで更新されます。
- 軽量設計でPCのリソースを最小限に抑え、他のインジケーターやEAに影響を与えません。
- 各通貨に専用カラーが割り当てられており、識別が簡単です。
- 複雑な設定は不要で、シンプルで直感的な入力パラメータ。
プロのヒント
- データは現在の時間足から取得されるため、低い時間足での使用は避けてください。データの変動が頻繁で安定性が欠けます。
- 重要な経済指標発表時は指標に依存しすぎないようにしましょう。ファンダメンタルズ分析が優先されます。
- このインジケーターは、主なシグナル生成ではなく「確認」として使用するのが最適です。
- 相関分析も組み合わせたい場合は、より高度な計算と相関マトリックスを搭載した 通貨強弱&相関インジケーター をご検討ください。