InfinX Breakout
- インディケータ
- バージョン: 1.0
- アクティベーション: 10

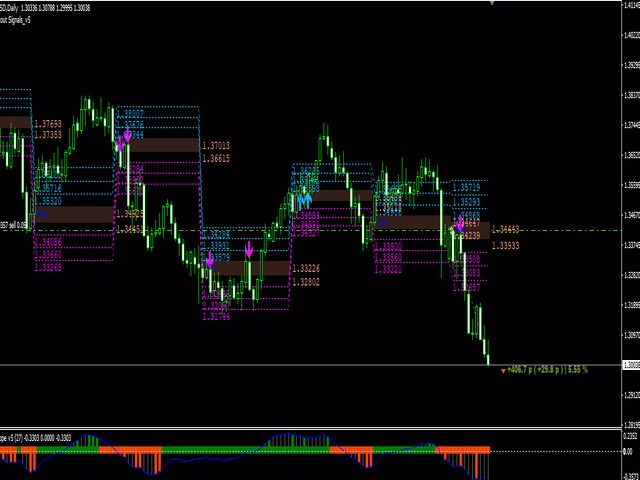
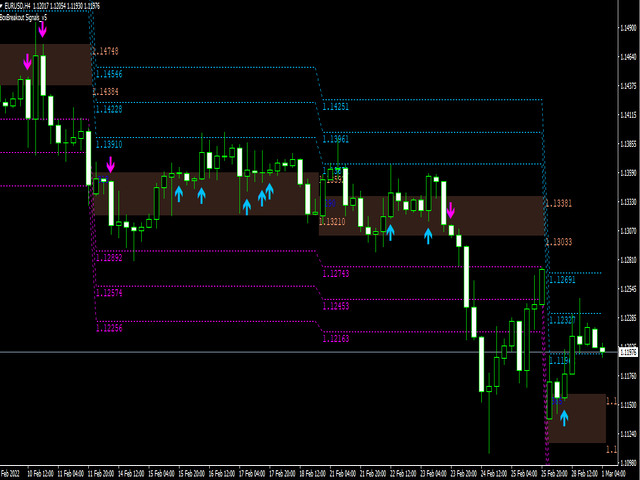
A breakout refers to when the price of an asset moves above a resistance area, or moves below a support area. Breakouts indicate the potential for the price to start trending in the breakout direction. For example, a breakout to the upside from a chart pattern could indicate the price will start trending higher.The indicator works with arrows in case of breakthrough, you also have a level of 1 tp, a level of 2 tp, a level of 3 tp.
For more information, welcome to our Telegram Group.