InfinX Hull Mavg MT5
- インディケータ
- バージョン: 1.0
- アクティベーション: 10

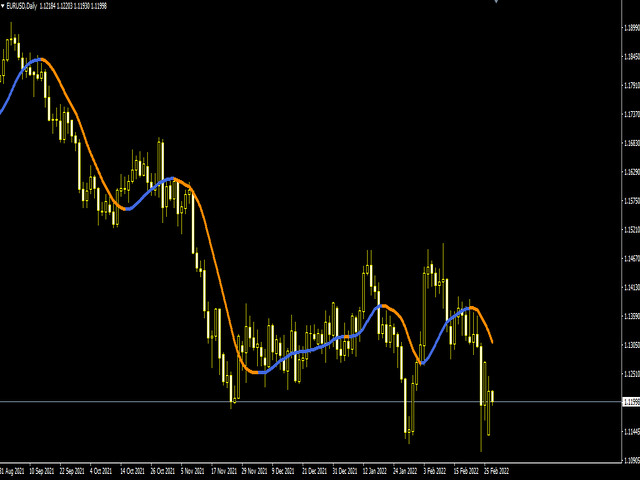
The Hull Moving Average (HMA) attempts to minimize the lag of a traditional moving average while retaining the smoothness of the moving average line. Developed by Alan Hull in 2005, this indicator makes use of weighted moving averages to prioritize more recent values and greatly reduce lag. The resulting average is more responsive and well-suited for identifying entry points.
For more information, welcome to our Telegram Group.