ADR Scalping Indicator MT4
- インディケータ
- バージョン: 1.30
- アップデート済み: 4 7月 2022
- アクティベーション: 10
これは簡単に最も見過ごされている指標であり、価格行動に関するほとんどの洞察を提供します。それは私が自分で使用する唯一の指標です。
この指標は、今日の価格の動きと、最も可能性の高い方向についての洞察を提供します。
ADRは、1日の平均範囲を表します。日中取引または頭皮を使用する場合は、価格が変動する範囲を知っている必要があります。
価格がその日の通常の半分に移動し、価格アクションの最下部にあるとすると、価格が再び完全に上昇して1日の平均範囲に到達するのではなく、下降し続ける可能性が高くなります。価格は常に平均的な1日の範囲で動くことを目指しています。
また、動的なサポートと抵抗が与えられます。価格が平均レンジと同じくらい移動したとき、あなたは中間に向かって取引することができます。
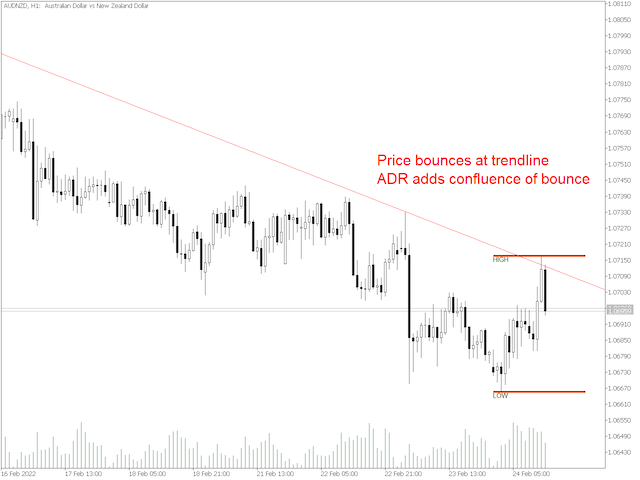
このインジケーターは、価格がトレンドラインから跳ね返る可能性があるかどうかも通知します。したがって、トレンドラインを使用して取引する場合は、これが指標になります。
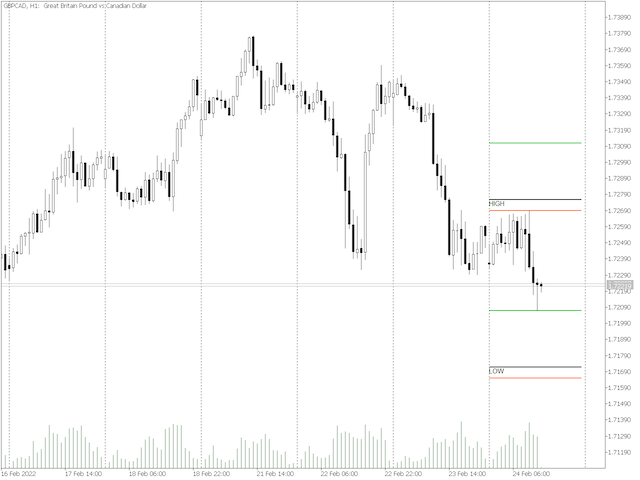
3種類のレンジがあります。
1.ブラックレンジ-現在の価格に基づく現在のレンジですが、価格が平均よりも大きく変動する場合は、上または下に移動します。この範囲は、価格がADRの50%以上移動したときに、他の2つの範囲のいずれかに一致するようになります。
2.グリーンレンジ-今日の安値から計算した場合、価格は平均してどこまで移動しますか?
3.赤の範囲-今日の高値から計算した場合、価格は平均してどこまで移動しますか?