ADR Scalping Indicator MT4
- 지표
- 버전: 1.30
- 업데이트됨: 4 7월 2022
- 활성화: 10
이것은 가격 행동에 대한 대부분의 통찰력을 제공하는 가장 간과되기 쉬운 지표입니다. 그것은 내가 나 자신을 사용하는 유일한 지표입니다.
이 지표는 오늘 가격이 얼마나 움직일 것이며 어떤 방향으로 움직일 것인지에 대한 통찰력을 제공합니다.
ADR은 평균 일일 범위를 나타냅니다. 인트라데이나 스캘핑을 한다면 가격이 얼마나 움직일지 범위를 알아야 합니다.
가격이 하루 정상치의 절반으로 움직였다고 가정하고 가격 행동의 바닥에 있다고 가정해 보겠습니다. 가격이 일일 평균 범위에 도달하기 위해 완전히 다시 오르기보다는 계속해서 하락할 가능성이 더 큽니다. 가격은 항상 평균 일일 범위에서 움직이려고 합니다.
당신은 또한 역동적인 지원과 저항을 받게 될 것입니다. 가격이 평균 범위만큼 이동하면 중간으로 거래 할 수 있습니다.
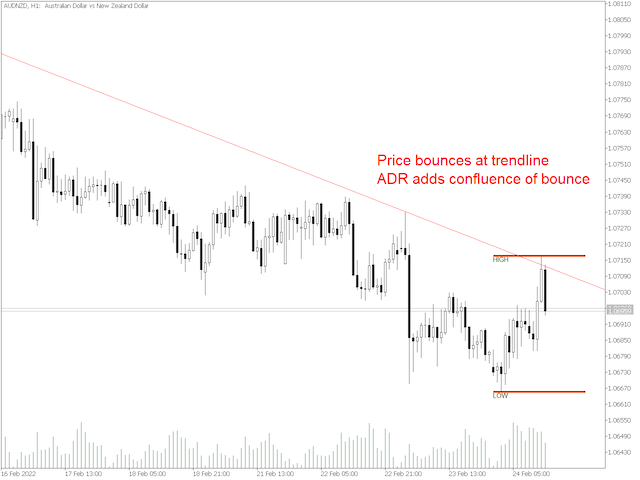
이 표시기는 가격이 추세선에서 반등할 가능성이 있는지 여부도 알려줍니다. 따라서 추세선을 사용하여 거래하고 싶다면 이것이 지표입니다!
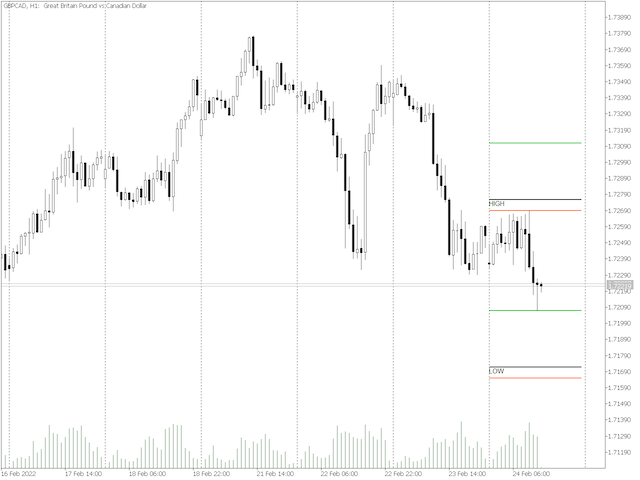
3가지 종류의 범위를 얻을 수 있습니다.
1. 검은색 범위 - 현재 가격을 기준으로 하는 현재 범위이지만 가격이 평균 이상으로 움직일 경우 상단 또는 하단에 자석을 붙입니다. 이 범위는 가격이 ADR의 50% 이상 이동하면 결국 다른 두 범위 중 하나와 정렬됩니다.
2. 그린 레인지 - 오늘 저점에서 계산하면 평균적으로 가격이 얼마나 움직일까요?
3. 빨간색 범위 - 오늘 고점에서 계산하면 평균적으로 가격이 얼마나 움직일까요?