Gann Price Level
- インディケータ
-
Kirill Borovskii
 My name is Kyril Borovsky and I provide professional services to teach methods of W.D.Ganna and give expert advice on trading in the forex market, which allow clients to achieve the planned financial goals. I also offer software based on years of experience and knowledge of the methods of the
 - バージョン: 1.1
- アップデート済み: 15 3月 2024
- アクティベーション: 5
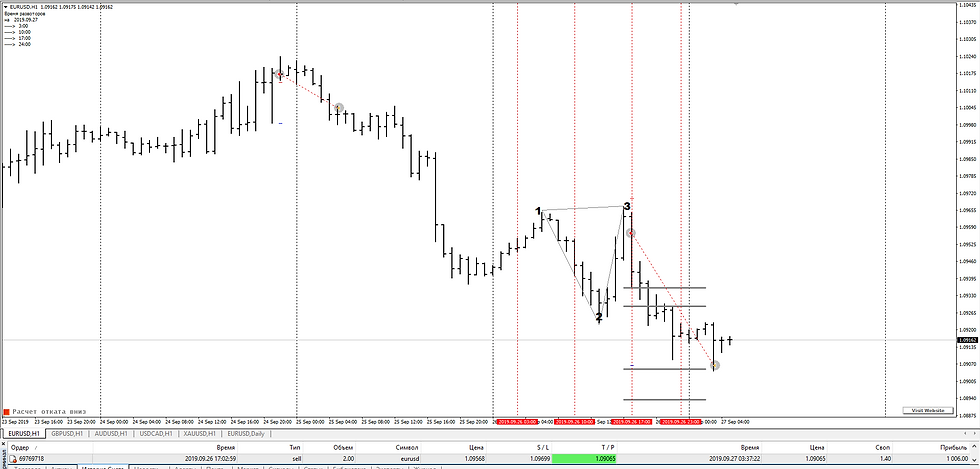
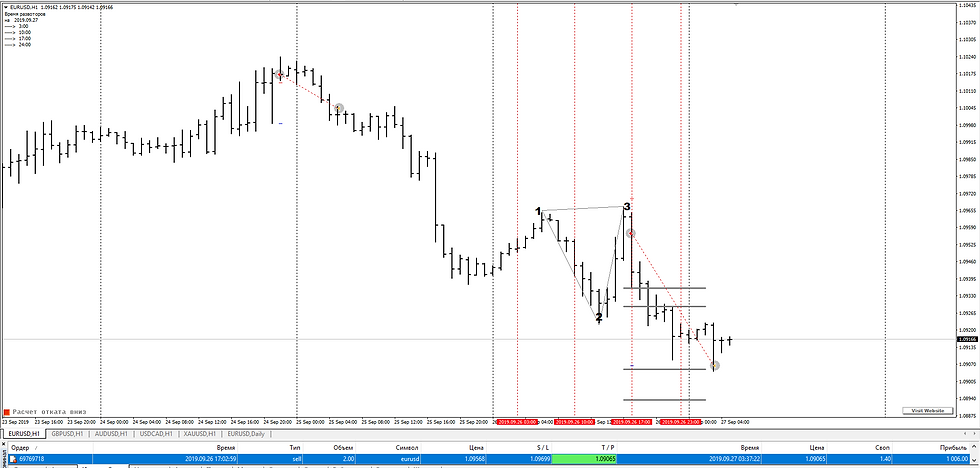
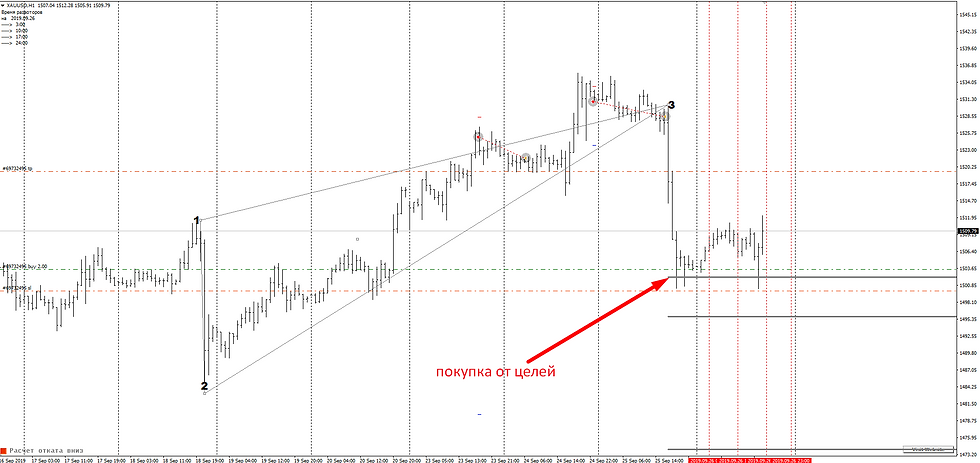
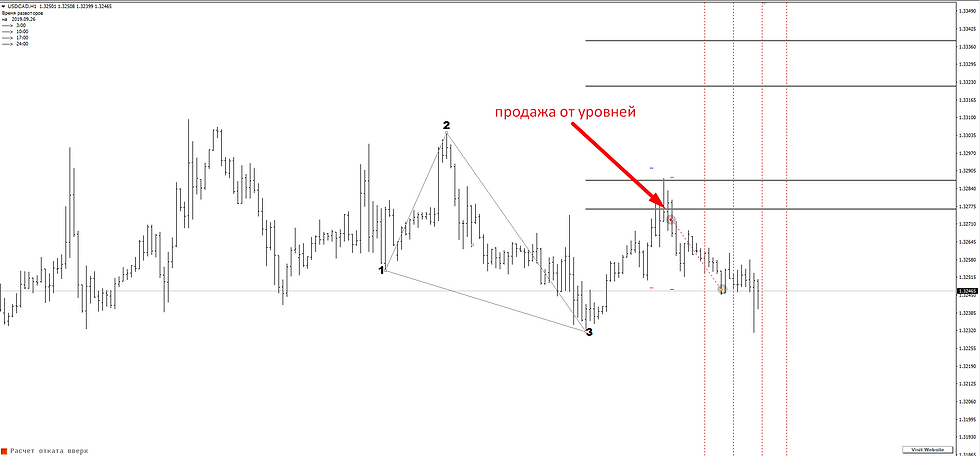
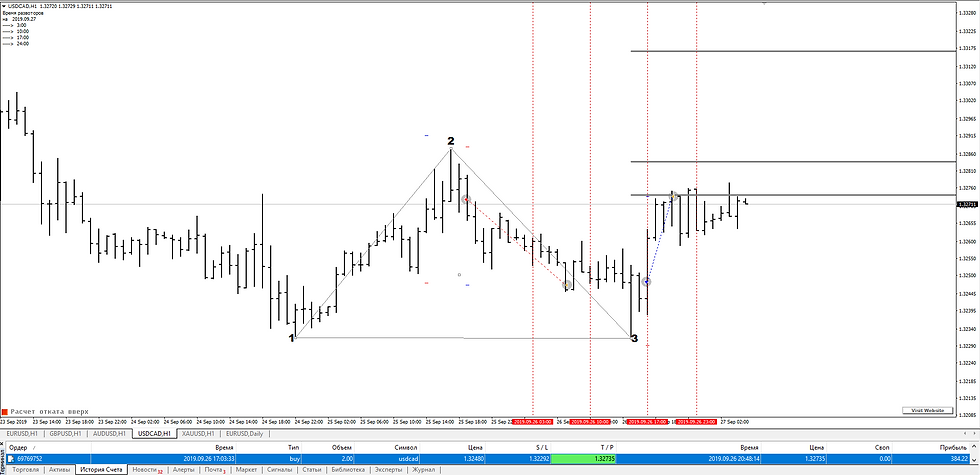
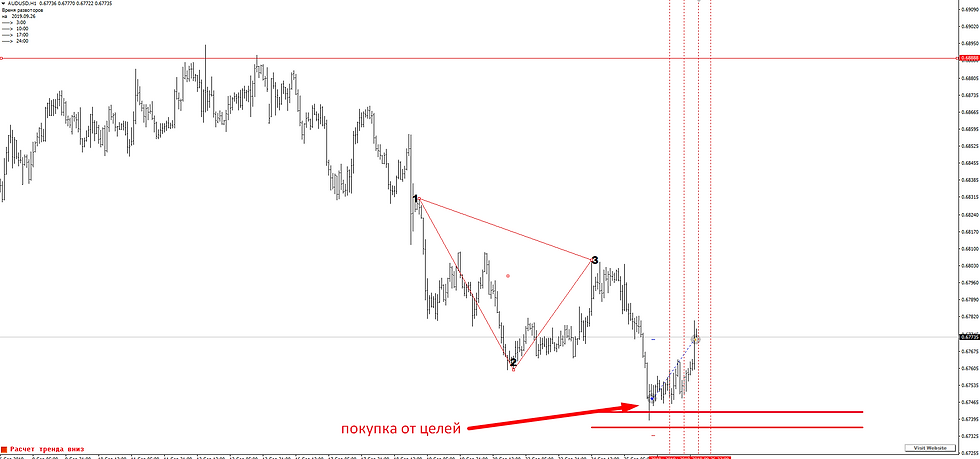
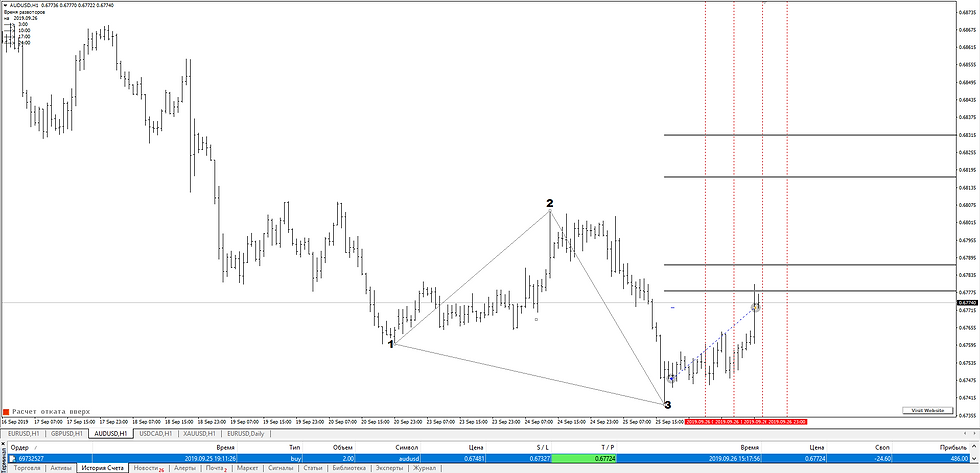
The indicator is designed to work on any trading platform. The program is based on proprietary algorithms and W.D.Ganna's mathematics, allowing you to calculate target levels of price movement based on three points with the highest degree of certainty. It is a great tool for stock trading. The indicator has three buttons: NEW - call up a triangle for calculation. DEL - delete the selected triangle. DELS - completely remove all constructions. The probability of achieving the goals is more than 80%. The indicator also has a signal in the form of an arrow to enter the market.
The indicator is intended for manual trading. To do this, click the NEW button. A triangle will appear. It needs to be placed at three points according to the Low-Hight-Low or Hight-Low-Hight model. Once you set the triangle, you immediately get target levels. Pressing the NEW button again will call up another triangle, which you can also place on the area of the chart that interests you. The number of triangles is not limited. The DEL button deletes the manually selected triangle you need. First, select the triangle by double-clicking on it and pressing DEL. Only this triangle will be deleted. The DELS button will delete all triangles ever constructed. Switching the timeframe does not affect the construction in any way.