Wick Fill Trend Screener
- インディケータ
- バージョン: 1.0
- アクティベーション: 5

トレーディングにおけるウィックとは何ですか?このスクリーナーはどのように機能するのですか? ローソク足におけるウィックは、価格の拒否反応を反映しています。このスクリーナーは埋められる大きな可能性を持つウィックを識別しようとしています。このスクリーナーは、トレンド市場で発生するウィックに焦点を合わせています。
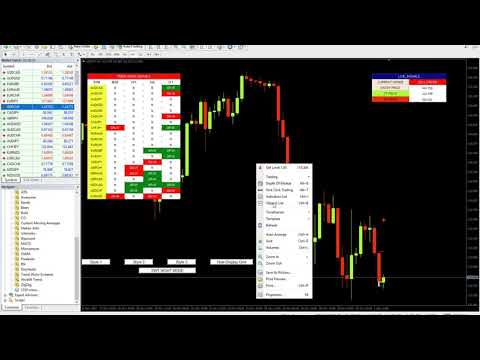
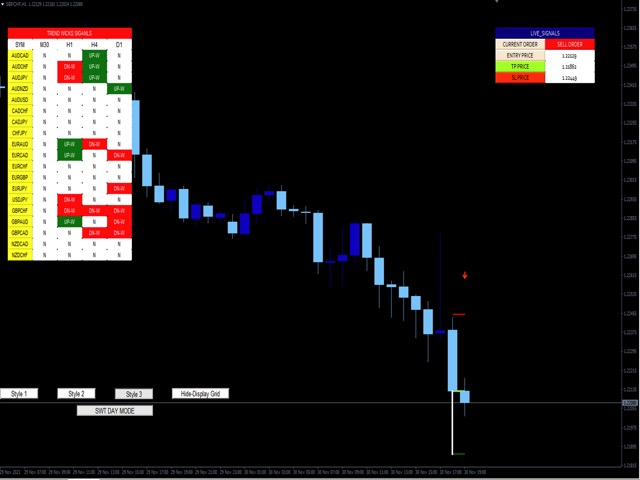
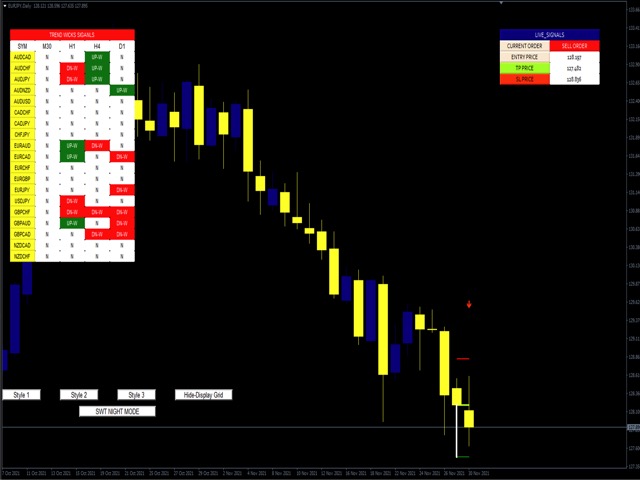
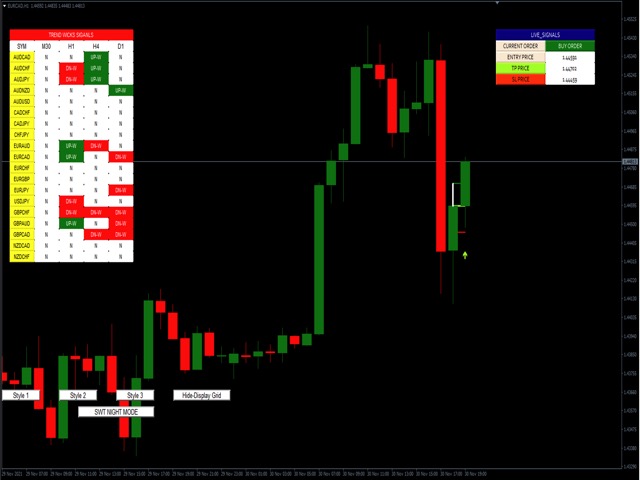
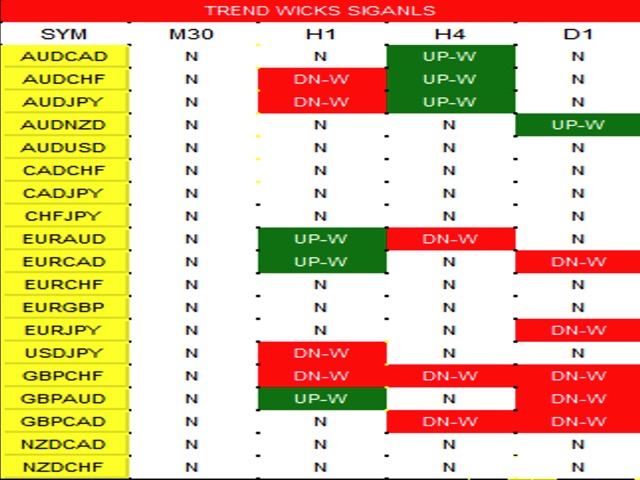
このスクリーナーは、ライブで取引されている潜在的なウィックの全体像を提供するダッシュボードを表示します。それは、時間枠によって整理されたすべてのペア/インスツルメンツを示しています。買いのチャンスは「UP-W」と名付けられます。彼らはダッシュボード上で緑色に表示され、売りの機会は、''DN-W''と名付けられ、赤で表示されます。トレーダーは画面に表示されたダッシュボード上で希望のウィック機会をクリックする必要があり、スクリーナーはその特定のトレードを表示します。スクリーナーは、トレーダーが選択したインプットに基づき、機会を表示します。金やUS30などの商品は、通常、ブローカーによって契約サイズが異なることに注意してください。同じコントラクトサイズのペアまたは商品を使用するようにしてください。そうでない場合、いずれかの契約サイズのペア/商品はシグナルを表示しません。
-入力
トレンドウィック。この入力は、インディケータがスキャンしなければならないウィックサイズを決定します。単位は%です。デフォルトでは20%です。
-信号の数。成功率シミュレータでスキャンする信号の数を指定します。
-Moving average:移動平均。このフィルターは、移動平均とRSIを組み合わせたものです。RSIと移動平均はユーザーが自由に設定することができます。
-前のバーの方向。この機能は、直前のローソク足に基づいてシグナルを回避または許可します。この機能が有効な場合、直前のローソク足がトレンドと同じ方向にある場合のみ、ウィックをシグナルとして考慮します。偽の場合は、すべてのウィックを考慮します。
-直近の高値・安値:レンジ相場を回避するために、直近の高値・安値をスキャンする機能です。
-最小ローソク足サイズ。最小ローソク足の大きさ: スキャンの対象となる最小ローソク足の大きさを指定します。
-最大ローソク足サイズ。最大ローソク足の大きさ:この入力は、インディケータがウィックをスキャンすることを考慮する最大のバーサイズです。
-ストップロスの比率。デフォルトでは、ストップロスはシグナルローソク足のHHまたはLLとなります。この機能により、ユーザーはウィックシグナルに基づいてストップロスを大きく、または小さく設定することができます。例えば、ユーザーが2を選択した場合、ローソク足のWickに基づき2倍のストップロスになります。
-ペアリスト この設定は、スクリーナーにどのペア/インストルメントを表示させるかを選択します。以下の形式に従ってください。eurusd, audcad, gbpnzd
*お使いのブローカーリストがそれらを使用している場合、接頭辞または接尾辞を使用することができます。
-アラート設定。本インジケーターには、携帯端末に送信できるアラートがあり、アラートとプッシュ通知を有効にすることができます。まず、手からアプリに信号を受信するために、ユーザーはMetaTraderアプリからSetting>Chat and message>からMetaquotes IDを取得する必要があります。次に、デスクトップ版のTools>Options>Notificationsで、Metaquotes IDを挿入してください。 そうすると、ライブシグナルの通知が届きます。
ストラテジーのテストや1つのシンボルを使用する場合は、Wick Fill Trendを試してみてください。
https://www.mql5.com/en/market/product/71085
スタイルが重要だから
私はそれがろうそくの色、明るいまたは暗いへの背景を変更し、グリッドを入れたり削除するために毎回プロパティをクリックすることがいかに迷惑であるかを知っています。ここでは、私の製品の大部分に含まれているワンクリックで解決策です。
3つのカスタマイズ可能なボタンは、トレーダーが望むキャンドルのスタイルを選択することができます。 昼と夜のモードを切り替えるには、1つのボタン。 チャート上のグリッドを表示または非表示にするには、1つのボタン。 *****設定上、あなたはボタンが画面上に表示されるべき場所を選択することができます*****。
私の他の製品をチェックすることを検討してください https://www.mql5.com/en/users/javimorales.fer/seller
著者
ハビエル・モラレス、Algorithms for Tradingの創設者。