Wick Fill Trend Screener
- 지표
- 버전: 1.0
- 활성화: 5

상거래에서 심지 란 무엇입니까? 이 스크리너는 어떻게 작동합니까? 양초의 심지는 가격에 대한 거부를 나타냅니다. 이 스크리너는 채워질 가능성이 큰 심지를 식별하려고 시도합니다. 이 스크리너는 트렌드 시장에서 발생하는 심지에 초점을 맞춥니다.
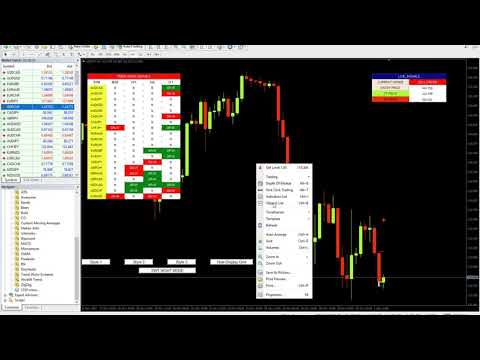
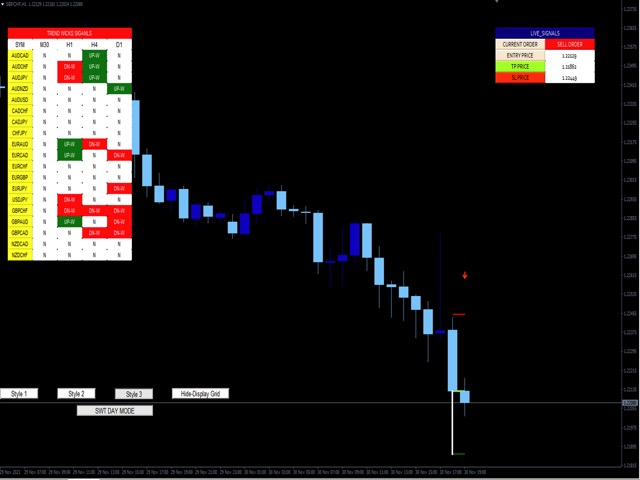
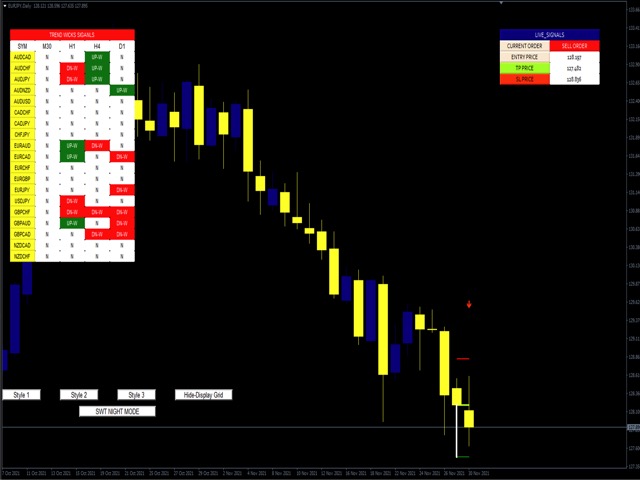
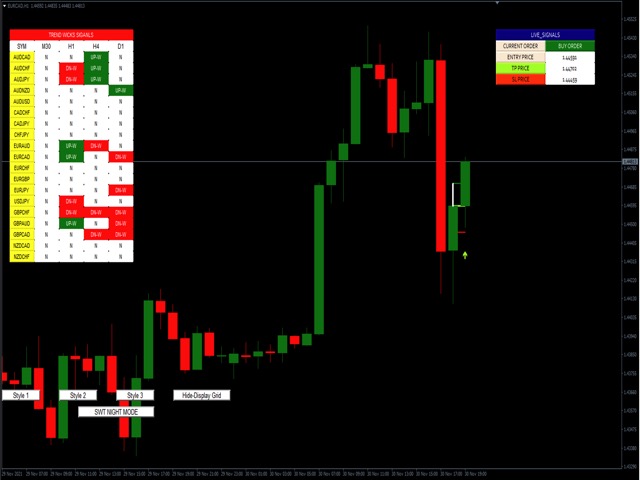
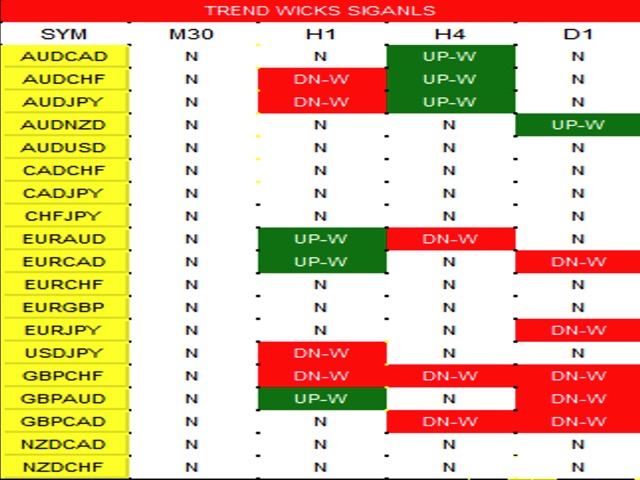
스크리너는 실시간으로 거래되는 잠재적 심지의 전체 보기를 제공하는 대시보드를 표시합니다. 시간 프레임별로 정렬된 모든 쌍/악기를 표시합니다. 구매 기회는 "UP-W"로 표시됩니다. 지정. 대시보드에 녹색으로 표시되고 기회의 이름이 "DN-W"이고 빨간색으로 표시됩니다. 거래자는 화면에 표시되는 대시보드에서 원하는 윅 기회를 클릭해야 하며 스크리너는 해당 특정 거래를 표시합니다. 스크리너는 거래자가 선택한 입력을 기반으로 기회를 표시합니다. 금 또는 US30과 같은 상품은 일반적으로 브로커에 따라 계약 크기가 다릅니다. 동일한 계약 크기의 쌍 또는 악기를 사용하십시오. 그렇지 않으면 계약 크기 쌍/도구 중 하나가 신호를 표시하지 않습니다.
-입력
추세 심지: 이 입력은 표시기가 스캔해야 하는 심지 크기를 결정합니다. %로 측정됩니다. 기본적으로 20%입니다.
-Number of Signals: 성공률 시뮬레이터를 위해 스캔할 신호의 수입니다.
-이동 평균: 이 필터는 이동 평균 지표와 RSI의 조합입니다. 사용자는 자신의 필요에 따라 RSI와 이동 평균을 설정할 수 있습니다.
- 이전 막대 방향: 이 기능은 이전 촛불을 기반으로 신호를 피하거나 허용합니다. true인 경우 표시기는 이전 캔들이 추세의 동일한 방향으로 갈 때만 심지를 신호로 간주합니다. 잘못된 경우 모든 심지가 고려됩니다.
최근 고점, 저점 막대: 이 기능을 사용하면 거래자는 마지막 "x" 막대에서 마지막 고점과 저점을 찾아 범위 기간을 피할 수 있습니다.
-최소 양초 크기: 이 입력은 심지를 스캔할 때 표시기가 고려할 최소 막대 크기입니다.
-최대 양초 크기: 이 입력은 심지를 검색할 때 표시기가 고려할 최대 막대 크기입니다.
손절매 비율: 기본적으로 양초의 HH 또는 LL의 손절매는 신호 양초와 같습니다. 이 기능을 사용하면 심지 신호를 기반으로 더 크거나 더 작은 정지 손실을 설정할 수 있습니다. 예를 들어 사용자가 2를 선택하면 양초의 심지를 기준으로 손절매가 2배가 됩니다.
- 쌍 목록: 이 설정은 스크리너에 표시되어야 하는 쌍/악기를 결정합니다. 다음 형식에 유의하십시오. EURUSD, AUDCAD, GBPNZD
*중개업체 목록에서 사용하는 경우 접두사 또는 접미사를 사용할 수 있습니다.
알람 설정: 이 표시기는 모바일 장치로 보낼 수 있는 알람을 가지고 있으며 알람 및 푸시 알림을 활성화합니다. 손에서 앱으로 신호를 받으려면 사용자가 먼저 MetaTrader 앱의 설정>채팅 및 메시지>에서 Metaquotes ID를 가져와야 합니다. 그런 다음 데스크톱 버전에서 도구>옵션>알림 ------으로 이동하여 메타따옴표 ID를 입력합니다. 그러면 실시간 신호 알림을 받게 됩니다.
전략을 테스트하거나 여기에서 기호를 사용하려면 Wick Fill Trend를 시도하십시오.
https://www.mql5.com/en/market/product/71085
스타일이 중요하기 때문에
매번 속성을 클릭하여 초의 색상을 변경하고 배경을 밝거나 어둡게 만들고 격자를 삽입하거나 제거하는 것이 얼마나 성가신 일인지 압니다. 다음은 대부분의 제품에 구축한 원클릭 솔루션입니다.
내 다른 제품도 확인하십시오 https://www.mql5.com/en/users/javimorales.fer/seller
작가
트레이딩 알고리즘의 창시자 Javier Morales.
스크리너는 실시간으로 거래되는 잠재적 심지의 전체 보기를 제공하는 대시보드를 표시합니다. 시간 프레임별로 정렬된 모든 쌍/악기를 표시합니다. 구매 기회는 "UP-W"로 표시됩니다. 지정. 대시보드에 녹색으로 표시되고 기회의 이름이 "DN-W"이고 빨간색으로 표시됩니다. 거래자는 화면에 표시되는 대시보드에서 원하는 윅 기회를 클릭해야 하며 스크리너는 해당 특정 거래를 표시합니다. 스크리너는 거래자가 선택한 입력을 기반으로 기회를 표시합니다. 금 또는 US30과 같은 상품은 일반적으로 브로커에 따라 계약 크기가 다릅니다. 동일한 계약 크기의 쌍 또는 악기를 사용하십시오. 그렇지 않으면 계약 크기 쌍/도구 중 하나가 신호를 표시하지 않습니다.
-입력
추세 심지: 이 입력은 표시기가 스캔해야 하는 심지 크기를 결정합니다. %로 측정됩니다. 기본적으로 20%입니다.
-Number of Signals: 성공률 시뮬레이터를 위해 스캔할 신호의 수입니다.
-이동 평균: 이 필터는 이동 평균 지표와 RSI의 조합입니다. 사용자는 자신의 필요에 따라 RSI와 이동 평균을 설정할 수 있습니다.
- 이전 막대 방향: 이 기능은 이전 촛불을 기반으로 신호를 피하거나 허용합니다. true인 경우 표시기는 이전 캔들이 추세의 동일한 방향으로 갈 때만 심지를 신호로 간주합니다. 잘못된 경우 모든 심지가 고려됩니다.
최근 고점, 저점 막대: 이 기능을 사용하면 거래자는 마지막 "x" 막대에서 마지막 고점과 저점을 찾아 범위 기간을 피할 수 있습니다.
-최소 양초 크기: 이 입력은 심지를 스캔할 때 표시기가 고려할 최소 막대 크기입니다.
-최대 양초 크기: 이 입력은 심지를 검색할 때 표시기가 고려할 최대 막대 크기입니다.
손절매 비율: 기본적으로 양초의 HH 또는 LL의 손절매는 신호 양초와 같습니다. 이 기능을 사용하면 심지 신호를 기반으로 더 크거나 더 작은 정지 손실을 설정할 수 있습니다. 예를 들어 사용자가 2를 선택하면 양초의 심지를 기준으로 손절매가 2배가 됩니다.
- 쌍 목록: 이 설정은 스크리너에 표시되어야 하는 쌍/악기를 결정합니다. 다음 형식에 유의하십시오. EURUSD, AUDCAD, GBPNZD
*중개업체 목록에서 사용하는 경우 접두사 또는 접미사를 사용할 수 있습니다.
알람 설정: 이 표시기는 모바일 장치로 보낼 수 있는 알람을 가지고 있으며 알람 및 푸시 알림을 활성화합니다. 손에서 앱으로 신호를 받으려면 사용자가 먼저 MetaTrader 앱의 설정>채팅 및 메시지>에서 Metaquotes ID를 가져와야 합니다. 그런 다음 데스크톱 버전에서 도구>옵션>알림 ------으로 이동하여 메타따옴표 ID를 입력합니다. 그러면 실시간 신호 알림을 받게 됩니다.
전략을 테스트하거나 여기에서 기호를 사용하려면 Wick Fill Trend를 시도하십시오.
https://www.mql5.com/en/market/product/71085
스타일이 중요하기 때문에
매번 속성을 클릭하여 초의 색상을 변경하고 배경을 밝거나 어둡게 만들고 격자를 삽입하거나 제거하는 것이 얼마나 성가신 일인지 압니다. 다음은 대부분의 제품에 구축한 원클릭 솔루션입니다.
- 원하는 양초 스타일의 상인 선택을 위한 3개의 사용자 지정 가능한 버튼.
- 낮과 밤 모드 사이를 전환하는 버튼입니다.
- 차트에서 그리드를 표시하거나 숨기는 버튼입니다.
내 다른 제품도 확인하십시오 https://www.mql5.com/en/users/javimorales.fer/seller
작가
트레이딩 알고리즘의 창시자 Javier Morales.