Suspects

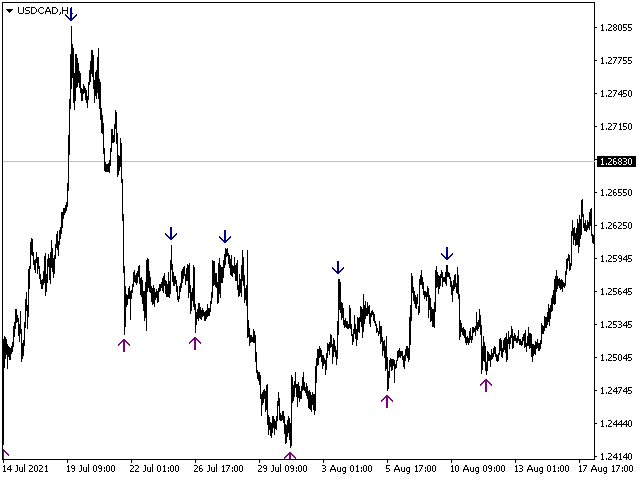
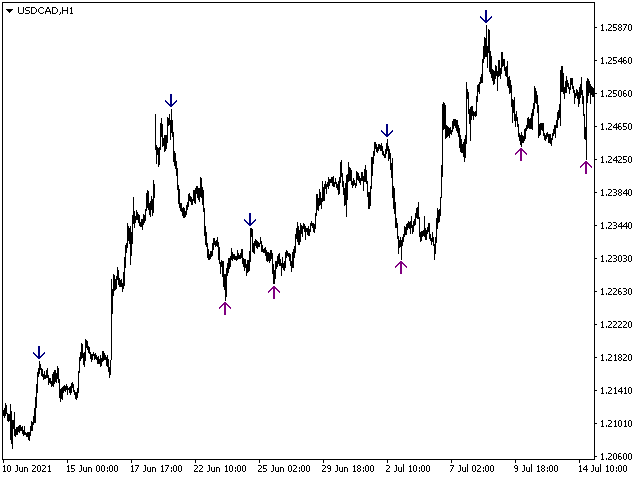
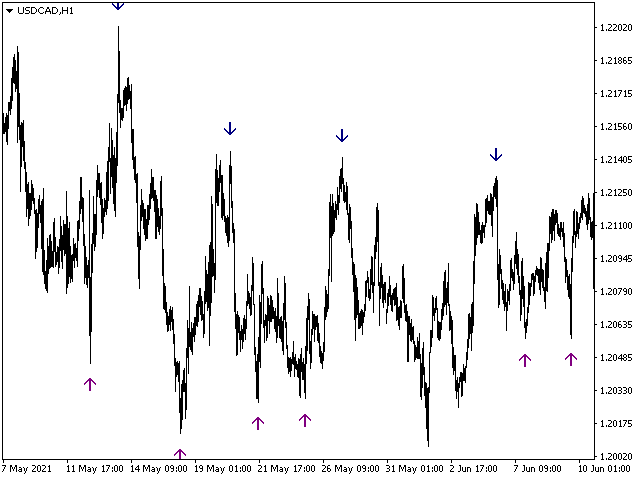
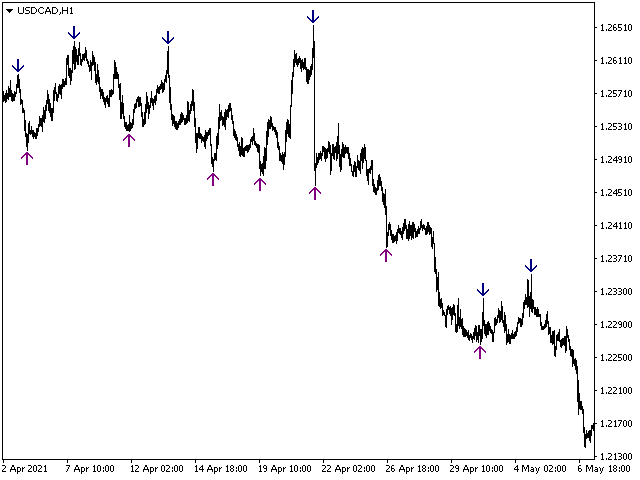
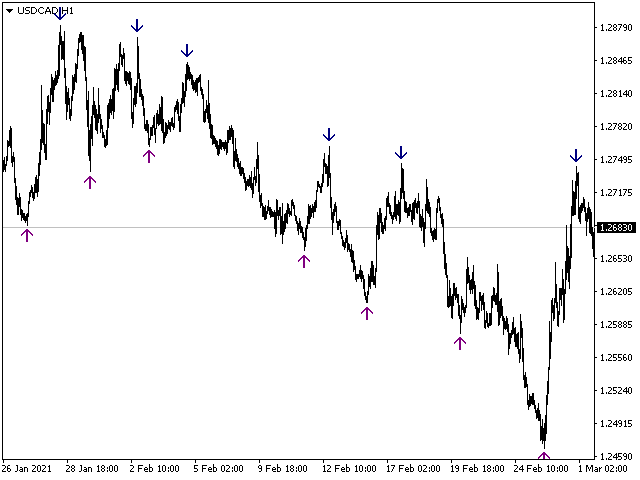
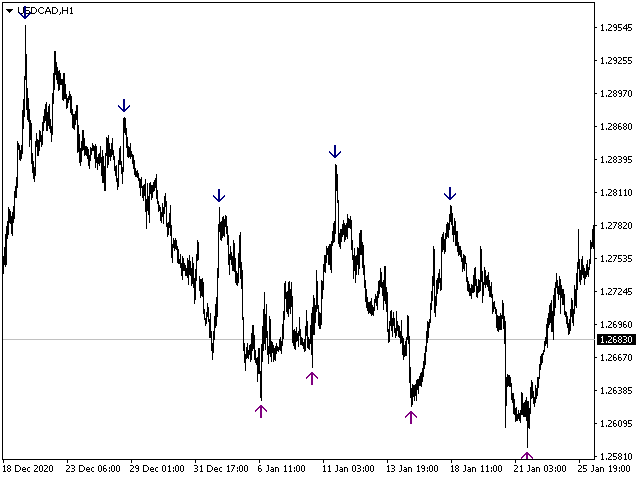
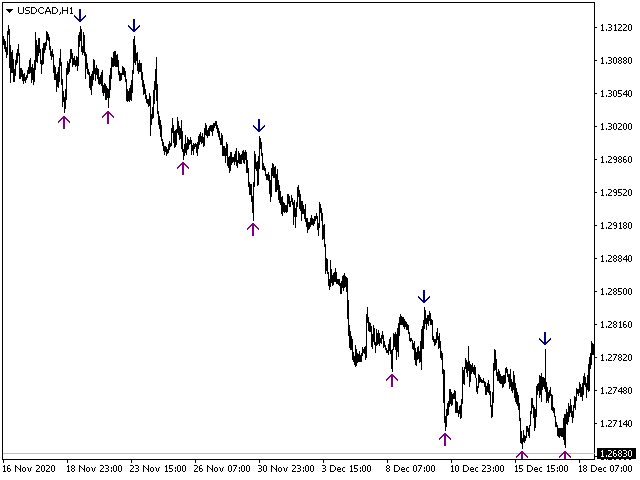
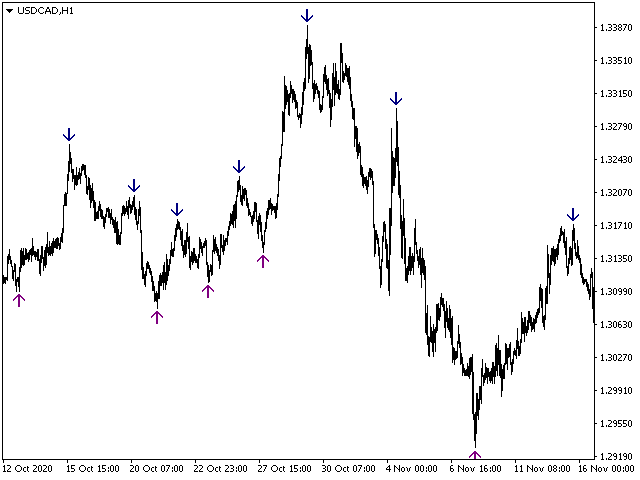
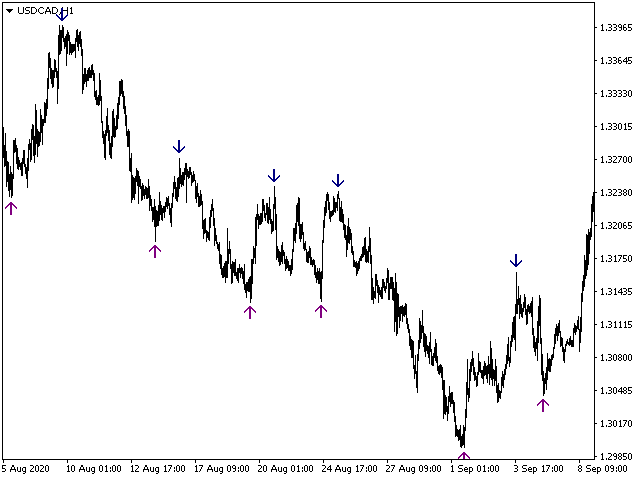
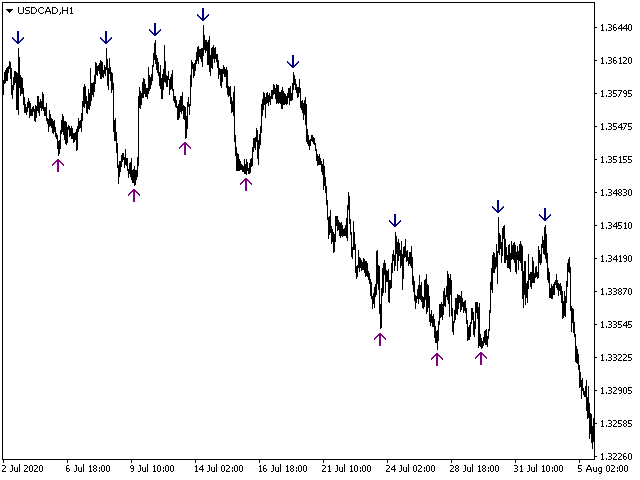
If you are not sure how to determine the trend reversal point and are concerned about how to draw trend lines then the Suspects indicator is for you. The Suspects indicator is plotted in the same window as the price chart. With the help of the Sherlock indicator algorithm indicator, you can quickly understand what kind of trend is currently developing in the market. It can be used along with oscillators as a filter.

Many newcomers who first enter the market are often more fortunate than a professional who has spent years learning. The reason for this phenomenon is the unconscious falling of newcomers into the trend, when, even without any indicators, it becomes clear where the market is heading. But the Suspects indicator will give you stability if you stick to its signals. And you will be able to distinguish between work and emotional component.

Trading with the Forex Suspects indicator is as simple as possible, if a red arrow pointing up appears on the chart - a buy deal is opened. In the same case, if you see a blue arrow pointing in the downward direction - we open a sell order, positions are closed in the opposite way, that is, as soon as a signal is received to open an order in the direction opposite to your position. For example, you opened a long position (for sale), you close it when an arrow appears pointing down.
    おすすめのプロダクト
    Indicator Description: The Advanced Force Index combines volume and price to determine the strength  of the trend. It has been developed to provide an accurate measurement of  seller and buyer power in the market, with multiple smoothing and display options. Key Features: Two display modes: Colored Histogram (bicolor) or Solid Line 4 Moving Average methods: SMA, EMA, SMMA, LWMA 7 Price types: Close, Open, High, Low, Median, Typical, Weighted Both volume types supported: Tick Volum
    FREE
    v. 1.0 This indicator can show with maximum accuracy up to 1 bar the presence of a Maximum/minimum on the chart, regardless of the timeframe. It has a flexible configuration. You can use either one value on all TF, or you can use your own value on each TF individually. This indicator is already being improved and those who purchase it receive all updates for free. Next, it is planned to display an indication of the strength of the pivot point at each extremum (in % or in color drawing). It wi
    The Pulse は、蓄積期間をリアルタイムで示す指標である。 簡単に言えば、蓄積とは、「スマートマネー」が市場で強力な動きを起こす前に静かに資産を集めることです。 チャート上では、価格が1つの範囲で「立ち往生」しているように見えます。 これは蓄積段階です-誰かが大きな動きの準備をしています。 そして、市場が"凍結"しているように見えるが、同時に緊張が感じられるときに、これらの瞬間に気づくことを学ぶなら、適切なタイミングで適切な場 さらに、 The Pulse  インジケータは、各蓄積に対して計算を実行し、蓄積期間後の可能な価格ポテンシャルの方向を決定することができる。 The Pulse インジケータの助けを借りて、市場構造をよりよく見て理解することができます。 The Pulse Blog. The blog: Why every trader should have The Pulse indicator as an additional tool for trading. Version mt5 蓄積期間を決定することは、適切な瞬間を待つことができることを意味します。
    El indicador "MR BEAST ALERTAS DE LIQUIDEZ" es una herramienta avanzada diseñada para proporcionar señales y alertas sobre la liquidez del mercado basándose en una serie de indicadores técnicos y análisis de tendencias. Ideal para traders que buscan oportunidades de trading en función de la dinámica de precios y los niveles de volatilidad, este indicador ofrece una visualización clara y detallada en la ventana del gráfico de MetaTrader. Características Principales: Canal ATR Adaptativo: Calcula
    Manual Zone Lines Pro は、 MT4チャート上に手動の価格ゾーンと右方向に伸びるラインを作 成し、 マルチタイムフレーム表示やアラート機能まで使えるチャート補助 ツールです。 通常の水平線は左右に無限に伸びますが、 このツールのラインは作成した位置から右方向だけに伸びます。 そのため、「どこから引いたラインなのか」が分かりやすく、 チャートをすっきり整理できます。 ゾーンもボタンひとつで作成でき、 作成したゾーンやラインは最新ローソク付近まで自動で延長されま す。 手動で右端を何度も調整する必要がありません。 Pro版では、ゾーンとラインをそれぞれ2つまで作成でき、 さらにマルチタイムフレーム表示にも対応しています。 たとえば、M1で作成したゾーンやラインを、 M5など別の時間足でも表示できるため、 複数時間足を見ながら重要価格帯を管理したいトレーダーに向いて います。 また、ゾーンやラインに対するタッチアラート・ ブレイクアラートにも対応しています。 価格が手動で設定したゾーンやラインに触れた時、 または終値でブレイクした時に通知を受け取ることができます。 アラー
    "The trend is your friend" is one of the best known sayings in investing, because capturing large trendy price movements can be extremely profitable. However, trading with the trend is often easier said than done, because many indicators are based on price reversals not trends. These aren't very effective at identifying trendy periods, or predicting whether trends will continue. We developed the Trendiness Index to help address this problem by indicating the strength and direction of price trend
    Skalpex is a system indicator for wave diagnostic analysis of the early phases of a market condition. The indicator lags exactly 1 bar. It shows the exact price reversals, does not redraw its values, but is 1 bar late. This is due to the fact that the last (zero bar) has not yet been formed before closing, which means that no one ever knows where it will go exactly and where it will close. We can assume. In order not to try to play fortune-telling, the Skalpex indicator is late by one candle an
    Rapid Trend is a technical analysis indicator that determines the direction and strength of a trend, and also signals a trend change. Allows you to determine the current trend. With the help of its algorithm, you can quickly understand what kind of trend is currently developing in the market. Rapid Trend can be used along with oscillators as filters. Setting up the Rapid Trend forex indicator allows you to receive more accurate signals for opening positions. Uses only one parameter for settings.
    Price reach indicator. It also serves as the perfect term for supports and resistance. I use it in two experts. The basic tool for professional trading. The indicator analyzes the last 500 bar and uses this to determine the levels ( but it doesn't predict the future ) . Personally, I use it on TF H1.  It is very simple. Four lines on chart and that's all. Only two input parameters.  Thousands of indicators. Why this? Is good ? No! Is very good. Please test the indicator prior to purchasing.
    需給ゾーン:過去に価格が何度も近づいた観察可能なエリア。 多機能ユーティリティ:  66+ の機能を含むこのインジケーター  |   質問があれば私に連絡   |  MT5 バージョン このインジケーターは、価格が再び反転する可能性のある場所を示します。 通常、価格がそのレベルで拒否された回数が多いほど、そのレベルは重要です。 入力設定で   調整できます: 弱いゾーン を有効または無効にします; ゾーンの説明 を表示または非表示にします; フォントサイズ; 基本色 を設定:サポートとレジスタンスに別々に: 選択した色は弱いゾーンでは薄くなり、チャートの視覚的分析に役立ちます; 需給ゾーン は、価格チャート上で過去に大きな買い(需要)または売り(供給)が発生した重要な領域です。これらのゾーンは、価格変動の 潜在的な反転または継続 を予測するのに役立ちます。需給トレードは、トレンドライン、移動平均線、オーダーフロー分析などの 他のツールと組み合わせる と最も効果的です。 需給ゾーンの特定方法: 需要ゾーン(買い圧力) 形成 :下落後の強い上昇動向。 マーキング方法 : 価格の急騰(ベー
    Hull Max MTF Indicator — Advanced Multi-Timeframe Market Analyzer Overview The Hull Max MTF Indicator is a professional-grade technical analysis tool built for serious traders who perform multi-timeframe (top-down) market analysis . It combines the speed and precision of the Hull Moving Average (HMA) with advanced forecasting, projection zones, and adaptive visual styles — helping traders clearly understand trend alignment across hourly, daily, weekly, monthly, and yearly structures in one ch
    Crypto_Forexインジケーター「 CCI FLAT Detector 」は、取引における効率的な補助ツールです!リペイント不要。 このMT4対応の優れたインジケーターで、あなたの取引手法をアップグレードしましょう。 - このインジケーターは、チャート上の価格がフラットな領域を表示します。「フラット感度」パラメータを搭載しており、フラットな領域を検知します。 - 「CCI FLAT Detector」は、プライスアクションエントリーの確認や、他のインジケーターと組み合わせて使用できます。 - トレンドフォローシステムでフラットゾーンを検出し、そこでの取引を回避するために使用できます。 - リバーサルスキャルピング(フラットな境界からの反転取引)にも使用できます。 - 標準的なCCIオシレーターの代わりに「CCI FLAT Detector」を使用する機会は数多くあります。 - Commodity_Channel_Index (CCI)は、現在の価格と過去の平均価格の差を測定します。 - +200以上のゾーンで売りエントリー、-200以下のゾーンで買いエントリーを行うのに最適で
    インディケータは現在のクオートを作成し、これを過去のものと比較して、これに基づいて価格変動予測を行います。インジケータには、目的の日付にすばやく移動するためのテキスト フィールドがあります。 オプション: シンボル - インジケーターが表示するシンボルの選択; SymbolPeriod - 指標がデータを取る期間の選択; IndicatorColor - インジケータの色; HorisontalShift - 指定されたバー数だけインディケータによって描画されたクオートのシフト; Inverse - true は引用符を逆にします。false - 元のビュー。 ChartVerticalShiftStep - チャートを垂直方向にシフトします (キーボードの上下矢印)。 次は日付を入力できるテキストフィールドの設定で、「Enter」を押すとすぐにジャンプできます。
    Trade with Gann on your side!! MASTER CIRCLE 360 CIRCLE CHART, originally created by Gann admitted that this is “The Mother of all charts”. It is one of the last studies that this great trader left for us. The numeric tab le is apparently quite simple like all the tables and is based on square numbers, the SQUARE OF 12 and is by evolution, one of the most important square numbers. Here we can find CYCLE, PRICE AND TIME thanks to angles and grades, to show past and future support and resistance.
    Alpha Trend signは私たちの取引システムを検証し、取引信号を明確に提示し、信号がドリフトすることはありません。 主な機能: •市場が活況を示している地域に応じて、指標に基づいて現在の相場がトレンド相場に属しているか、それとも揺れ相場に属しているかを直感的に判断することができる。 そして、指標の指示矢印に基づいて市場に切り込み、緑の矢印は購入を提示し、赤の矢印は販売を提示する。 •小周期変動による頻繁な取引信号の発生を回避するために、5分以上の時間周期で取引を行うことを推奨します。 •最適な取引タイミングを逃さないために、シグナルプロンプトをオンにすることもできます。 •本指標はトレンド相場をよく予測するだけでなく、幅広振動相場でも利益を得ることができる。 •本指標は大道至簡の原則に基づいており、異なる段階のトレーダーが使用するのに適している。 注意事項: •Alpha Trend signには明確な入退場信号があり、損失を与えないように逆位相操作を提案しない。 •Alpha Trend signは特に成熟した指標であり、デルのチー
    Switchman is a smart indicator without delays or redrawing that shows the trend of the selected timeframes. The most important task of a trader is to spot a trend and follow it on time. Uses an algorithm for calculating finding possible price reversals. It can be used as an additional or auxiliary tool for your trading strategy. The current timeframe the indicator is set to is used. Using arrows for this that show the direction of the pivot points. Can be used with an optimal risk to reward r
    相対力指数(RSI)マルチ通貨スキャナー MT4 は、複数の通貨ペアを同時に効果的に監視したいトレーダーのために設計された革新的な取引ツールです。強力な RSI インジケーターを活用することで、このスキャナーは市場状況の包括的な概要を提供し、トレーダーがさまざまな時間枠で潜在的な取引機会を特定するのを助けます。 このインジケーターは、重要なシグナルを使いやすい形式で提示することにより、重要な利点を提供します。トレーダーは自分の戦略に応じて設定をカスタマイズできるため、市場分析と意思決定プロセスを向上させたい初心者と経験豊富なトレーダーの両方にとって理想的なソリューションです。 MQL製品のインストールガイド | 購入したMQL製品のMT4/MT5の更新 | 一般的なトラブルシューティングガイド | インジケーター設定 / ガイド 主な機能 バッファ統合: インジケーターの値をアクセス可能なバッファとして公開し、Expert Advisorが自動取引のためにシグナルを読み取れるようにします。 視覚的矢印シグナル: Plots シグナルキャンドル上に直接チャートに明確なBUY/SELL矢印
    Prophet is a trend indicator. Shows the direction of turning points. Can be used with an optimal risk-to-profit ratio. The arrows indicate favorable moments and directions for entering the market. Uses one parameter for setting (adjust from 1 to 3). The probability of a successful trend is very high. In the course of work, the take-profit is much larger than the stop-loss! Works on all currency pairs and on all timeframes.
    Arbitrage Indicators is a professional and easy-to-use Forex trading indicator that uses the best trading principles of the latest AI arbitrage models. This indicator provides accurate buy and sell signals. Applies to currency pairs only. It has six different metrics options, MACD, KDJ, RSI, CCI, RVI, DEMARK. It can be freely switched by users, and intuitively shows the direction and reversal signal of the currency pair. When the two lines cross colors, the currency has a high probability of rev
    OSB オシレーター - 高度なカスタム インジケーター、効率的なプライス アクション補助ツールです。 - 高度な新しい計算方法が使用されます。 - 新世代のオシレーター - 使用方法を確認するには画像を参照してください。 - OSB オシレーターは、プライス アクション、ダイバージェンス、売られすぎ/買われすぎのシグナルの正確なエントリ ポイントを見つけるための補助ツールです。 - 売られすぎの値: 30 未満。 - 買われすぎの値: 70 以上。 - このインジケーターを使用すると、標準戦略をアップグレードする機会が十分にあります。 - 標準オシレーターよりもはるかに高速で正確です。 インジケーターの設定は非常に簡単です。パラメーターは 1 つだけです - 感度。 使用方法: - プライス アクション フィルターとして (画像を参照)。 - 主なトレンド方向のエントリ シグナルとして (画像を参照)。 - 正確なシグナルを持つダイバージェンス インジケーターとして (画像を参照)。 高品質のトレーディングロボットとインジケーターをご覧になるにはここをクリックしてください!
    A powerful indicator for precise market analysis, according to the Smart Money Concepts methodology. Determines key liquidity levels, supply and demand zones. Unusual coloring of candles, as well as levels. Smartmoney has repeatedly won first places in various competitions. Multi-timeframe is suitable for both forex pairs and metals and cryptocurrency.
    Matrix is a Forex arrow indicator. Displays signals simply and clearly! The arrows show the direction of the transaction, and are colored accordingly, which can be seen in the screenshots. As you can see, trading with such an indicator is easy. I waited for an arrow to appear in the desired direction - I opened a deal. An arrow formed in the opposite direction - closed the deal. The indicator also displays the lines with the help of which the arrow signals are formed, taking into account the int
    The BarsOldTimeFrame indicator is designed to analyze bar formation on a higher timeframe, projecting bars from it onto the current timeframe. The indicator draws higher timeframe bars on the current chart as rectangles with filled candlestick bodies and transparent shadows. The higher timeframe and fill colors for bullish and bearish bar bodies are selected in the settings.
    The Trends Signal indicator displays the direction of the trend with arrows, works in a simple and clear way. It uses a combination of reliable and simple indicators to analyze prices. The signals of the Trends Signal indicator can be interpreted as follows: buy when the bars are colored blue, and sell when they are red. An effective indicator with a wide range of three parameters for trading. Parameters: Length - The number of bars to calculate. LevelUP, LevelDN - Levels for determining overb
    King Grid
    Luis Mariano Vazquez Marcos
    King Gold Grid Presentamos con orgullo el revolucionario Asesor Experto de Sistema Grid, una obra maestra creada por  Mr Beast. Este excepcional producto se distingue como uno de los mejores en su categoría, destacando por su magnífica gestión de riesgos y especialización en el trabajo con el oro. Diseñado meticulosamente para optimizar la eficiencia y maximizar los beneficios, este asesor experto se erige como un líder indiscutible en el mundo de los sistemas de rejilla. Su capacidad para adapt
    サポート線と抵抗線のプロットにうんざりしていませんか? サポートレジスタンス は、非常に興味深いひねりを加えてチャート内のサポートとレジスタンスラインを自動検出およびプロットするマルチタイムフレームインジケーターです。価格レベルは時間とともにテストされ、その重要性が高まるにつれて、ラインは太くなり、暗くなります。 [ インストールガイド | 更新ガイド | トラブルシューティング | よくある質問 | すべての製品 ] 一晩でテクニカル分析を強化 チャートを閲覧せずに重要な価格レベルを検出 一目ですべての価格レベルの相対的な強さを認識する すべての取引で最大30時間のプロットラインを節約 インジケーターは、すべての価格レベルの年齢を表示します インジケーターは再描画されていません 過去および現在の価格レベルは近接によって崩壊し、現在の市場行動に合わせて調整されます。動作は、必ずしもピークではない場所に線が引かれます。 価格レベルは、時間とともに拒否されるにつれて、より暗く、より広くなります ノイズを避けるために、重要でない価格レベルは定期的にクリアされます カスタマイズ可能な時間枠の
    Distinctive is a forex trending arrow indicator for identifying potential entry points. I like it, first of all, because it has a simple mechanism of work, adaptation to all time periods and trading tactics. Created on the basis of a regression channel with filters. Plotting the Lawrence indicator signals on a price function chart using a mathematical approach. How it works - when the price breaks out in the overbought / oversold zone (channel levels), a buy or sell signal is generated. Everyt
    高度なカスタムCrypto_Forexインジケーター「アダプティブ・トレー​​ディング・オシレーター」 - MT4用の効率的な補助取引ツール! - このインジケーターは新世代のオシレーターです。使い方は画像をご覧ください。 - 「アダプティブ・トレー​​ディング・オシレーター」には、調整可能な売られ過ぎ/買われ過ぎゾーンがあります。 - このオシレーターは、動的な売られ過ぎ/買われ過ぎエリアからの決済時に、正確なエントリーポイントを見つけるための補助ツールです。 - 売られ過ぎゾーン:グリーンラインより下。 - 買われ過ぎゾーン:イエローラインより上。 - このインジケーターは、プライスアクションパターンやトレンド戦略と組み合わせるのに最適です。 - 標準的なオシレーターよりもはるかに正確です。 - インジケーターは任意の時間枠で使用できます。 - PCとモバイルの両方にアラート機能を搭載しています。 高品質のトレーディングロボットとインジケーターをご覧になるにはここをクリックしてください! これは、このMQL5ウェブサイトでのみ提供されるオリジナル製品です。
    Stepline MTF SNR
    Mohamad Faizul Bin Mohd Haris
    Stepline MTF SNR with Heiken Ashi Stepline MTF SNR is a sophisticated technical analysis tool for MetaTrader 4 that combines Multi-Timeframe (MTF) Support and Resistance levels with a built-in Heiken Ashi smoothing filter. This indicator is designed for traders who require a clear, bird's-eye view of market structure across multiple horizons without leaving their current chart.  Combines 4 timeframe SNR levels (SBR/RBS) with built-in Heiken Ashi filtering for cleaner, more accurate signals – e
    「Naturu(ナチュル)」は自然の対称性をアルゴリズムとして用いる手動インジケーターです。 シンプルな戦略と隠された知恵でマーケットを制覇しましょう! インジケーターを読み込むと、上側(Top)と下側(Bottom)の2本のラインが表示されます。 ラインを一度クリックするとアクティブ化され、移動させたいローソク足をクリックするだけでその位置に移動できます。 高値ポイントと安値ポイントを設定すると、インジケーターが自動的に以下を計算します: マゼンタのゾーン:ブル(買い勢)とベア(売り勢)の関心が最も接近する、サポート/レジスタンスになりやすいエリア グレーのゾーン:次に注目されるエリア アクア色のライン:ブルの価格目標 ゴールド色のライン:ベアの価格目標 手動インジケーターは完全なコントロールと柔軟性を提供し、リアルタイムの相場状況や個人の直感に応じてラインを調整できます。 価格の動きを自ら深く分析することで、サポートやレジスタンス、チャートパターンの形成を本質的に理解できます。 人間の判断を活かすことで、自動システムが誤認しがちなノイズを除去し、誤シグナルを減らします。 また、自
    このプロダクトを購入した人は以下も購入しています
    Neuro Poseidon is a new indicator by Daria Rezueva. It combines precise trading signals with adaptive TP/SL levels - creating best possible trades as a result! Message me and get  Neuro Poseidon Assistant  as a gift to automize your trading process! What makes it stand out? 1. Proven profitability on all assets and timeframes 2. Only confirmed BUY and SELL signals present on the chart 3. Adaptive TP & SL levels generated by the software for each trade 4. Easy to understand - suitable for all
    Super Signal – Skyblade Edition プロ仕様のノンリペイント / ノーラグ・トレンドシグナルシステム。卓越した勝率を実現 | MT4 / MT5 対応 1分足、5分足、15分足などの低い時間足で最も効果を発揮します。 主な特徴: Super Signal – Skyblade Edition は、トレンド取引に特化したスマートなシグナルシステムです。マルチレイヤーのフィルターロジックを用いて、明確な方向性と実際のモメンタムに支えられた強力なトレンドのみを検出します。 このシステムは 天井や底を予測するものではありません 。次の3つの条件がすべて満たされた場合にのみシグナルを発生させます: 明確なトレンド方向 モメンタムの増加 健全なボラティリティ構造 市場セッションに基づく流動性分析と組み合わせることで、シグナルの精度とタイミングがさらに向上します。 シグナルの特性: すべての矢印シグナルは 100% 非リペイント / 遅延なし 一度出現したシグナルは固定され、点滅・消失しません チャート上の矢印、情報パネル、ポップアップ通知、音声アラート、プッシュ通知
    Dynamic Forex28 Navigator - 次世代の Forex 取引ツール。 現在 49% オフ。 Dynamic Forex28 Navigator は、長年人気のインジケーターを進化させたもので、3 つの機能を 1 つにまとめています。 Advanced Currency Strength28 インジケーター (レビュー 695 件)  + Advanced Currency IMPULSE with ALERT (レビュー 520 件) + CS28 コンボ シグナル (ボーナス)。 インジケーターの詳細 https://www.mql5.com/en/blogs/post/758844 次世代の Strength インジケーターが提供するもの  オリジナルで気に入っていたすべての機能が、新機能と精度の向上によって強化されました。 主な機能: 独自の通貨強度計算式。 すべての時間枠でスムーズかつ正確な強度ライン。 トレンドの特定と正確なエントリーに最適です。 ダイナミックマーケットフィボナッチレベル (マーケットフィボナッチ)。 このインジケーターに固有
    Miraculous Indicator – ガン・スクエア・オブ・ナインに基づく100%非リペイントのFXおよびバイナリーツール この動画では、FXおよびバイナリーオプションのトレーダー向けに特別に開発された、非常に正確で強力な取引ツールである Miraculous Indicator を紹介しています。このインジケーターがユニークなのは、伝説的な ガン・スクエア・オブ・ナイン と ガンの振動の法則 に基づいている点で、現代の取引で利用できる最も正確な予測ツールの一つとなっています。 Miraculous Indicatorは 完全に非リペイント であり、ローソク足が確定した後にシグナルが変化したり消えたりすることはありません。つまり、見たものがそのまま利用できます。これにより、トレーダーは自信を持ってエントリーおよびエグジットを行うための信頼性と一貫性のある根拠を得ることができます。 主な特徴: ガン・スクエア・オブ・ナインとガン理論に基づいて構築 100%非リペイントのシグナルシステム すべての時間枠(M1、M5、H1、H4、日足、週足)で機能 FXおよびバイナリーオプション取引
    An extremely convenient indicator that truly makes the process of making money on the exchange easy. It is based on the scientifically rigorous theory of the market developed by the author, the beginning of which is presented here .                The full algorithm of this indicator operation is presented in the article .               The indicator calculates the most probable price movement trajectory and displays it on the chart. Based on the predicted price movement trajectory
    現在30%OFF! 初心者やエキスパートトレーダーのためのベストソリューション! このダッシュボードソフトウェアは、28の通貨ペアで動作しています。それは私達の主要な指標(高度な通貨の強さ28と高度な通貨インパルス)の2に基づいています。それは全体の外国為替市場の大きい概観を与えます。それは、すべての(9)時間枠で28の外国為替ペアのための高度な通貨の強さの値、通貨の動きの速度と信号を示しています。チャート上で1つのインディケータを使用して市場全体を観察し、トレンドやスキャルピングの機会をピンポイントで見つけることができたら、あなたのトレードがどのように改善されるか想像してみてください。 このインディケータには、強い通貨と弱い通貨の識別、潜在的な取引の識別と確認がより簡単になるような機能が搭載されています。このインディケータは、通貨の強さや弱さが増加しているか減少しているか、また、すべての時間枠でどのように機能しているかをグラフィカルに表示します。 新機能として、現在の市場環境の変化に適応するダイナミックなマーケットフィボナッチレベルが追加され、すでに当社のAdvanced
    RelicusRoad Pro: 定量的市場オペレーティングシステム 【期間限定】無制限アクセス 70% OFF - 2,000人超のトレーダーと共に なぜ多くのトレーダーは「完璧な」インジケーターを使っても失敗するのでしょうか? それは、文脈を無視して 単一の概念 だけでトレードしているからです。文脈のないシグナルは単なるギャンブルです。勝ち続けるには、 根拠の重なり(コンフルエンス) が必要です。 RelicusRoad Proは単なる矢印インジケーターではありません。完全な 定量的市場エコシステム です。独自のボラティリティモデリングを用いて、価格が推移する「適正価値の道(Fair Value Road)」をマッピングし、ノイズと真の構造的ブレイクを判別します。 推測はやめましょう。機関投資家レベルの「ロード・ロジック」でトレードを。 コアエンジン:「Road」アルゴリズム システムの中心となる Road Algo は、市場環境にリアルタイムで適応するダイナミックなボラティリティチャネルです。 安全ライン(平衡点) と、価格が数学的に反転しやすい 拡張レベル を投影します。 Si
    多くの矢印インジケーターは、シグナルだけを表示して、その後の判断はすべてトレーダー任せです。KT Alpha Hunter Arrows は、最初から完成されたトレードプランを提供します。 各シグナル矢印が表示されると、エントリーライン、ストップロス、4つのテイクプロフィット水準、そして現在の銘柄と時間足を今トレードする価値があるかを示すリアルタイムのエッジ判定が、チャート上にまとめて描画されます。付属の Trade Manager EA は、手動でエントリーした後の管理をサポートし、相場が荒れて感情が揺れやすい場面でも、トレードの規律を保ちやすくします。リペイントなし。確定足のみでシグナルを表示。Forex、ゴールド、指数、その他あなたが取引するあらゆる銘柄向けに設計されています。 主な機能 リペイントしない買い・売り矢印。シグナルは足が確定した後にのみ表示されます。 各シグナルにエントリーライン、構造的なストップロス、4つのテイクプロフィット水準を表示。 Edge Dashboard が、現在のチャート上で買いと売りのセットアップを個別に評価。 判定システム:No Edge、Ma
    このインジケーターは実践的なトレードに最適な自動波動分析のインジケーターです! 場合... 注:   Tang Lun (Tang Zhong Shuo Zen) の命名規則の影響で、私は波のグレーディングに西洋の名前を使用することに慣れていません。基本的な波を ペン 、二次波のバンドを セグメント と名付けました。同時に、 セグメント にはトレンドの方向が指定されます (この命名方法は将来のノートで使用されます。最初に言っておきます)。ただし、アルゴリズムは曲がりくねった理論とはほとんど関係がないため、付けるべきではありません。これは、私の市場分析 によって要約された、絶えず変化する複雑な運用ルール を反映しています。 バンドは標準化され、人によって異なることがないよう定義されており、市場参入を厳密に分析する上で重要な役割を果たす人為的な干渉の描画方法が排除されています。 このインジケーターを使用することは、取引インターフェイスの美しさを改善することと同等であり、元の K ライン取引を放棄し、取引の新しいレベルに連れて行きます。また、宣伝の観点から顧客の認識も向上します。 イ
    Trend Breakout Arrows Indicator The Trend Breakout Arrows Indicator is a momentum-based signal tool designed to identify potential bullish and bearish breakout opportunities. It displays clear arrow signals directly on the price chart, helping traders quickly recognize possible trend changes and continuation setups. Up Arrow (Buy Signal) A magenta up arrow appears below a candle when bullish momentum begins to strengthen. This signal indicates that buying pressure may be overtaking selling press
    「 Dynamic Scalper System 」インジケーターは、トレンド波の中でスキャルピング取引を行う手法のために設計されています。 主要通貨ペアと金でテスト済みで、他の取引商品との互換性があります。 トレンドに沿った短期的なポジションオープンのシグナルを提供し、追加の価格変動サポートも提供します。 インジケーターの原理 大きな矢印はトレンドの方向を決定します。 トレンド波の中では、小さな矢印の形でスキャルピングシグナルを生成するアルゴリズムが機能します。 赤い矢印は強気方向、青い矢印は弱気方向です。 トレンドの方向には敏感な価格変動ラインが描かれ、小さな矢印のシグナルと連動します。 シグナルは次のように機能します。適切なタイミングでラインが現れるとエントリーシグナルが形成され、ラインが開いている間はポジションが保持され、完了すると取引が終了します。 推奨される動作時間枠はM1~H4です。 矢印は現在のローソク足に形成され、次のローソク足が開いている場合は、前のローソク足の矢印は再描画されません。 入力パラメータ Trend Wave Period - トレンド方向
    Introduction to Fractal Pattern Scanner Fractal Indicator refers to the technical indicator that makes use of the fractal geometry found in the financial market. Fractal Pattern Scanner is the advanced Fractal Indicator that brings the latest trading technology after the extensive research and development work in the fractal geometry in the financial market. The most important feature in Fractal Pattern Scanner is the ability to measure the turning point probability as well as the trend probabi
    ```html Enigma Scalper Pro Overview Enigma Scalper Pro is a multi-filter breakout indicator designed to help traders identify high-probability trading opportunities by combining price action with multiple technical confirmations. The indicator uses a proprietary 3-Bar Breakout pattern together with optional Higher Timeframe, Bollinger Bands, RSI, and EMA filters to reduce low-quality signals and improve trade accuracy. How It Works The indicator waits for a valid breakout and confirms it using t
    Gannスクエアインジケーターは、W.D. Gannによって執筆された「市場予測のための数学的な式」の記事に基づく強力な市場分析ツールです。このツールは、解析に数学的な概念を応用し、Gann理論に基づいています。それは、144、90、52のスクエアや9のスクエアなど、Gannの関連テクニックの要素を取り入れています。さらに、の方法を組み込んでおり、9のスクエアとその関連性についてのチャネルやスターパターンに焦点を当てています。 ユーザーマニュアルと使用方法: このインジケーターを使用する前に、ユーザーマニュアルを読んで疑問点を解決するためにお問い合わせいただくことをお勧めします。ユーザーマニュアルの完全版は、当社のウェブサイトで入手できます。 MT5の完全版は購入できますし、MT4の無料版も試すことができます。両方のバージョンへのリンクを提供していますので、ご利用ください。 主な機能と機能: Gannスクエアインジケーターは、市場分析のための完全なツールセットを提供し、幾何学的な概念とGann理論に基づいて的確な判断を行う手助けをします。以下に主な機能を示します。 9のスクエアの分析:
    IQ FX Gann Levels a precision trading indicator based on W.D. Gann’s square root methods . It plots real-time, non-repainting support and resistance levels to help traders confidently spot intraday and scalping opportunities with high accuracy. William Delbert Gann (W.D. Gann) was an exceptional market analyst, whose trading technique was based on a complex blend of mathematics, geometry, astrology, and ancient mathematics which proved to be extremely accurate. Setup & Guide:  Download  MT5 Ver
    ゴールドラッシュ・トレンド・アロー・シグナル ゴールドラッシュ・トレンド・アロー・シグナル 指標は、XAU/USDにおける高速・短期スキャルパー向けに最適化された、正確でリアルタイムのトレンド分析を提供します。 1分足専用に設計されたこのツールは、明確なエントリーポイントを示す方向矢印を表示し、スキャルパーが変動の激しい市場状況でも自信を持って取引できるよう支援します。 この指標は、PRIMARY(主要)とSECONDARY(補助)のアラート矢印で構成されています。PRIMARYシグナルは、トレンドの方向転換を示す白と黒の方向矢印であり、SECONDARYシグナルは、PRIMARY矢印が示す方向を確認し、潜在的なエントリーポイントを示す青と赤の矢印です。 注意:トレンド方向の変化後にPRIMARYアラート矢印が1つだけ表示される場合、複数のSECONDARY青/赤矢印が表示される点に注意が必要です。SECONDARYシグナルは、シグナル基準を満たす任意のローソク足後に表示されます。したがって、長期的なトレンド移動の場合、画面に多くのSECONDARY矢印が表示されます(添付の
    この製品は 2026 年の市場向けに更新され、最新の MT5 ビルドに最適化されています。 価格更新のお知らせ: Smart Price Action Concepts は現在 $200 で提供されています。 次の 30 件の購入 後、価格は $299 に上がります。 特別オファー: 購入後、私にプライベートメッセージを送ることで、 無料ボーナス + ギフト を受け取ることができます。 まず、このトレーディングツールはリペイントなし、再描画なし、遅延なしのインジケーターであり、プロフェッショナルな取引に最適であることを強調しておきます。 Online course , and manual Smart Price Action Concepts Indicator は、初心者から経験豊富なトレーダーまで使える非常に強力なツールです。20 種類以上の便利なインジケーターを 1 つにまとめ、Inner Circle Trader Analysis や Smart Money Concepts Trading Strategies などの高度な取引アイデアを組み合わせています。このインジケ
    このインジケーターは、エリオット波動理論と組み合わせて作動し、2つの方法で使用されます: 自動モード: このモードでは、インジケーターがチャート上の全ての5つのモーティブ波を自動的に検出し、予測とポテンシャルな逆転ゾーンを提供します。また、アラートやプッシュメッセージを生成する能力も備えています。この自動機能により、エリオット波動パターンの識別と分析のプロセスが効率化されます。 手動モード: このオプションは、エリオット波動理論を手動で扱いたいトレーダー向けです。9つの段階を使用して波を描画することができます。各段階は、表示された後に描画されたラインを調整して個別に定義できます。この機能により、手動で波を描画するプロセスがより効率的になります。重要な点として、すべての描画データが将来の参照のためにプラットフォームのデータフォルダに保存されることに注意してください。 パラメータ: Name: インジケーターの名前。 Use_System_Visuals: インジケーターのテーマを有効または無効にして、取引プラットフォーム全体の外観に合わせます。 Explain_Comment: 波の番号
    チャートを構成し、周期的な価格変動を識別するテクニカル指標。 どのチャートでも動作します。 いくつかの種類の通知。 グラフ自体に追加の矢印があります。 履歴を再描画せずに、キャンドルのクローズに取り組みます。 M5以上のTFを推奨します。 パラメータの使用と設定が簡単です。 異なるパラメータを持つ 2 つのインジケーターを使用する場合、他のインジケーターなしで使用できます。 入力パラメータは2つあります 周期性と信号持続時間 これら 2 つのパラメータは、チャート構造の処理を扱います。 Cyclicity - 反転サイクルが変化する頻度を調整し、サイクルを滑らかにします。 Signal duration - 最小数では価格変動の衝動を検出し、最大数では長期的なトレンドの動きを検出します。
    Enigmera
    Ivan Stefanov
    5 (8)
    ENIGMERA: 市場の中心 重要:MQL5.comのデモはStrategy Testerで実行されており、Enigmeraの機能を完全には反映していない場合があります。詳細については、説明、スクリーンショット、ビデオをご確認ください。質問があれば、遠慮なくメッセージを送ってください! インジケーターのコードは完全に書き直されました。バージョン3.0は新機能を追加し、インジケーターの開始以来蓄積されたバグを修正しました。 紹介 このインジケーターとトレーディングシステムは、金融市場への注目すべきアプローチです。ENIGMERAはフラクタルサイクルを使用して、サポートとレジスタンスのレベルを正確に計算します。真の蓄積フェーズを示し、方向と目標を提供します。トレンドでも修正でも機能するシステムです。 動作方法 インジケーターのほとんどの機能は、チャートの左側にあるボタンで制御され、市場の状況に迅速に対応できるようになっています。 ボタン ON/OFF – インジケーター全体を表示または非表示にします。 Channel – サポートチャネルを有効にし、許容範囲の偏差を示します。 Dev
    NAM Order Blocks
    NAM TECH GROUP, CORP.
    3.67 (3)
    MT4マルチタイムフレームオーダーブロック検出インジケーター。 特徴 -チャートコントロールパネルで完全にカスタマイズ可能で、完全な相互作用を提供します。 -必要な場所でコントロールパネルを表示および非表示にします。 -複数の時間枠でOBを検出します。 -表示するOBの数量を選択します。 -さまざまなOBユーザーインターフェイス。 -OBのさまざまなフィルター。 -OB近接アラート。 -ADRの高線と低線。 -通知サービス(画面アラート|プッシュ通知)。 概要 注文ブロックは、金融機関や銀行からの注文収集を示す市場行動です。著名な金融機関と中央銀行が外国為替市場を牽引しています。したがって、トレーダーは市場で何をしているのかを知る必要があります。市場が注文ブロックを構築するとき、それは投資決定のほとんどが行われる範囲のように動きます。 注文の構築が完了すると、市場は上向きと下向きの両方に向かって急激に動きます。注文ブロック取引戦略の重要な用語は、機関投資家が行っていることを含むことです。それらは主要な価格ドライバーであるため、機関投資家の取引を含むあらゆる戦
    Sniper Delta Imbalance is a professional tool for deep delta analysis — the difference between buyer and seller volumes. It takes volume analysis to the next level, allowing traders to see in real time who controls the price — buyers or sellers — and to find precise entry points based on the actions of major market participants. This tool represents a unique style of analysis based on the ratio of demand and supply volumes and can be used to detect who holds control over price. At the core o
    Advanced Market Footprint Profiles is a specialized market analysis tool, representing a customized volume distribution profile enhanced with Delta and Bid/Ask profiles. The indicator builds fixed horizontal profiles (Fixed Range), displaying the distribution of Volume, Delta, and Bid/Ask at each price level with high precision. Unlike standard horizontal volume profiles, which only show overall volume distribution, this indicator combines Volume, Delta, and Bid/Ask within the selected range a
    MV Arrow– Professional Swing Signal Indicator comment for set files and user manual. MV Arrow v4.0 is a precision-based MT4 arrow indicator designed to identify high-probability swing BUY and SELL zones using a multi-filter confirmation system. It focuses on market extremes , filtering noise and low-quality signals to deliver clear, well-spaced trade opportunities . This indicator is ideal for traders who prefer clean charts, disciplined entries, and confirmation-based signals rather than co
    The "MR Volume Profile 4" indicator is a charting tool that displays trading volume at different price levels rather than time intervals. A key concept in volume profile is the point of control (POC)—the price level with the highest volume traded during the session or time range. While tools like VWAP or OBV provide volume trends, the "MR Volume Profile 4" indicator offers granular detail about where the most market activity occurs at specific price levels. This makes it a more precise tool for
    TRADING STRATEGY GUIDE DELIVERY The full Trading Strategy Guide will be sent directly to you after purchase. Just message me on MQL5 and ask for it — you'll receive it instantly, along with priority support and setup help. Powered Market Scanner for Smart Trading Decisions Keypad Support & Resistance is a next-generation MT4 trading system built for serious traders who demand precision, reliability, and clarity. It combines advanced smart filters with real-time price structure logic to genera
    The Propfolio Master Suite is the ultimate all-in-one analytical workstation for professional traders. Combining the power of the Beat The Market Maker (BTMM) methodology, Smart Money Concepts (SND/Liquidity), and Advanced Volume Profile, this suite replaces multiple different indicators with one optimized engine. Monitor up to 14 pairs simultaneously from a single chart, instantly identify market cycles, and seamlessly map institutional footprints with the click of a button. The Command Center
    Linear Trend Predictor ー - エントリ ポイントと方向サポート ラインを組み合わせたトレンド インジケーター。高値/安値チャネルを突破するという原理に基づいて機能します。 インジケーターのアルゴリズムは市場のノイズをフィルタリングし、ボラティリティと市場の動向を考慮します。 インジケーターの機能  平滑化手法を使用して、市場のトレンドと、買い注文または売り注文を開くためのエントリー ポイントを表示します。  任意の時間枠のチャートを分析して、短期および長期の市場の動きを判断するのに適しています。  あらゆる市場や時間枠に適応可能な入力パラメータにより、トレーダーはインジケーターを独自にカスタマイズできます。  設定されたインジケーター信号は消えず、再描画もされません。ローソク足の終値で決定されます。  いくつかの種類の通知が矢印と組み合わされています。  このインジケーターは、独立した取引システムとして使用することも、他の取引システムへの追加として使用することもできます。  あらゆるレベルの経験を持つトレーダーが使用できます。 主なパラメータ Vol
    GEM Signal Pro GEM Signal Pro は、MetaTrader 4 向けのトレンドフォロー型インジケーターです。より明確なシグナル、より整理されたトレードセットアップ、そして実用的なリスク管理をチャート上で確認したいトレーダーのために設計されています。 単純な矢印だけを表示するのではなく、GEM Signal Pro はトレード全体の考え方を、より見やすく分かりやすい形で表示します。条件が確認されると、インジケーターはエントリー価格、ストップロス、利確目標をチャート上に表示し、トレードセットアップをより効率的に確認できるようにします。 動作の仕組み このインジケーターは、まず内部ロジックに基づいて有効なシードシグナルを検出します。 確認条件が満たされると、GEM Signal Pro はチャート上に完全なセットアップを表示します。これにより、トレーダーはトレード構造をより明確に把握し、手作業による分析を減らすことができます。 チャート上のトレードレベル 確認済みシグナルに対して、GEM Signal Pro は以下を表示できます。 エントリー価格 ストップロス テ
    The indicator is built on a non-standard Zig Zag, it draws accumulations after which if the price leaves this zone and a test of this zone occurs, then a sound signal is given and an arrow appears - after the test candle closes.The indicator does not redraw its signals, it is very easy to use, there are only three settings 1- this is the zig zag parameter 2- this is the minimum price exit from the zone 3- this is the maximum price exit from the zone. The lower the parameter for Zig Zag, the more
    作者のその他のプロダクト
    The indicator calculates the saturation levels of the price chart. A signal to exit the resale area is a buy signal. A signal to exit the overbought area is a sell signal. Usually, you need to set relative values ​​for the overbought and oversold levels of Bottom and Top - for this indicator. Most often, a good trend is visible on the price chart visually. But an experienced trader must clearly understand the current balance of power in the market before entering. And the indicator will help t
    This indicator can track the steady price movement in a certain direction. In this case, the movement itself can be downward, upward or lateral, when the market movement does not have a pronounced focus. The indicator works on the basis of two moving average as well as an oscillator. Using the signal search algorithm, the indicator generates signals in the form of arrows. Benefits. Allows you to determine the current trend. You can quickly enough understand which particular trend is currently
    Dolphin Bands indicator works equally well on any timeframes. For medium-duration trends, it is recommended to use the standard setting. To study long-term trends, it is recommended to use an indicator value greater than the standard. To analyze short-term trends, it is better to use a lower indicator value. Most often, an exponential method is used to calculate the indicator, but other varieties can also be used. Dolphin Bands is a collection of lines. The two center lines of the indicator ar
    Martingals indicator works on all currency pairs and on all timeframes. The arrows indicate the optimal entry points for future Martingale averaging, even with a zero exponent. The indicator shows a signal to close the series only if all previous signals can be closed in profit. After closing a series in profit, you need to immediately open an order in the direction of the signal. Thus, the close signal is at the same time the reverse opening point to the other side of the new order. The probabi
    Levels Market is one of the simplest, but no less effective tools from this. Pivot points can be built from these levels, levels are constructed as statistical significance at a given point in time. Trading by levels is a classic in the work of a trader. You can use them as a ready-made trading strategy or as an additional filter in your trading system. In the settings you can specify the offset for building levels. Interpretation of levels: Lines 8/8 and 0/8 (Final Resistance). These lines ar
    Trend New Trend Indicator, shows the signals for entry. Displays both entry points and the trend itself. Shows statistically calculated moments for entering the market with arrows. When using the indicator, it is possible to optimally distribute the risk factor. Settings: Uses all one parameter for settings. Selecting a parameter, it is necessary to visually resemble it so that the appropriate graph has a projection of extremes. Options: Length - the number of bars for calculating the indica
    Condors TMA  ( Triangular Moving Average ) is a channel indicator without redrawing, built on the basis of moving averages. The key difference between the Condor TMA indicator and other channel indicators (for example, from the same Bollinger indicator) is that Condor TMA takes into account not simple moving averages, but twice smoothed ones, which allows one to more clearly determine the market movement, and on the other hand makes the indicator less sensitive.
    Cancer indicator is great for trend trading! An intelligent indicator algorithm with high probability shows the points of potential market reversal. If you are trading in a trend, then a trading strategy built on the basis of this indicator is perfect for you. The indicator filters out market noise, almost everything and all the necessary functions for working with a thread are built into one tool. It works on all currency pairs and on all timeframes, indicator setting - according to your desire
    A very simple and convenient trend indicator based on price divergence. He showed himself well in scalping. Help in finding entry points for analysis. It can be used as a filter in trade. It has two parameters: Period and Level. The Level parameter helps to filter out excess signals. For example, for EURUSD, the Level parameter may be 0.0001. The indicator can work both for entry points and as a filter. The indicator reflects information in a visual form. We must not forget that the approach to
    Calculated trend indicator, can be used with an optimal risk to profit ratio, shows successful signals. Uses two options for settings. Shows favorable moments for entering the market with arrows. The probability of a successful trend is not very bad! The indicator can be used both for pipsing on small periods, and for long-term trading. The indicator does not redraw and does not lag. It works on all currency pairs and on all timeframes.
    XStrain
    Vitalii Zakharuk
    The XStrain expert system works on all types of accounts. It works both in 4 and 5-digit quotes. Spread and requotes are not critical, any broker is suitable. To optimize the expert system, one year is recommended for the period H1 or H4. Optimization can be carried out at opening prices, the results differ little from testing on real ticks, since the bot works at opening prices. It is enough to optimize once a month! To get better results, it is recommended to work on several different pairs.
    An expert of a new type Formulas has been created - it works using sharp tick movements. The uniqueness of the expert is that it can be launched on any hour period, any currency pair, and on the server of any broker. What makes the expert attractive enough to use for trading. It is recommended to work on liquid forex pairs with a low spread. The lower the commission and spread, the greater the profit. You can start using it with $ 100 and a lot of 0.01. A small initial deposit also contributes
    The Trend Distinctive indicator smoothes price fluctuations during signal formation by averaging the data. This gives the trader the opportunity to visually determine what trend will be present at a particular time interval. This is an auxiliary tool for technical analysis, which helps to determine the exact direction of the trend: either an upward or downward movement of the price of a trading instrument. Although the indicator is a little late, it still generates the most reliable signals th
    Red Bot
    Vitalii Zakharuk
    The mechanism of work of the Red Bot Expert Advisor is designed so that before opening a transaction, they undergo instant implicit filtering, which, if there are competent and practical settings, allows the buyer to level the number of unprofitable and unproductive transactions. The adviser has a large number of internal regulators, software installations and special codes that help to safely and efficiently trade. This is a fully automated Expert Advisor, built on the scalping strategy, work
    Introduced expert system   Stable Ex works with the EURUSD currency pair and only with it. This system implemented the principle of five orders - that is, a maximum of five orders can be placed in one direction, after which the total position of the series must be closed by stops, either real or virtual. The trading system is designed to work separately with a series of buy orders and separately with a series of sell orders. which makes the trading system versatile enough. The expert passes all
    The presented expert system works with the GBPUSD currency pair and only with it. This system implemented the principle of seven orders - that is, a maximum of seven orders can be made in one direction, after which the total position of the series should be closed by stops, either real or virtual. The trading system is designed to work separately with a series of buy orders and separately with a series of sell orders. which makes the trading system versatile enough. The expert passes all types
    Transition indicator can track a steady price movement in a certain direction. In this case, the movement itself can be downward, upward or sideways, when the market movement does not have a pronounced focus. The indicator works on the basis of two moving average as well as an oscillator. Using the signal search algorithm, the indicator generates signals in the form of arrows. Trading based on trend indicators is the simplest and often the most effective. If you correctly determine the beginni
    Global Trend Indicator, shows the signals for entry. Displays both entry points and the trend itself. Shows statistically calculated moments for entering the market with arrows. When using the indicator, the risk factor can be optimally distributed. Settings: Uses all one parameter for settings. Choosing a parameter, it is necessary to visually resemble it so that the appropriate graph has a projection of extremes. Parameters: Length - the number of bars for calculating the indicator. Use
    Trend DI is an auxiliary tool for technical analysis that helps determine the exact direction of a trend: either an upward or downward movement of the price of a trading instrument. Although the Trend DI indicator is a bit late, it still generates the most reliable signals that a trader can safely navigate. The Trend DI indicator smooths price fluctuations during signal formation by averaging data. This gives the trader the opportunity to visually determine which trend will be present in a par
    The Trend ZVD Trend Indicator is important for identifying trends in financial markets. However, this indicator works equally well during consolidation periods. The Trend ZVD trend indicator indicates the direction in which the asset of your choice can move. The Trend ZVD trend indicator copes with the main task of trading: to find the entry point to the market at the time the trend is created and the exit point at the time it is completed. A trend in trade is the steady movement of quotes in
    An indicator from the zigzag family with levels. First of all, I will point out arguments in favor of the advisability of using a level indicator. They give the trader the following benefits: Alternative points of view - the level indicator helps to look at the levels from the side, compare them with several automatic systems, identify errors; Saving time - reducing the cost of effort for self-building lines; Exact mathematical calculation - quick calculation of levels, ratios of indicators
    The Progress Scalp strategy is based on tick trading principles. At its core, this strategy is fenders, that is, the trader receives signals for opening positions during pullbacks from the main movement. A distinctive feature of this strategy is that transactions are concluded only during periods of strong tick movements in the forex market. The Progress Scalp strategy was developed for trading with different currency pairs. You need to choose a currency pair with the lowest spreads and virtual
    Long
    Vitalii Zakharuk
    The Long expert system works with the EURUSD currency pair and only with it. The trading system is designed to work separately with a series of buy orders and separately with a series of sell orders. which makes the trading system versatile enough. The expert passes all types of testing throughout the history for the specified currency pair. Also, the expert system is tested with various delay values, it works in fully automatic mode! No settings are needed, use only the default settings. Thi
    The indicator is simple and clear, making the work of the trader as easy as possible and giving clear signals to enter the market. This indicator has two settings for the period. Which makes it more flexible. And at the same time, many false signals do not appear. The larger the period, the smoother the indicator itself will be. It can be used both independently and together with other indicators of technical analysis (including with oscillators), as well as with another same indicator (with
    Индикатор отображает регнессионный канал с сопровождением каналов фактически создавая уровни поддержки и сопротивления. Уровни поддержки и сопротивления являются одним из важнейших элементов технического анализа. С этим утверждением согласится любой трейдер. Уровни в трейдинге используются непосредственно, открывая и закрывая ордера у границ диапазона, очерченного ими. Также уровни применяют баланс спроса и предложения в своих торговых стратегиях на различных временных интервалах. Визуальное
    An expert of a new type Anniversary - works using sharp tick movements, the algorithm that was created earlier is significantly improved. The uniqueness of the expert is that it can be launched on any hour period, any currency pair, and on the server of any broker. What makes the expert attractive enough to use for trading. It is recommended to work on liquid forex pairs with a low spread. The lower the commission and spread, the greater the profit. You can start using it with $ 100 and a lot o
    The Trends Signal indicator displays the direction of the trend with arrows, works in a simple and clear way. It uses a combination of reliable and simple indicators to analyze prices. The signals of the Trends Signal indicator can be interpreted as follows: buy when the bars are colored blue, and sell when they are red. An effective indicator with a wide range of three parameters for trading. Parameters: Length - The number of bars to calculate. LevelUP, LevelDN - Levels for determining overb
    The Open Trend indicator calculates the saturation levels of the price chart. Most often, a good trend is visible on a price chart visually. But an experienced trader should clearly understand the current balance of power in the market before entering. A signal to exit the oversold area is a buy signal. A signal to exit the overbought area is a sell signal. Usually, you need to set the relative values ​​for the overbought and oversold levels Bottom and Top for this indicator. The Open Trend i
    Sharp
    Vitalii Zakharuk
    Sharp expert system works with a deposit of $ 100! The classic method of scalping. It is also worth noting that with the allowable level of the spread, the bot goes through any historical period on any currency pair. The key for the Sharp bot is the spread, it works with default settings, it is possible to work with a spread of up to 10. If the spread is more than 10, then you need to select other settings. Testing should be performed with a spread of up to 10 on all ticks. There is no point i
    Are you tired of the constant ups and downs? It is not worth becoming a victim of unstable market movements, it is time to somehow get rid of it! Already now, you can use Business Trend solutions to balance the analysis of price movements and get a clearer picture of price behavior. Business Trend is a trend indicator for the MetaTrader 4 trading platform. This indicator allows you to find the most likely trend reversal points. You will no longer find a copyright indicator like this. A simple
    フィルタ:
    レビューなし
    レビューに返信