BlueDigitsFx OBV Divergence MT5
- インディケータ
- バージョン: 1.21
- アップデート済み: 13 1月 2026
- アクティベーション: 6

BlueDigitsFx公式エコシステムへのアクセス
インフラ更新情報、トレーディングリソース、製品リリース情報、およびBlueDigitsFx公式エコシステムへのアクセスを取得できます。
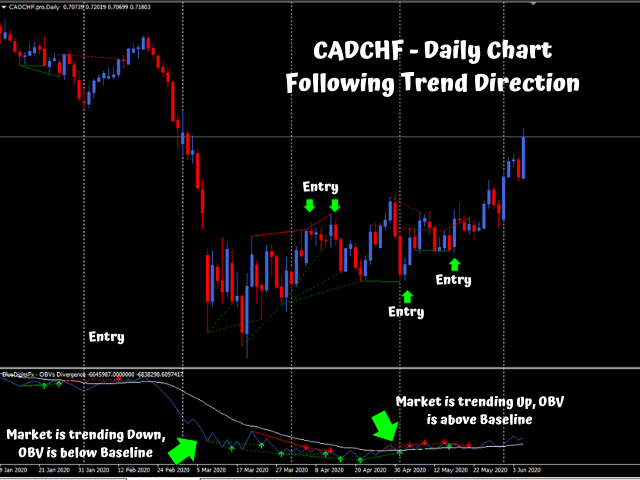
BlueDigitsFx OBV Divergence MT5 — 市場反転を特定するための出来高ダイバージェンスインジケーター
BlueDigitsFx OBV Divergenceは、価格変動とOn-Balance Volume(OBV)との間に発生する強気および弱気ダイバージェンスを検出するために設計されたMT5インジケーターです。
価格の動きと出来高の挙動を比較することで、このインジケーターはトレンドの失速、反転局面、モメンタムの変化を特定するのに役立ちます。
ダイバージェンスパターンはチャート上に直接表示されるため、出来高ベースの追加確認とともに市場構造を分析することができます。
主な機能
- 自動ダイバージェンス検出 — 強気・弱気のOBVダイバージェンスを自動的に検出します。
- 出来高と価格の比較 — 価格変動とOn-Balance Volumeの挙動を比較分析します。
- マルチタイムフレーム対応 — MT5のすべての対応時間足で利用可能です。
- カスタマイズ可能なアラート — ポップアップ、メール、プッシュ通知に対応しています。
- 分かりやすい視覚シグナル — ダイバージェンスエリアを視覚的に表示します。
- 軽量MT5ユーティリティ — MetaTrader 5で安定動作するよう最適化されています。
なぜトレーダーが利用するのか
出来高ダイバージェンスは、価格モメンタムと出来高の動きが一致しなくなった状況を特定するのに役立ちます。
OBV Divergenceは、トレンド分析、市場構造分析、サポート・レジスタンス分析、モメンタム戦略と組み合わせる追加確認ツールとして活用できます。
出来高分析とテクニカルチャート分析を組み合わせたいトレーダーに適しています。
トレーディングワークフロー例
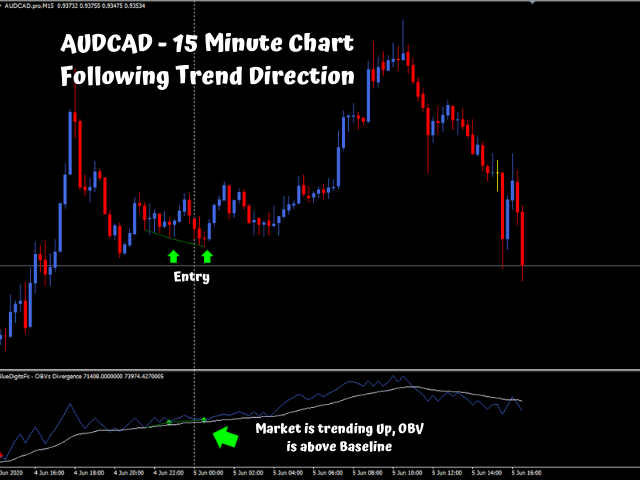
反転分析
サポート付近での強気ダイバージェンスや、レジスタンス付近での弱気ダイバージェンスを利用して、潜在的な反転局面を特定します。
エントリー前には、プライスアクションやトレンド構造による追加確認を推奨します。
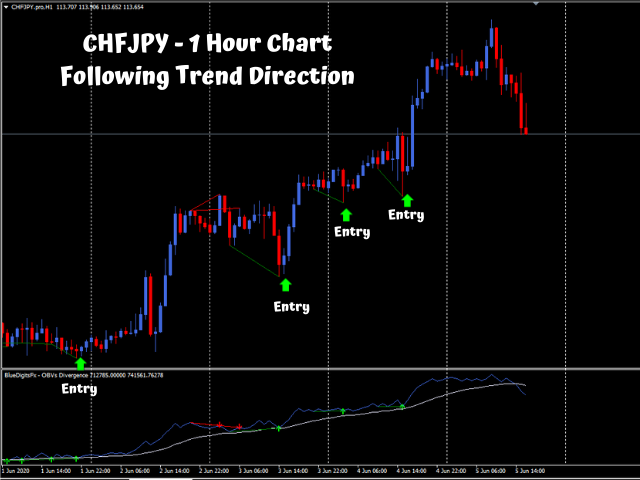
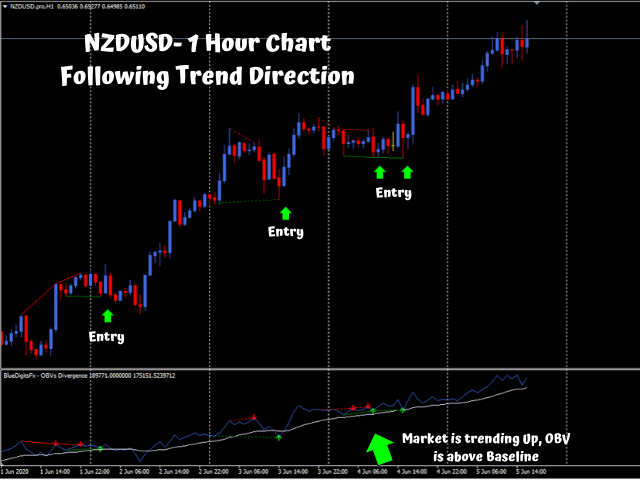
トレンド継続分析
OBV Divergenceは、価格変動と出来高挙動を比較することで、大きなトレンド内の弱い押し目や戻りを識別するのにも役立ちます。
これは、トレンド継続の機会を探しているトレーダーにとって有効です。
マルチタイムフレーム分析
上位足で発生したダイバージェンスゾーンを下位足のエントリーモデルと組み合わせることで、より多くの市場コンテキストを得ることができます。
多くのトレーダーは、出来高ダイバージェンス分析を市場構造システムやモメンタム戦略と組み合わせて利用しています。
使用方法
- BlueDigitsFx OBV DivergenceをMT5チャートに適用します。
- チャート上に表示される強気・弱気ダイバージェンスシグナルを監視します。
- 市場構造、トレンド方向、サポート・レジスタンスなどの確認手法と組み合わせて利用します。
推奨インフラ構成
BlueDigitsFx OBV Divergenceは、市場構造分析と出来高ダイバージェンス確認を組み合わせたいトレーダー向けに、BlueDigitsFx Easy 123 System MT5と特に相性が良いです。
Easy 123は構造ブレイク、反転検出、ブレイクアウト分析、サポート/レジスタンスゾーンに重点を置いており、OBV Divergenceは出来高分析による追加確認を提供します。
BlueDigitsFx Easy 123 System MT5:
https://www.mql5.com/en/market/product/50048
BlueDigitsFxインフラエコシステムの一部
BlueDigitsFx OBV Divergenceは、MT4およびMT5向けBlueDigitsFxトレーディングインフラエコシステムの一部であり、市場構造ツール、ワークフローユーティリティ、トレーディングダッシュボード、出来高分析、および本格的なMetaTraderユーザー向けのトレード管理支援に重点を置いています。
So far I like what the indicator does. I am giving it 5 stars (which is very rare for me) because of how it behaves and because the price was under 50 bucks. It is clear that above the line you buy and below the line you sell. I am unable to use the MT5 indicator due to a gliche, and therefore cannot trade certain assets, but the Vendor provided me another indicator for the MT4, that works with Forex Pairs. So I am not out any money. My only other comment is that there is there is no ability to adjust the settings. I think we should be able to do this because Forex Pairs often beat to a different drum. I will try and update the review if anything changes. 3-31-23 UPDATE Gliche has come back. I have sent a photo of what the indicator is doing on all timeframes. The pair is the USDJPY.