EQ Cutrim Theory

Ronal Cutrim has been a dedicated mathematician for 14 years and has more than 10 years of experience in the financial market.


The concept of the theory is simple, find imbalance between buyers and sellers.

Which makes a lot of sense, because nothing goes up forever, nothing falls forever.


When you find an asset with a mathematical probability of unbalanced equilibrium, it is a great way to get into trading: 

TUTORIAL: Turn on the subtitles, the video is subtitled


おすすめのプロダクト
Lumin Chart
John John Gutierrez Vivas
LUMIN Chart reads the market structure for you and draws the zones that matter. It finds support, resistance and Order Blocks, scores each one from 0 to 12 and rates it WEAK, MEDIUM or STRONG, so you can see at a glance which levels deserve your attention. This is an indicator only. It does not open, close or modify trades, and it does not need Algo Trading enabled. Key features Scored zones (0–12). Every zone is rated on: impulse leaving the zone rejection wick respected bounces (exhausted zone
Sloth Trader
Justus Wamswa Chemirmir
機関投資家のスマートマネー概念を取引するプロフェッショナルな Expert Advisor。多層リスクエンジンを搭載 — 規律正しく、セッションを認識し、完全自動化。 Sloth Trader — 機関投資家型スマートマネー自動化 機関投資家と同じように取引 — チャートを見つめ続ける必要はありません。 Sloth Trader は、スマートマネー手法に基づいて構築された完全自動化 Expert Advisor です。10年にわたる市場構造研究を、単一の規律あるロボットにまとめ上げ、市場をスキャンし、独自の取引計画を立て、すべての取引を最初から最後まで管理します。 これはインジケーターでも、シグナルサービスでも、「設定して祈る」グリッドでもありません。ルールベースでイベントドリブンなシステムであり、独自のコンフルエンスエンジンが同意したときだけ行動し、その後は機関投資家級のリスク管理であなたを守ります。 できること 市場構造インテリジェンス 機関投資家トレーダーと同じように価格行動を読む 高確率の機会ウィンドウが有効なときだけ取引 — 死んだ時間帯にランダムなエントリーはしない エン
Quantum Forge
Kgotlaetsile R Mabote
# Quantum Forge EA - Channel Breakout Strategy ## Product Overview Quantum Forge is a professional-grade automated trading system built for MetaTrader 5. It implements a sophisticated channel breakout strategy that identifies high-probability trade entries when price breaks above or below a dynamic price range. The EA is designed with institutional-grade risk management and universal broker compatibility. ## Core Strategy Logic The EA calculates the highest high and lowest low over a config
Rtc ML Ai | Predictor CORE MACHINE LEARNING ENGINE Adaptive ML Market Predictor – Multi-Bar Trend & Candle Forecast What This Indicator Does This indicator is a  real-time market prediction engine  designed to analyze price behavior and estimate  future market tendencies . Unlike conventional indicators, this system  does not rely on static parameters or historical curve-fitting , but adapts its internal state dynamically during live market operation. Instead of using static rules, the indic
LazyTrader Market Intelligence Multi-Market Trend & Level Analysis See the Bigger Picture. Understand the Market Context. Discover a more structured approach to chart analysis with LazyTrader Market Intelligence — a visual trading indicator designed to bring trend direction, technical conditions, key price levels, market structure and economic-calendar information together in one organized dashboard. Built for traders who want a broader view of market conditions, LazyTrader Market Intelligence h
Tun SnR Sweep
Muhammad Edzwan Ashraf
Tun SnR Sweep — Look To The Right Method Tun SnR Sweep is an MT5 market-structure indicator designed for traders who want a cleaner way to identify important Support & Resistance, Liquidity Sweeps, SBR/RBS structure, and multi-timeframe price levels directly on the chart. Launch price: 35 USD Early Bird: 90 USD Normal Price: 250 USD The concept is simple: instead of filling the chart with unnecessary signals, Tun SnR Sweep helps traders focus on the important structure around current price and
Gold M3 Doji Breakout H1 Gold M3 Doji Breakout H1 is an automated MetaTrader 5 Expert Advisor designed to identify a fixed M3 compression structure inside a closed H1 candle and evaluate a breakout during the following H1 trading window. This product is designed for Gold symbols. Its default absolute-price distances are not intended for Forex pairs, cryptocurrencies or stock indices. Position management The EA divides the position into three stages: - Stage 1 closes at the configured first
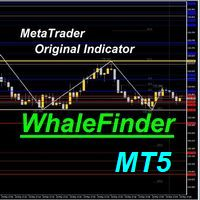
Considering the main theories of Forex (Dow Theory, support lines, chart patterns, and Fibonacci retracements), It tells you the price range where whales (large investors) are likely to appear. You can trade at the price points that professionals also aim for. You no longer have to warry about where to aim next. We are live-streaming the actual operation of the system. Please check for yourself if it is usable. Please check it out for yourself. https://www.youtube.com/@ganesha_forex We do not
[b]Titan Pro V7 Institutional Dashboard[/b] is an advanced quantitative HUD terminal engineered for MetaTrader 5, designed for institutional market analysis, quantitative prop-firm verification, and disciplined intraday execution. Unlike conventional single-formula indicators that suffer from lag and market regime shifts, Titan Pro V7 synthesizes a multi-strategy quantitative consensus model combining Trend Momentum, Volatility Breakout, Intraday VWAP, and Smart Money Concepts (SMC) into a sin
Smart Swing Signals (SSS) Smart Swing Signals (SSS): closed-candle BUY/SELL arrows, projected swing zones and a transparent evidence score for XAUUSD and other markets. Trade with evidence, not guesswork Most arrow indicators fire a signal on almost every candle and never tell you why. Smart Swing Signals (SSS) works differently. It gathers several independent kinds of market evidence, scores bullish and bearish conditions separately, and draws an arrow only when the setup passes your own rules.
Limitless MT5 is a universal indicator suitable for every beginner and experienced trader. works on all currency pairs, cryptocurrencies, raw stocks Limitless MT5 - already configured and does not require additional configuration And now the main thing Why Limitless MT5? 1 complete lack of redrawing 2 two years of testing by the best specialists in trading 3 the accuracy of correct signals exceeds 80% 4 performed well in trading during news releases Trading rules 1 buy signal - the ap
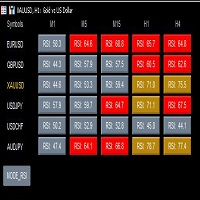
This is a powerful multi cycle, multi currency pair, and multi indicator monitoring tool for MT5 version, with main functions including: 1. Monitor real-time performance of multiple indicators, including RSI, MACD, MA, and STO. 2. Monitor multiple currency pairs, customizable to add or delete currency pairs, and automatically update indicators. 3. Monitor multiple currency pairs over multiple cycles. 4. After clicking, you can directly switch to the chart and cycle you want to view. 5. Click th
Odin Golden Matrix Advanced Trend-Following Grid & High-Frequency Scalping Engine Odin Golden Matrix is a premium, institutional-grade automated trading system explicitly engineered for the Gold (XAUUSD) market. Designed for both high-net-worth investors and everyday traders, Odin now fully supports both Standard and Cent Accounts, delivering scalable performance across different capital sizes. Powered by a dynamic trend-following matrix and an active overlap recovery engine, Odin systematical
GP Confluence Scanner MT5 Advanced Multi-Timeframe Market Structure & Confluence Analysis Don't get stopped out easily again! GP Confluence Scanner MT5 is an advanced technical analysis indicator designed to reveal important market levels, hidden support and resistance, and multiple technical confluences before entering a setup. Rather than relying on a single indicator, GP Confluence Scanner examines multiple technical factors to identify areas where significant market reactions may occur. Key
GannNexus :価格と時間の幾何学の究極の融合 市場に隠された幾何学的構造を解き明かします。 GannNexus v3.10  は、単なるサポート/レジスタンス指標ではありません。これは、 ジョン・マーフィー の古典的な市場構造分析と、 W.D.ギャング の高度な「価格-時間角度」理論、9の平方(Square of 9)の数学、および神聖幾何学を融合させた包括的な分析エンジンです。 精度を求めるトレーダーのために設計されたこのツールは、市場の形状(正方形、三角形、六角形)を自動検出し、主要なピボットから動的なギャン角度を計算し、9の平方の公式を使用して将来の価格/時間ターゲットを投影します。 主な機能 1. 高度なサポート&レジスタンスエンジン 動的なS/Rレベル: 最近のピボットのクラスターに基づいて、重要なサポートおよびレジスタンスゾーンを自動的に識別します。 トレンドライン: 主要な高値と安値を接続する自動トレンドラインを描画し、即時の市場方向を可視化します。 ピボットポイント: スイングハイとスイングローをカスタマイズ可能な矢印で明確にマークします。 2. W.D.
Elevate Your Price Action Trading with the Valid BOS Pullback MT5 Indicator Master market structure and capture high-probability entries with the Valid BOS Pullback indicator. Designed specifically for professional traders, this algorithm filters out market noise by identifying genuine break-of-structure setups following a verified pull-back and retest of old levels. Whether you are trading major Forex currency pairs or specialized Synthetic Crash Indices that feature sudden spikes, this indicat
Dragonfly CDO Pro v2 is a powerful, accurate, and easy-to-use MT5 indicator designed for serious traders who want high-probability entries with built-in risk management. It combines 6 EMA alignment , a unique CDO oscillator , smart pattern recognition , and EMA touch filter to deliver clean BUY and SELL signals with automatic TP/SL levels. Key Features & Advantages: Full 6 EMA Alignment Filter – Only trades when fast to slow EMAs are perfectly aligned Smart CDO Oscillator – Detects momentum dips
Aurus Robot MT5 — Intelligent Adaptive Trading Algorithm Aurus Robot MT5 is a professional trading system that combines classic technical analysis with modern statistical data processing methods. The Expert Advisor is designed for traders who value precise entry and strict risk management. Key Features: Adaptive algorithm: The robot analyzes volatility and market structure in real time, adjusting order and take-profit distances to the current phase (trend or flat). Multi-factor analysis: The sy
MagicZone – Advanced Order Flow & Market Depth Indicator MagicZone   is a professional multi‑dimensional indicator that visualises   order book dynamics ,   bid/ask pressure ,   volume‑based support/resistance zones , and   real‑time DOM (Depth of Market)   levels – all in a clean, customisable sub‑window. Ideal for   scalpers ,   day traders , and   order flow analysts   who want to see exactly where large orders accumulate and how market participants drive price. Key Features 1. Order Book
Automated Supply and Demand Tracker MT5. The following videos demonstrate how we use the system for trade setups and analysis.US PPI, Fed Interest Rates, and FOMC Trade Setup Time Lapse: U.S. dollar(DXY) and Australian dollar vs U.S. dollar(AUD/USD)  https://youtu.be/XVJqdEWfv6s  The EUR/USD Trade Setup time lapse 8/6/23.  https://youtu.be/UDrBAbOqkMY . US 500 Cash Trade Setup time lapse 8/6/23  https://youtu.be/jpQ6h9qjVcU .  https://youtu.be/JJanqcNzLGM ,  https://youtu.be/MnuStQGjMyg,&nbsp ;
Scalpium X
Saiful Izham Bin Hassan
あなたはすでに金融市場がいかに挑戦的であるかを知っています。突然の市場の急騰がストップロスを誘発するのを見ての frustration、あるいはたった一度の悪い日が何週間分の安定した利益を消し去るストレスを経験したことがあるでしょう。これは個人トレーダーによくある循環であり、特にプロップファームの資金で取引する場合に顕著です。 プロのリスクマネージャーのように積極的に資本を守るだけでなく、高い確率のエントリーを探す自動化システムを導入することを想像してみてください。 Scalpium X をチャートに追加すると、すぐに違いに気付くでしょう。あなたはもはや、一般的で保護されていない取引アルゴリズムに依存しているわけではありません。相関の罠、大きなドローダウン、VPSのクラッシュから数学的にアカウントを保護しながら、外科的なスキャルピング機会を探すように設計された、完全なステートマシンアーキテクチャを利用しています。 取引戦略 Scalpium X は、洗練されたマルチタイムフレーム(MTF)コンフルエンスフレームワークで動作します。常に取引するわけではありません。代わりに、市場が
XAU Precision Flow EA is a professional-grade trading system designed specifically for XAUUSD (Gold) . It applies a multi-layered confirmation framework using higher-timeframe market structure, momentum alignment, and trend continuation behavior. This ensures that every trade is taken with directional bias already established , significantly reducing noise and false entries that are common in lower-timeframe gold trading. The EA focuses on high-probability directional movements , entering only w
LIGHTHOUSE — 相場の構造がひと目でわかる。リペイントなし。 LIGHTHOUSE は、確定した山と谷から相場の構造を読み取り、チャートにすっきり表示します。エントリー前に誰もが確かめたい3つのこと、「上位足はどちら向きか」「今のチャートはどちら向きか」「大事な価格はどこか」に答えます。 裁量の判断を助けるツールです。売買はせず、価格の予想もしません。 なぜ「LIGHTHOUSE(灯台)」? 灯台は船に進む道と岩場を知らせますが、舵を取るのは船長です。LIGHTHOUSE もチャートの上で、相場の方向と反応しやすい価格帯を示します。判断はあなた自身のものです。 しくみ 山・谷は足が確定してから付けます。一度付いた印は動いたり消えたりしません。 構造の抜けはヒゲではなく終値で判定します。 方向は「最後に終値で抜けた向き」と「直近2つの山・谷の並び」(ダウ理論)で決めます。 同じ判定を上位足(初期値 H1)にも使います。 主な機能 5段階の方向:強い買い・買い・中立・売り・強い売り(上位足と今のチャートの両方)。 HH・HL・LH・LL の印と2色のジグザグ。 BOS(方向の継続
https://youtu.be/JJanqcNzLGM ,  https://youtu.be/l70MIHaQQa4 ,  https://youtu.be/pg0oiT5_8y0   Automated Supply and Demand Trading Edge MT5. These videos demonstrate how we apply the supply and demand system to our latest trading review and market analysis Enhance your Trading Strategy with the Supply and Demand Trading Edge MT5. Gain a competitive market advantage with the Supply and Demand Trading Edge MT5 indicator, a powerful tool that combines MACD signals with supply and demand zones. By
XAU Alpha Session – STD | Expert Advisor Description XAU Alpha Session – STD is a fully automated Expert Advisor (EA) engineered for disciplined, rules-based trading on the Gold (XAU/USD) market. The EA is designed exclusively for the M30 (30-minute) timeframe and operates within a defined trading session window centered on the New York market open, capitalizing on structured price behavior during one of the highest-liquidity periods of the trading day. The system combines session-based price st
JESUS CROSS Indicator by Damion Description: The MA Crossover indicator is designed to alert traders when two moving averages cross on a 30-minute chart. It uses a Fast Moving Average (10-period) and a Slow Moving Average (21-period) to detect crossovers, which are commonly used as signals for potential trend changes. Key Features: Fast and Slow MA : The indicator employs a 10-period Fast Moving Average (FastMA) and a 21-period Slow Moving Average (SlowMA). Customizable Settings : Users can req
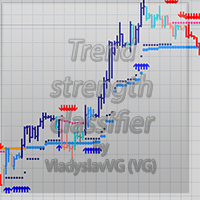
Классификатор силы тренда. Показания на истории не меняет. Изменяется классификация только незакрытого бара. По идее подобен полной системе ASCTrend, сигнальный модуль которой, точнее его аппроксимация в несколько "урезанном" виде, есть в свободном доступе, а также в терминале как сигнальный индикатор SilverTrend . Точной копией системы ASCTrend не является. Работает на всех инструментах и всех временных диапазонах. Индикатор использует несколько некоррелируемых между собой алгоритмов для класси
NanoTrade Pro NanoTrade Pro   is a state-of-the-art automated trading advisor designed to optimize your trading strategy in the fast-paced financial markets. Leveraging advanced algorithms and real-time data analysis, NanoTrade Pro automates the scalping process, enabling traders to capitalize on small price movements with remarkable precision and efficiency. Basically, the advisor does not use any risk systems with increasing volume or increasing the number of open orders. Before buying, be s
My PVSR
Ashok Kumar Singha
My PVSR   is based on All Type of Pivot Points. Use this Indicator to get proper Support / Resistance Zone and Trade accordingly.. Recommendation: Use this Indicator along with my another Indicator --->>> Dr. Trend   <<<--- Click Here ; To get the best output result feel free to contact me ; Best of Luck It can be used for: All Pairs: Forex, Cryptocurrencies, Metals, Stocks, Indices etc. All Timeframe All Brokers All type of Trading Style like Scalping, Swing, Intraday, Short-Term, Long-
このプロダクトを購入した人は以下も購入しています
ARIPoint
Temirlan Kdyrkhan
1 (4)
ARIPoint is a powerful trading companion designed to generate high-probability entry signals with dynamic TP/SL/DP levels based on volatility. Built-in performance tracking shows win/loss stats, PP1/PP2 hits, and success rates all updated live. Key Features: Buy/Sell signals with adaptive volatility bands Real-time TP/SL/DP levels based on ATR Built-in MA Filter with optional ATR/StdDev volatility Performance stats panel (Success, Profit/Loss, PP1/PP2) Alerts via popup, sound, push, or email Cu
MERAVITH SCANNERは、MetaTrader 5用のプロフェッショナルな金融市場インジケーターで、複数の分析ツールを一つの統合システムにまとめています。独自の出来高加重平均価格(VWAP)手法を使用してすべての計算を自動で行い、主観的な解釈を完全に排除します。 このインジケーターは、すべての資産クラス(FX、株式、指数、商品、暗号通貨)およびM1から月足までのすべての時間軸で動作します。基本原理は「価格は出来高に従う」というものです。MERAVITHは機関投資家の出来高が集中するポイントを特定し、その集中から数学的に正確な価格レベルを導き出します。予測や投機は行わず、計算のみを行います。 MERAVITH SCANNERを使用すると、28の主要FX通貨ペアをすべての時間軸でわずか2~3分でスキャンできます。また、任意の市場をスキャンすることも可能です。例えば、約100銘柄の株式を約10分でスキャンできます。 インジケーターは、消耗レベル、均衡線、偏差、統計レベル、およびターゲット予測を算出します。 チャート要素 Origin Point :すべての計算が始まる起点です。イン
note: this indicator is for METATRADER4, if you want the version for METATRADER5 this is the link:  https://www.mql5.com/it/market/product/108106 TRENDMAESTRO ver 2.5 TRENDMAESTRO recognizes a new TREND from the start, he never makes mistakes. The certainty of identifying a new TREND is priceless. DESCRIPTION TRENDMAESTRO identifies a new TREND in the bud, this indicator examines the volatility, volumes and momentum to identify the moment in which there is an explosion of one or more of these da
AriX
Temirlan Kdyrkhan
1 (4)
AriX Indicator for MT5 A powerful trend-following and signal-evaluation tool AriX is a custom MT5 indicator that combines Moving Averages and ATR-based risk/reward logic to generate clear buy/sell signals. It visualizes dynamic SL/TP levels, evaluates past trade outcomes, and displays win/loss statistics in a clean on-chart panel. Key features include: Buy/Sell signals based on MA crossovers ATR-based SL/TP1/TP2/TP3 levels with visual lines and labels Signal outcome tracking with real-time stat
Volume Arrow Signal Product Description Volume Arrow Signal is a smart trading indicator designed to help traders identify potential buy and sell opportunities using price action, volume behavior, and directional arrow signals. The indicator places clear arrows directly on the chart, making it easy to spot possible market reversals, trend continuations, and entry opportunities without spending hours analyzing charts manually. Whether you are trading Gold (XAUUSD) , Forex pairs, Indices, or Crypt
一言でいうと このインジケーターは RSI と MACD という2人の専門家を1つにまとめたもの です。2つのチャートを別々に見て判断する代わりに、両方が同意したときだけ「買い」または「売り」の矢印を表示します。 矢印は再描画されません 。一度出現すれば、そのまま固定されます。 「コンボ」の意味 通常、トレーダーは RSI(値動きの勢い)と MACD(トレンドの方向)を別々に見ます。しかし両者が矛盾することも多いです。 このインジケーターでは、 両方が同時に同意したときのみシグナル を出します。これにより、多くの偽シグナルが排除されます。 画面で見えるもの 価格チャートとは別のインジケーターウィンドウ 青と赤の矢印 —— そのまま使えるシグナル 拡大表示された MACD ヒストグラム(見やすく強調されている) RSI と MACD のラインも表示されるが、注目すべきは矢印 こんな人におすすめ 初心者 —— 2つのインジケーターを別々に解釈し、矛盾に対処する必要がない 経験者 —— シグナルの高速フィルタリングと、再描画しないクリアなロジック 迷いたくない人 —— 「買い」「売り」「待て
MasterTrend Indicator for MT5 A powerful trend-following and signal-evaluation tool MasterTrend   is a custom MT5 indicator that combines Moving Averages and ATR-based risk/reward logic to generate clear buy/sell signals. It visualizes dynamic SL/TP levels, evaluates past trade outcomes, and displays win/loss statistics in a clean on-chart panel. Key features include: Buy/Sell signals based on MA crossovers ATR-based SL/TP1/TP2/TP3 levels with visual lines and labels Signal outcome tracking wit
PrimeScalping is a powerful trading companion designed to generate high-probability entry signals with dynamic TP/SL/DP levels based on volatility. Built-in performance tracking shows win/loss stats, PP1/PP2 hits, and success rates — all updated live. Key Features: Buy/Sell signals with adaptive volatility bands Real-time TP/SL/DP levels based on ATR Built-in MA Filter with optional ATR/StdDev volatility Performance stats panel (Success, Profit/Loss, PP1/PP2) Alerts via popup, sound, push, or e
The Expert Advisor and the video are attached in the Discussion tab . The robot applies only one order and strictly follows the signals to evaluate the indicator efficiency. Pan PrizMA CD Phase is an option based on the Pan PrizMA indicator. Details (in Russian). Averaging by a quadric-quartic polynomial increases the smoothness of lines, adds momentum and rhythm. Extrapolation by the sinusoid function near a constant allows adjusting the delay or lead of signals. The value of the phase - wave s
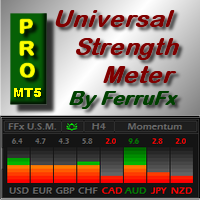
FFx Universal Strength Meter PRO is more than a basic strength meter. Instead of limiting the calculation to price, it can be based on any of the 19 integrated strength modes + 9 timeframes. With the FFx USM, you are able to define any period for any combination of timeframes. For example, you can set the dashboard for the last 10 candles for M15-H1-H4… Full flexibility! Very easy to interpret... It gives a great idea about which currency is weak and which is strong, so you can find the best pai
The FFx Universal MTF alerter shows on a single chart all the timeframes (M1 to Monthly) with their own status for the chosen indicator. 9 indicators mode (MACD-RSI-Stochastic-MA-ADX-Ichimoku-Candles-CCI-PSAR). Each can be applied multiple times on the same chart with different settings. Very easy to interpret. Confirm your BUY entries when most of the timeframes are showing green color. And confirm your SELL entries when most of the timeframes are showing red color. 2 Alert Options : input to s
The FFx Watcher PRO is a dashboard displaying on a single chart the current direction of up to 15 standard indicators and up to 21 timeframes. It has 2 different modes: Watcher mode: Multi Indicators User is able to select up to 15 indicators to be displayed User is able to select up to 21 timeframes to be displayed Watcher mode: Multi Pairs User is able to select any number of pairs/symbols User is able to select up to 21 timeframes to be displayed This mode uses one of the standard indicators
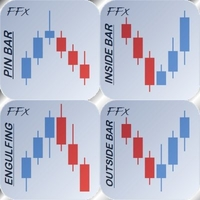
FFx Patterns Alerter gives trade suggestions with Entry, Target 1, Target 2 and StopLoss .... for any of the selected patterns (PinBar, Engulfing, InsideBar, OutsideBar) Below are the different options available: Multiple instances can be applied on the same chart to monitor different patterns Entry suggestion - pips to be added over the break for the entry 3 different options to calculate the SL - by pips, by ATR multiplier or at the pattern High/Low 3 different options to calculate the 2 TPs -
MetaTrader 4 version available here : https://www.mql5.com/en/market/product/24881 FFx Basket Scanner is a global tool scanning all pairs and all timeframes over up to five indicators among the 16 available. You will clearly see which currencies to avoid trading and which ones to focus on. Once a currency goes into an extreme zone (e.g. 20/80%), you can trade the whole basket with great confidence. Another way to use it is to look at two currencies (weak vs strong) to find the best single pairs
MetaTrader 4 version available here: https://www.mql5.com/en/market/product/25793 FFx Pivot SR Suite PRO is a complete suite for support and resistance levels. Support and Resistance are the most used levels in all kinds of trading. Can be used to find reversal trend, to set targets and stop, etc. The indicator is fully flexible directly from the chart 4 periods to choose for the calculation: 4Hours, Daily, Weekly and Monthly 4 formulas to choose for the calculation: Classic, Camarilla, Fibonac
ClassicSBA
Umri Azkia Zulkarnaen
this indicator very simple and easy if you understand and agree with setup and rule basic teknical sba you can cek in link : please cek my youtube channel for detail chanel : an for detail info  contact me  basicly setup buy (long) for this indicator is Magenta- blue and green candle or magenta - green  and green candlestik and for setup sell (short) is Black - yellow - and red candle or black - red  and red candlestik
A scalping indicator based on mathematical patterns, which on average gives signals with relatively small SL, and also occasionally helps to catch big moves in the markets (more information in the video) This indicator has three main types of notifications: The first type warns of a possible/upcoming signal on the next bar The second type indicates the presence of a ready signal to enter the market/open a position The third type is for SL and TP levels - you will be notified every time price re
Recommended TimeFrame >= H1. 100% Non Repainted at any moment.  Use it carefully, only with Trend Direction. Trading Usage: 2 Variants: as Range System or as BreakOut System (Both Only With Trend Direction)::: (Always use StopLoss for minimise Risk); [1] as Range System: (Recommended) in UP TREND:  - BUY in Blue Line , then if price goes down by 50 points (on H1) open Second BUY.   Close in any Profit you wish: TrailingStop(45 points) or Close when Price touches upper Gold Line. in DOWN TREND
this indicator is a Spike detector indicator, it is specially designed to trade Boom 1000, Boom 500, Crash 1000 and Crash 500 We recommend using it on Deriv Boom and Crash indices only Its setting is intuitive, familiar, easy to use it has notification functions; audible notifications and push notifications. this tool is simple to use, easy to handle This update is based on different strategies for spikes
QuantXSTocks Trading Range Indicator for MT5: INSTRUCTIONS TO USE OUR INDICATOR:- User needs to take trade on Arrow or after an Arrow CandleStick, You can achieve up-to 35-125 pips target by this Indicator. Best Timeframes for Stocks and Indices are M30 and H1: AMAZON M30 (50 pips) TESLA M30 (50 pips) APPLE M30 (50 pips) ADOBE M30 (50 pips) NASDAQ100 H1 (125 pips) The above are the approximate amount of pips you can achieve by this Indicator, Green arrow appears to be buy arrow while the Red ar
Trend and Signals MT5  indicator scans  30 trading Instruments (Forex, Metals and Indices).     It uses special algorithm on the  current market   based on   Pure Price Action   and display the overall trend and signal on the dashboard. When signals are produced the indicator sends alert and notification. Strategy for Signals This indicator uses the daily timeframe to determine the direction of the trend. The hourly timeframe is used to identify possible entries. Main trend and is determined by
This indicator is based on a mathematical formula and an ANN combined, designed to make a model(using previous prices) of the most recent market condition (any chart*) in order to use the model as a forecasting tool. *This indicator can operate on any chart/timeframe, but it's suggested you use multiple timeframes for each trade because this method relies solely on the time factor, you can not use this indicator to predict price volatility, but if it's fit correctly it will show you when the nex
This indicator is based on the crossing of two Moving Average with the RSI It is intended for scalpers Specially designed for Boom and Crash syhtetic indices from Binary.com/Deriv.com It is easy to use and intuitive. We recommend its use on M1 and is equipped with three types of notification Email alert Sound notification Push notification these parameters can be activated and deactivated.
IVISTscalp5
Vadym Zhukovskyi
5 (6)
[iVISTscalp5]:時間を通じた市場行動研究ラボ TLV Framework | Liquidity Activation Points ⸻ 概要 iVISTscalp5 は、VISTmany プロジェクトの一環として開発された、多層型のタイミングおよび価格構造インジケーターです。 このシステムは、Liquidity Activation Points(タイミング)を通じて、 動きが発生する時間 方向性 値動きの範囲 を予測します。 iVISTscalp5 インジケーターは、デフォルト設定のまま、あらゆる金融商品に使用できます。 ⸻ 実践的価値 iVISTscalp5 は、一般的なテクニカル指標として開発されたものではありません。 開発の中心的な理念は次の通りです。 あらゆる人が「時間」を通じて市場行動を研究できるようにすること。 ⸻ Time Language VISTmany (TLV) — プロジェクトの主要概念 t(p) t(p) は、タイミングが活性化する価格レベルです。 ⸻ p(p) p(p) は
Use with JUMP 25. However it can can with the volatility indices as well because it is a modified version. It is advisable to use create a healthy account management. Measure your risk and happy trading. Other experts to be loaded soon. These are modified in order to optimise profits. Ideal candidates are high risk, high returns individuals who hold trades at a maximum of 1 - 2 hours
This indicator is a scalping indicator intended solely for the Boom and Crash indices of the Deriv Limited market It supports Boom 500, Boom 1000, Crash 500 and Crash 1000 Not repaint and no bug The settings are intuitive and easy to use The product activation number is 20 The Time Frame used depends on the user If you are an aggressive scalper then just use M1 For long trades use M15 If you are conservative use M5 Please contact me for more details of its use
Tomamos 5 medios móviles las unimos en una la cual suavizamos y volvemos a suavizar, resultando un mega suavizador de medios móviles suavizadas. Indicador de mql5 funciona en cualquier broker y para todos los tiempos, siendo el mas optimo el de 5, 15 a mas. Funciona mejor en grupo consigo misma osea poner uno de 14 y otro de 50 y 400,, así se observa mejor su desempeño.
AIS MT5 INDICATOR 5 ALL INCLLUSIVE SET GUIDE CHAPTER 1  IMPORTANT INFORMATION <1> THIS INDICATOR IS ONE OF THE SERIES OF NEW AIS INDICATORS AIS MT5 INDICATOR 1 =ADVANCED CLASSIC= AIS MT5 INDICATOR 2 =MULTIFRAMES= AIS MT5 INDICATOR 3 =LINES= AIS MT5 INDICATOR 4 =MARKET PROFILES= AIS MT5 INDICATOR 5 =ALL INCLUSIVE SET CHAPTER 2 GENERAL FEATURES OF THE SERIES <1> AIS MT5 INDICATOR 1 =ADVANCED CLASSIC= < DEVELOPMENT PAUSED >     DISPLAYS MAIN TIME POINTS AND PRICE LEVELS OF THE CHART      SUCH
The Recuroid indicator shows very good entry points. Just look at the screenshots, then download the free version and look in the strategy tester and see for yourself. The system is based on two key algorithms. The first algorithm (managed) creates a system of balanced transition from the buy zone to the sell zone and vice versa, draws arrows and lines, and forms entries. The second algorithm (managing) corrects the initial data for the first algorithm (managed) by measuring virtual windows, t
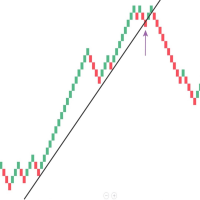
Mean Renko Bars are used for alternate price charting. Unlike the usual time framed chart – where every candle represents a fixed time interval – the goal of Renko chart is to display price movement in increments, called bricks.  Best with the momentum strategies. Can make some Algo with this candel ---- ---- ---- ---- ---- ---- ---- ---- ---- ---- Support: primecapitalvn@ gmail. com
作者のその他のプロダクト
IA Trendx3 PRO
Marco Aurelio Santos Costa
What if God Created a Trade System? No miracles... Just see how mathematics can be effective in the market. We managed to combine technical analysis / price action into indicators, creating the best setup for trading, be it in Forex, Indices, or stocks. It took us 2 years to create something that really works, and now it's time for you to discover it. TrendX3 is a revolution in trend analysis. Based on advanced algorithms and real-time data, it provides valuable insights so that you can make inf
PAX3 Price Action Indicator
Marco Aurelio Santos Costa
5 (5)
You probably won't see the power of the indicator in the backtest, because it uses 3 windows, something you can't do, in the DEMO version that the site offers.  I trust 100% on my work and on my indicator, if you want a test version, send me a message, different from other sellers, who just want to "sell", I want whether you have a full version before renting and deciding. Christmas Discount 30% off until the 25th As you can imagine, it was a failure, I'm not saying that any indicator doesn't w
Cls PRO
Marco Aurelio Santos Costa
With CLS you WILL NOT LOSE, as long as you have a professional capital management. It is impossible to make a loss with CLS, why?  It works by buying and selling two positively correlated currency pairs. This means that when PAR 1 goes up PAR 2 also goes up, however, there is something that happens in the market that is the distortion of the price ratio. That is, when the PAR 1 rises and PAR 2 falls, that's when we enter, buying Par 2 and selling Par 1.  This seems simple but it is not, you
In a simple and practical way, you can better manage your trades by choosing the number of lots you want to close directly at market. This feature helps reduce your risk exposure and make partial sales, protecting profits and balancing your position with more control. With just one button, simply choose the number of lots. Select the order you want to close. Done, your risk is reduced!
フィルタ:
レビューなし
レビューに返信