• 概要
  • レビュー (19)
  • コメント (5)
  • 最新情報

Pip Value and Spread on Chart

4.93

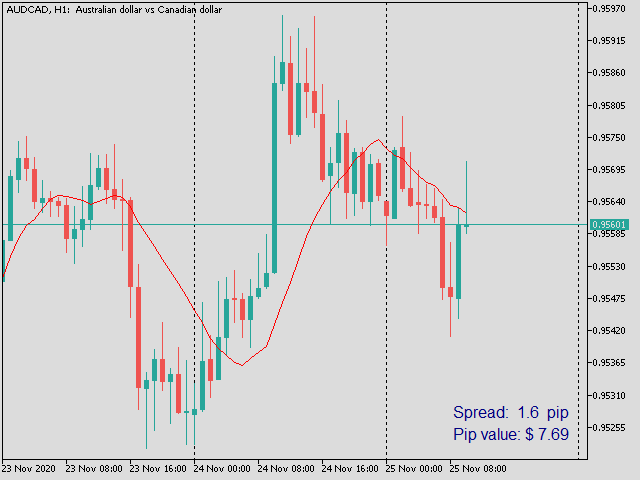
Show Pip Value and Spread on Chart as Object or Comment.

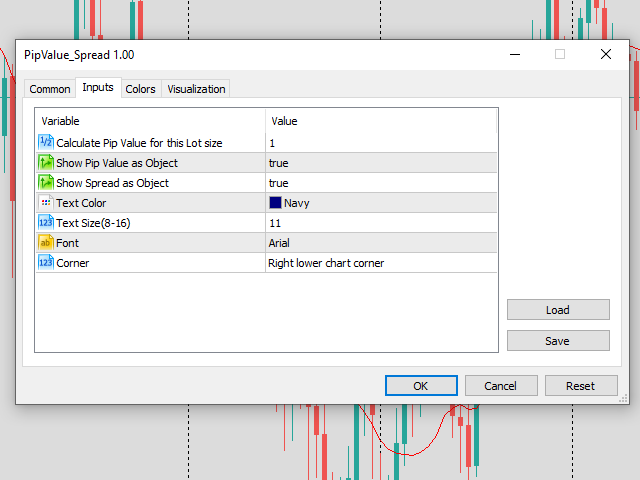
User can select to display Pip Value and/or Spread by object on main Chart, or show both only as Comment lines on chart.

Object Color, Font face and Size  and also which corner to show, may change by user. 

Pip Value calculated in accordance of input Lot size , Default is 1 lot .

Can use at all currency pairs , Gold , Silver and most other charts.


レビュー 19
joseverasay
134
joseverasay 2023.05.10 04:45 
 

excelente, gracias

BlackArmor
213
BlackArmor 2023.03.28 03:47 
 

Excellent. Simple and clean indicator. Thank you!

Jason Minds
48
Jason Minds 2022.11.09 14:50 
 

Super! Thank you!

おすすめのプロダクト
The indicator shows the current spread of the symbol, the minimum, average and maximum values for the current bar in the form of digital, analog and graphic indicators. Has two modes of operation: fixing the system spread, or calculating the spread as the difference between the "Bid" and "Ask" prices on each incoming tick. Parameters  The indicator has a single input parameter: Type of calculation  - type of spread calculation. It can take the following values:  System spread  - the spread value
FREE
This indicator uses the chart information and your inputs to display a calculated lot size and associated stop for long or short positions. It uses an ATR based percent volatility position sizing calculation and splits your account equity into two parts, each having its own risk percentage. The concept behind "Market's Money" is using a lower risk percentage for your base account equity and then using a higher risk percentage for any equity above your base equity. This lets you potentially grow
FREE
INFOPadはMetaTrader 5ターミナルで選択された通貨ペアに関する情報を作成する情報パネルです。 この指標には5つの機能があります。 選択したシンボルの主および主な情報を表示します。売値、スプレッド、ストップレベル、スワップ、ティック値、コミッション価格。 SL目標とTP目標(確立されたストップロスとテイクプロフィットのポイント数、ドル額)の将来の目標を示します。 今日、週、月、年、選択した通貨の総利益などの期間に受け取った利益が表示されます。 それは現在のオープンポジション、そのロット(ボリューム)、ポジション数、ポイントでのポジションの利益、ドル、パーセントを表示します。 オープンディールのチャートに追加情報を表示します。それはストップロスを示し、利益レベルとこれらのストップレベルの目標を取ります。 トランザクションがシンボルに対して開かれたとき、トランザクションが閉じられたとき、トランザクションが変更されたときに、ログファイルに情報を書き込みます。 取引の開始時、取引の終了時、取引の変更時にサウンドファイルを再生します。 トランザクションを開くとき、トランザクション
FREE
Vip Gold
Ignacio Agustin Mene Franco
VIP Gold It has the last indicator of the session Gold of the 4! It works in all temporalities. It is an indicator where it marks blocks of structures. the rebounds are on the red line up, and the green line down depending on which pair you use it, It is made for synthetic indices, crash and boom pairs It works as support and resistance also to better find the floor and ceiling of each pair.
40 USD
マトリックスアローインジケーターマルチタイムフレームパネルMT5 は無料のアドオンであり、マトリックスアローインジケーターMT5の優れた資産です。これは、5つのユーザーがカスタマイズした時間枠と合計16の変更可能なシンボル/機器の現在のマトリックスアローインジケーターMT5信号を示しています。ユーザーは、マトリックスアローインジケーターMT5で構成される10の標準インジケーターのいずれかを有効/無効にするオプションがあります。マトリックスアローインジケーターMT5のように、10の標準インジケーター属性もすべて調整可能です。マトリックスアローインジケーターマルチタイムフレームパネルMT5には、16個の変更可能なシンボルボタンのいずれかをクリックすることで、現在のチャートを変更するオプションもあります。これにより、異なるシンボル間ではるかに高速に作業でき、取引の機会を逃すことはありません。 この無料の マトリックスアローインジケーターマルチタイムフレームパネルMT5 アドオンを使用する場合は、ここでマトリックスアローインジケーターMT5を別途購入する必要があります: https://
FREE
The indicator detects and displays М. Gartley's Butterfly pattern. The pattern is plotted by the extreme values of the ZigZag indicator (included in the resources, no need to install). After detecting the pattern, the indicator notifies of that by the pop-up window, a mobile notification and an email. The pattern and wave parameters are displayed on the screenshots. The default parameters are used for demonstration purposes only in order to increase the amount of detected patterns. Parameters
30 USD
The indicator displays the size of the spread for the current instrument on the chart. Very flexible in settings. It is possible to set the maximum value of the spread, upon exceeding which, the color of the spread label will change, and a signal will sound (if enabled in the settings). The indicator will be very convenient for people who trade on the news. You will never enter a trade with a large spread, as the indicator will notify you of this both visually and soundly. Input parameters: Aler
FREE
Indicator measures strength of each currency in your list. Main idea: It simply iterates through all combinations of pairs and adds difference between open and close in percent. Parameters: List of currencies - what currencies will be calculated (maximum is 8) Calculation type - from which data will be strength calculated Calculation data input - used as input related to calculation type Symbol suffix - used in case of suffix on symbols, e.g: when your symbols look like EURUSDm, EURUSDmicro et
FREE
Important Lines
Terence Gronowski
4.88 (24)
This indicator displays Pivot-Lines, preday high and low, preday close and the minimum and maximum of the previous hour. You just have to put this single indicator to the chart to have all these important lines, no need to setup many single indicators. Why certain lines are important Preday high and low : These are watched by traders who trade in a daily chart. Very often, if price climbs over or falls under a preday low/high there is an acceleration in buying/selling. It is a breakout out of
FREE
RSI Currencies is an indicator that is based on the RSI concept but with a totally different approach. It calculates its values calculating all RSI values of all pairs related to the same currency and making an average between them: the goal is to obtain a more solid and trustable information about what each currency are doing lowering the impact of market noise and extreme euphory on a particular pair to analyze the whole basket. It works on 28 forex majors and minor pairs related to these curr
FREE
The Analytical cover trend indicator is a revolutionary trend trading and filtering solution with all the important features of a trend tool built into one tool! The Analytical cover indicator is good for any trader, suitable for any trader for both forex and binary options. You don’t need to configure anything, everything is perfected by time and experience, it works great during a flat and in a trend. The Analytical cover trend indicator is a tool for technical analysis of financial markets
69 USD
Follow The Line MT5
Oliver Gideon Amofa Appiah
4.26 (23)
This indicator obeys the popular maxim that: "THE TREND IS YOUR FRIEND" It paints a GREEN line for BUY and also paints a RED line for SELL. (you can change the colors). It gives alarms and alerts of all kinds. IT DOES NOT REPAINT and can be used for all currency pairs and timeframes. Yes, as easy and simple as that. Even a newbie can use it to make great and reliable trades. NB: For best results, get my other premium indicators for more powerful and reliable signals. Get them here: https://www.m
FREE
Are you tired of drawing trendlines every time you're analyzing charts? Or perhaps you would like more consistency in your technical analysis. Then this is for you. This indicator will draw trend lines automatically when dropped on a chart. How it works Works similar to standard deviation channel found on mt4 and mt5. It has 2 parameters: 1. Starting Bar 2. Number of bars for calculation The   starting bar   is the bar which drawing of the trend lines will begin, while the   number of bars for c
FREE
This indicator will mirror the assets in use in another metatrader, being able to choose the timeframe and a template. This is the Metatrader 5 Client, it needs the Metatrader 4 or 5 Server versions: Metatrader 4 Mirror Chart Server:   https://www.mql5.com/en/market/product/88644 Metatrader 5 Mirror Chart Server: https://www.mql5.com/en/market/product/88652 Details of how it works in the video.
FREE
This is a usefull utility for monitoring spread and also for recording informations to a file. (Files will be placed into "Common\Files\Spread Monitor"). There is the possibility to let the indicator calculate high/low into the past thanks to downloading ticks. (It's a slow and approsimate thing! The best way to use it is to attach to a chart and let it recording spread in real time). There is also a buffer with the average of spread in latest X periods. Easy and effective.
FREE
The Penta-O is a 6-point retracement harmonacci pattern which usually precedes big market movements. Penta-O patterns can expand and repaint quite a bit. To make things easier this indicator implements a twist: it waits for a donchian breakout in the right direction before signaling the trade. The end result is an otherwise repainting indicator with a very reliable trading signal. The donchian breakout period is entered as an input. [ Installation Guide | Update Guide | Troubleshooting | FAQ | A
FREE
The indicator identifies when a divergence occurs between price and an indicator or oscillator. It identifies both regular and hidden divergences. Combined with your own rules and techniques, this indicator will allow you to create (or enhance) your own powerful system. Features Can detect divergences for the following oscillators/indicators:   MACD, OsMA, Stochastics, RSI, CCI, RVI, Awesome, ADX, ATR, OBV, Composite index, MFI and Momentum. Only one oscillator/indicator can be selected. Draws
FREE
You can download the Full version   here . Introduction: Swing Scanner   is the indicator designed to detect swings in the direction of the trend and possible reversal swings. The indicator studies several price and time vectors to track the aggregate trend direction and detects situations in which the market is oversold or overbought and ready to correct. This indicator shows Swing that is a strong hint for an excellent entry point and finds immediately with alarm and notification and also h
FREE
A professional tool for trading - the divergence indicator between the RSI and the price, which allows you to receive a signal about a trend reversal in a timely manner or catch price pullback movements (depending on the settings). The indicator settings allow you to adjust the strength of the divergence due to the angle of the RSI peaks and the percentage change in price, which makes it possible to fine-tune the signal strength. The indicator code is optimized and is tested very quickly as par
FREE
The trade cost caused by spreads is an important indicator when formulating trade profit-loss ratios. Spread costs info is particularly important for short-term traders, especially scalping traders. This tool can output the spread cost of all Forex currencies (including XAU and XAG) in the platform in different account types (USD account, EUR account, etc.). Calculation and code See articles: THE TRADE COST OF FOREX CURRENCY Part1 THE TRADE COST OF FOREX CURRENCY Part2 THE TRADE COST OF FOREX
FREE
Free automatic Fibonacci is an indicator that automatically plots a Fibonacci retracement based on the number of bars you select on the BarsToScan setting in the indicator. The Fibonacci is automatically updated in real time as new highest and lowest values appears amongst the selected bars. You can select which level values to be displayed in the indicator settings. You can also select the color of the levels thus enabling the trader to be able to attach the indicator several times with differe
FREE
CPM Extended MT5
Sergey Efimenko
4.43 (7)
このアルゴリズムは、Currency PowerMeterインジケーターのアイデアに基づいています。このバージョンでは、表示される値の数は無制限であり、そのコードはよりコンパクトで高速であり、現在のバーの値はインジケーターバッファーを介して取得できます。 インジケーターが示すもの :細いバンドと通貨の前の上の数字は過去N時間の相対力指数を示し(Nは変数「時間」のパラメーターで設定されます)、広いバンドは日次インデックスを示します。入力パラメーターで指定するこの通貨を使用する通貨ペアが多いほど(ブローカーがペアの見積もりを提供すると仮定)、インデックスの重みが大きくなります(ただし、「非メジャー」通貨またはエキゾチック通貨のペアには注意してください。全体像を歪める)。たとえば、EURUSDのみを指定した場合、ユーロの相対インデックスはこのペアのみに基づいて計算されます。EURGBPを追加すると、ユーロインデックスは2つのペアに基づいて計算され、より重み付けされた値が取得されます。 データの使用方法 :重要なニュースがない場合、インデックス値が低い/高いほど、技術的な修正またはトレンドの継
FREE
This is a free version of the indicator, the period between the vertical lines is always 30 bars. In the paid version the period can be set by user, so a configuration with many ThreePointsChannel indicators with different periods is possible. The principle of construction - on top of any number of bars set by the user, a channel is constructed with maximum and minimum lines so that the bars touch the maximum and minimum of the channel at exactly three points. The name of the indicator follows
FREE
Rainbow MT5
Jamal El Alama
4.33 (3)
Description : Rainbow MT5 is technical indicator based on Moving Average with period 34 and very easy to use. When price crosses above MA and MA changes color to green, then this is a signal to buy. When price crosses below MA and MA changes color to red, then this is a signal to sell. The Expert advisor ( Rainbow EA MT5 ) based on Rainbow MT5 indicator is now available here . MT4 version is available  here .
FREE
The indicator draws a normal chart by coloring it in colors based on prices calculated by the Heiken Ashi indicator algorithm. That is, the shape of the candles does not change. In fact, this is the same Heiken Ashi that does not distort the price chart. Then there will be a drawing of a cat, because there is nothing more to write about the indicator. .                                                       
FREE
Account Info Manager (AIM) is a utility designed to view information on the results of the work of advisors on a trading account. The utility can group orders by their magics or comments, thereby making it possible to analyze separately the results of the work of each Expert Advisor that traded on the account. Using this utility, you can view information on the number of orders opened by the advisor, percentage of winning orders, profit value, profit factor, average order size, maximum drawdown
FREE
This indicator uses the chart information and your inputs to display the lot size and associated stop for long or short positions. It uses an ATR based percent volatility position sizing calculation. You can use this indicator to learn more about a better position size calculation than a fixed lot system. The indicator adds text directly to the chart to show you the current position size calculation, the risk % input, the ATR Range input, the ATR value from the prior bar, the account equity at r
FREE
Dual RSI
Paul Conrad Carlson
Indicator alerts for Dual Relative strength index rsi. Large rsi preset at 14 is below 30 small rsi preset at 4 is below 10 for buy bullish signals . Large rsi preset are 14 is above 70 small rsi preset at 4 is above 90 for sell bearish signals . Includes mobile and terminal alerts. draws lines when alerts. This indicator can help identify extremes and then the tops or bottoms of those extremes .
FREE
What is Ichimoku? The Ichimoku is a technical indicator collection that shows support and resistance levels and momentum and trend direction. It does this by taking multiple averages and plotting them on a chart. It also uses these figures to compute a “cloud” that attempts to forecast where the price may find support or resistance in the future. The Ichimoku is composed of five lines or calculations, two of which comprise a cloud where the difference between the two lines is shaded in. The lin
FREE
The idea behind this indicator is to find all currency pairs that are over-bought or over-sold according to the RSI indicator at one go. The RSI uses the default period of 14 (this can be changed in the settings) and scans all symbols to find the RSI level you will have specified. Once currency pairs that meet the specification are found, the indicator will open those charts for you incase those charts aren't open and proceed to write the full list of currencies on the experts tab.
FREE
このプロダクトを購入した人は以下も購入しています
ICT, SMC, SMART MONEY CONCEPTS, SMART MONEY, Smart Money Concept, Support and Resistance, Trend Analysis, Price Action, Market Structure, Order Blocks, BOS/CHoCH,   Breaker Blocks ,  Momentum Shift,   Supply&Demand Zone/Order Blocks , Strong Imbalance,   HH/LL/HL/LH,    Fair Value Gap, FVG,  Premium  &   Discount   Zones, Fibonacci Retracement, OTE, Buy Side Liquidity, Sell Side Liquidity, BSL/SSL Taken, Equal Highs & Lows, MTF Dashboard, Multiple Time Frame, BigBar, HTF OB, HTF Market Structur
65 USD
これはMT5のインジケーターで、再描画なしで取引に参入するための正確なシグナルを提供します。 外国為替、暗号通貨、金属、株式、インデックスなど、あらゆる金融資産に適用できます。かなり正確な見積もりを提供し、取引を開始して終了するのに最適な時期を教えてくれます。1つのシグナルを処理しただけでインジケーターの元が取れた例の 動画 (6:22)をご覧ください。Entry PointsPro インジケーターの助けを借りたほとんどのトレーダーの最初の1週間の結果が改善しています。 Telegramグループ に登録してください。Entry Points Proインジケーターのメリットは次の通りです。 再描画のないエントリーシグナル 再描画されるインジケーターでは一度表示されたシグナルが削除されて大きな金銭的損失につながることがありますが、これと異なり、表示されて確認されたシグナルは消えることがありません。 エラーなしの取引開始 インジケーターアルゴリズムによって取引を開始する(資産を売買する)理想的な瞬間を見つけることができます。それを使用するすべてのトレーダーの成功率が向上します。
125 USD
Gold Stuff mt5
Vasiliy Strukov
4.97 (106)
Gold Stuff mt5 は、金専用に設計されたトレンド指標であり、あらゆる金融商品にも使用できます。 インジケーターは再描画せず、遅れません。 推奨時間枠 H1. 設定と個人的なボーナスを得るために、購入後すぐに私に連絡してください!   設定 矢印を描く - オンオフ。 チャートに矢印を描く。 アラート - 可聴アラートのオンオフ。 メール通知 - オンオフ。 電子メール通知。 プチ通知 - オンオフ。 プッシュ通知。 次に、色域を調整します。 Gold Stuff mt5 は、金専用に設計されたトレンド指標であり、あらゆる金融商品にも使用できます。 インジケーターは再描画せず、遅れません。 推奨時間枠 H1. 設定と個人的なボーナスを得るために、購入後すぐに私に連絡してください!   設定 矢印を描く - オンオフ。 チャートに矢印を描く。 アラート - 可聴アラートのオンオフ。 メール通知 - オンオフ。 電子メール通知。 プチ通知 - オンオフ。 プッシュ通知。 次に、色域を調整します。
30 USD
1 つのシステムでのトレンド レベルとブレイクダウン レベルの組み合わせ。高度なインジケーター アルゴリズムは、市場のノイズをフィルター処理し、トレンド、エントリー ポイント、および可能なエグジット レベルを決定します。インジケーターシグナルは統計モジュールに記録されるため、最適なツールを選択してシグナル履歴の有効性を示すことができます。この指標は、テイクプロフィットとストップロスのマークを計算します。 マニュアルと説明書 ->   ここ / MT4 バージョン ->   ここ インジケーターで取引する方法: Trend Predictor での取引は、たった 3 つの簡単なステップです。 ステップ 1 - ポジションを開く 70% 以上の成功率で買いシグナルが受信されました ステップ 2 - ストップロスの決定 逆信号でトランクを選択 ステップ 3 - テイクプロフィット戦略の定義 戦略 1: TP1 に到達したらポジション全体をクローズする 戦略 2: TP1 に達した時点でポジションの 50% をクローズし、TP2 に達した時点で残りの 50% をクローズします。 戦略 3:
55 USD
トレンドインジケーター、1つのツールに組み込まれたすべての重要なトレンド機能を備えたトレンドトレーディングとフィルタリングのための画期的なユニークなソリューション! これは、すべてのシンボル/商品(外国為替、商品、暗号通貨、インデックス、株式)で使用できる100%再描画されていないマルチタイムフレームおよびマルチ通貨インジケーターです。 トレンドスクリーナーは、チャート内のドットで矢印トレンドシグナルを提供するインジケーターに続く効率的なインジケーターです。 トレンド分析インジケーターで使用できる機能: 1.トレンドスキャナー。 2.最大利益分析を備えたトレンドライン。 3.トレンド通貨強度メーター。 4.アラート付きのトレンド反転ドット。 5.アラート付きの強いトレンドドット。 6.トレンド矢印 毎日の分析例、毎日のシグナルパフォーマンス...など、トレンドスクリーナーインジケーターを使用して、ここで見つけることができます: ここをクリックしてください トレンドスクリーナーMT4バージョンはこちらから入手できます: https://www.mql5.com/en/market/pro
50 USD
ブレーカートレーダーになり、価格が反転すると市場構造からの利益が変化します。 注文ブロックブレーカーインジケーターは、トレンドまたは価格の動きが枯渇に近づいており、逆転の準備ができていることを識別します。通常、反転または大規模なプルバックが発生しようとしているときに発生する市場構造の変化について警告します。 この指標は、ブレイクアウトと価格の勢いを識別する独自の計算を使用します。使い果たされる可能性のあるポイントの近くで新しい高値が形成されるたびに、インディケーターはその高値の作成を担当する最後の注文ブロックを描きます。次に、移動する価格とともに注文ブロックを追跡します。その後、価格が反対方向にシフトし、その注文ブロックを突破すると、新しい市場構造を作成し、トレンドまたは大きな後退の可能性のある反転の開始を警告します。 注文ブロックは、高値/安値が作成される前の最後の反対色のろうそくであり、価格がこれらの重要な領域を下抜けすると、トレンドの短期的ま​​たは長期的な反転の兆候です。 特徴 重要な枯渇点での市場構造の変化を警告します 価格が使い果たされるレベルに近づくと、
49 USD
Matrix Arrow Indicator MT5
Juvenille Emperor Limited
5 (11)
マトリックスアローインジケーターMT5は、すべてのシンボル/商品(外国為替、商品、暗号通貨、インデックス、株式)で使用できる100%再描画されていないマルチタイムフレームインジケーターに続くユニークな10in1トレンドです。マトリックスアローインジケーターMT5は、初期段階で現在のトレンドを判断し、最大10の標準インジケーターから情報とデータを収集します。 平均方向移動指数(ADX) 商品チャネルインデックス(CCI) クラシック平研アシキャンドル 移動平均 移動平均収束発散(MACD) 相対活力指数(RVI) 相対力指数(RSI) 放物線SAR ストキャスティクス ウィリアムズのパーセント範囲 すべてのインジケーターが有効な買いまたは売りシグナルを与えると、対応する矢印がチャートに印刷され、次のろうそく/バーの開始時に強い上昇トレンド/下降トレンドを示します。ユーザーは、使用するインジケーターを選択し、各インジケーターのパラメーターを個別に調整できます。マトリックスアローインジケーターMT5は選択されたインディケーターからのみ情報を収集し、それらのデータのみに基づいてアローを印
75 USD
インジケーターガイド  |  Owl Smart Levels戦略   |   MT4版  |  インストールする方法?   |   FAQ Owl Smart Levels Indicator は、 Bill Williams の高度なフラクタル、市場の正しい波構造を構築する Valable ZigZag、エントリの正確なレベルをマークする Fibonacci レベルなどの一般的な市場分析ツールを含む 1 つのインジケーター内の完全な取引システムです。 利益を得るために市場と場所に。 取引システムの詳細な説明については、 Owl Trend Strategy - Smart Levels の記事を参照してください  力はシンプルさにあります! Owl Smart Levels 取引システムは非常に使いやすいので、専門家にも、市場を勉強し始めて自分で取引戦略を選択し始めたばかりの人にも適しています。 戦略と指標に秘密の数式や計算方法が隠されているわけではなく、すべての戦略指標は公開されています。 Owl Smart Levels を使用すると、取引を開始するためのシグナルをすばやく
97 USD
TPA True Price Action indicator reveals the true price action of the market makers through 100% non-repainting signals strictly at the close of a candle! TPA shows entries and re-entries, every time the bulls are definitely stronger than the bears and vice versa. Not to confuse with red/green candles. The shift of power gets confirmed at the earliest stage and is ONE exit strategy of several. There are available now two free parts of the TPA User Guide for our customers. The first "The Basics"
168 USD
Supply Demand uses previous price action to identify potential imbalances between buyers and sellers. The key is to identify the better odds zones, not just the untouched ones. Blahtech Supply Demand indicator delivers functionality previously unavailable on any trading platform. This 4-in-1 indicator not only highlights the higher probability zones using a multi-criteria strength engine, but also combines it with multi-timeframe trend analysis, previously confirmed swings and engulfing detecto
99 USD
Market Profile defines a number of day types that can help the trader to determine market behaviour. A key feature is the Value Area, representing the range of price action where 70% of trading took place. Understanding the Value Area can give traders valuable insight into market direction and establish the higher odds trade. It is an excellent addition to any system you may be using. Blahtech Limited presents their Market Profile indicator for the MetaTrader community. Inspired by Jim Dalton’s
99 USD
Blahtech VWAP - Volume Weighted Average Price (VWAP) is the ratio of price to total volume. It provides an average price over a specified time interval.  Links [  Install  |  Update  |  Documentation   ] Feature Highlights Configurable VWAP Line Sessions, intervals, anchored or continuous Previous day settlement line Standard Deviation bands Alerts at bar close or real time Automatic Broker or Tick volumes Significantly reduced CPU usage Input Parameters Max Bars   - Restrict the number of
49 USD
The best smart money concepts indicator ever created, now available for Metatrader. The indicator displays the main market structures, including: Higher highs and lows (HH, HL) Lower highs and lowes (LH, LL) Equal highs and lows (EQH, EQL) Order blocks (OB) Fair value gaps (FVG) Break of structures (BoS) Change of character (CHoCH) Prior day, week and month highs and lowes (PDH, PDL, PWH, ...) Premium and Discount zones With a lot of parameters the users can customize the swing length and the st
30 USD
XQ Indicator MT5
Marzena Maria Szmit
5 (1)
The signal conditions are a combination of three indicators, and XQ Forex Indicators only display  medium and long-term trends . The indicator's efficacy has been improved with the addition of a filter that blocks out false signals. The XQ Forex Indicator can be used on  FX pairs, CFDs, and Cryptocurrencies . There are two type of signals:  Buy or Sell and Big Long or Big Short It is possible to enable sending emails when a major trend-change signal is detected, as well as to display the alerts
179 USD
現在33%オフ 初心者にもエキスパートトレーダーにも最適なソリューション このインジケーターは独自の機能と新しい公式を多数内蔵しており、ユニークで高品質かつ手頃な取引ツールです。このアップデートでは、2つの時間枠ゾーンを表示できるようになります。より長いTFだけでなく、チャートTFとより長いTF(ネストゾーンを表示)の両方を表示できます。すべてのSupply Demandトレーダーの皆さんのお気に召すはずです。:) 重要情報の公開 Advanced Supply Demandの可能性を最大化するには、 https://www.mql5.com/ja/blogs/post/720245 にアクセスしてください。   エントリーまたはターゲットの正確なトリガーポイントを正確に特定できれば取引がどのように改善されるか想像してみてください。新しい基盤となるアルゴリズムに基づいて構築されているため、買い手と売り手の間の潜在的な不均衡をさらに簡単に特定できます。これは、最も強い需要と供給のゾーンと、過去のパフォーマンス(古いゾーンを表示)がグラフィカルに表現されるためです。これらの機能は、最適
199 USD
サポートと抵抗のレベルは、長い間、市場分析のための強力なツールとなっています。 強力なサポート指標は、現地価格の最小値に基づいてサポートレベルをプロットし、現地価格の最大値に基づいて抵抗レベルをプロットします。 私の他の開発はここで見ることができます これは、トレンドに応じて取引し、同時に統合またはトレンド反転のゾーンを決定し、ストップロスを設定し、サポートと抵抗レベルで利益を取ることがで 設定と個人的なボーナスを受け取るために購入後すぐに私に連絡してください! 受信パラメータ - インジケータは複雑な設定を必要とせず、主なパラメータはカラースケールの調整です。 サポートと抵抗のレベルは、長い間、市場分析のための強力なツールとなっています。 強力なサポート指標は、現地価格の最小値に基づいてサポートレベルをプロットし、現地価格の最大値に基づいて抵抗レベルをプロットします。 私の他の開発はここで見ることができます これは、トレンドに応じて取引し、同時に統合またはトレンド反転のゾーンを決定し、ストップロスを設定し、サポートと抵抗レベルで利益を取ることがで
30 USD
MetaBands M5
Vahidreza Heidar Gholami
5 (2)
MetaBandsは、強力でユニークなアルゴリズムを使用してチャンネルを描画し、トレンドを検出して、トレーダーに取引の入出ポイントを提供することができます。チャンネル指標に加えて、強力なトレンド指標でもあります。入力パラメータを使用して新しいチャンネルを作成するために、異なるタイプのチャンネルを統合することができます。MetaBandsは、市場のイベントについてユーザーに通知するために、すべてのタイプのアラートを使用します。 特徴 ほとんどのチャンネルアルゴリズムをサポート 強力なトレンド検出アルゴリズム 異なるタイプのチャンネルを統合する能力 マルチタイムフレームおよびマルチカレンシー(シグナルマトリックス) すべてのタイプのアラート機能(サウンド、画面フラッシャー、プッシュ通知、メール、ポップアップ、矢印) 再描画しない トレンド検出 MetaBandsは、チャネル内を振動する青いラインを使用してトレンドを検出します。ラインがチャネルの上部バンドに達すると、下降トレンドの開始を示し、下部バンドに達すると上昇トレンドの開始を示します。青いラインが中心ラインに近づくと、市場はコンソ
129 USD
トレンドラインマップインジケーターは、トレンドスクリーナーインジケーターのアドオンです。トレンドスクリーナー(トレンドラインシグナル)によって生成されたすべてのシグナルのスキャナーとして機能します。 これは、トレンドスクリーナーインジケーターに基づくトレンドラインスキャナーです。 Trend Screener Pro インジケーターがない場合、Trend Line Map Proは機能しません。 It's a Trend Line Scanner based on Trend Screener Indicator. If you don't have Trend Screener Pro Indicator,     the Trend Line Map Pro will not work . ブログにアクセスすると、トレンドラインマップインジケーターの無料バージョンをダウンロードできます。 Metatrader Testerの制限なしで、購入する前に試してみてください。 :  ここをクリック 1.簡単になる利点 通貨と時間枠に基づいて売買シグナルを表示し
50 USD
Auto Order Block with break of structure Detect Break of Structure , Mark Order Block and draw Entry / Stop and Risk to Reward lines when Order block is touch by price with Alert. Trend is Manually set to filter signals in a direction by a button on the chart. Entry / Stop and Risk to Reward lines can also be switch on / off by button on chart. Futures Auto Mark Break of Structure Auto Mark Order block Auto Mark higher time frame Point Of  Interest ( POI ) Popup Alert when BoS , Order block
55 USD
Introduction to X3 Chart Pattern Scanner X3 Cherart Pattern Scanner is the non-repainting and non-lagging indicator detecting X3 chart patterns including Harmonic pattern, Elliott Wave pattern, X3 patterns, and Japanese Candlestick patterns. Historical patterns match with signal patterns. Hence, you can readily develop the solid trading strategy in your chart. More importantly, this superb pattern scanner can detect the optimal pattern of its kind. In addition, you can switch on and off individu
250 USD
BUY INDICATOR AND GET EA FOR FREE AS A BONUS + SOME OTHER GIFTS! ITALO VOLUME INDICATOR  is the best volume indicator ever created, and why is that? The Indicator works on all time-frames and assets, indicator built after 6 years of experience on forex and many other markets. You know many volume indicators around the internet are not complete, does not help, and it's difficult to trade, but the Italo Volume Indicator is different , the Italo Volume Indicator shows the wave volume, when market
65 USD
**   All Symbols   x   All Timeframes   scan just by pressing scanner button ** *** Contact me immediately after the purchase to send you instructions and add you in "Market Structure group" for sharing or seeing experiences with other users. CURRENT PRICE $39..... Future Price $200 Introduction: Market structure is important for both new and professional traders since it can influence the liquidity and price action of a market. It’s also one of the most commonly used techniques to understand tr
39 USD
Introduction to EFW Analytics EFW Analytics was designed to accomplish the statement "We trade because there are regularities in the financial market". EFW Analytics is a set of tools designed to maximize your trading performance by capturing the repeating fractal geometry, known as the fifth regularity in the financial market. The functionality of EFW Analytics consists of three parts. Firstly, Equilibrium Fractal Wave Index is an exploratory tool to support your trading logic to choose which r
200 USD
支持線と抵抗線、そしてローソク足のギャップをチャート上に自動的に表示するため、価格が次に向かう可能性のある場所や反転する可能性のある場所を確認することができます。 このインジケーターは、私のウェブサイト(The Market Structure Trader)で教えているポジショントレード手法の一部として使用するように設計されており、ターゲットとエントリーの可能性のための重要な情報を表示します。 MT4 Version:  https://www.mql5.com/en/market/product/97246/ このインジケーターには、2つのコア機能と4つの追加機能があります: コア機能1 - 日足、週足、月足のサポートラインとレジスタンスラインの自動表示 このインジケーターは、直近2日間、最大6週間前、数ヶ月前のサポートレベルとレジスタンスレベルを自動的に引き込みます。これらのレベルの見た目は完全にカスタマイズすることができ、いくつ表示されるかを表示することもできます。これらの重要な水準は、しばしば主要な支持線と抵抗線として機能し、価格が転換して引き戻されたり反転したりする場
49 USD
FX Volume MT5
Daniel Stein
4.77 (13)
スマートマネーを追うことがついに可能に FX Volumeは、ブローカーの視点から市場のセンチメントをリアルに洞察する、最初で唯一のボリューム指標です。 ブローカーのような機関投資家がFX市場でどのようなポジションをとっているか、COTレポートよりはるかに速く、素晴らしい洞察を提供します。 この情報をチャート上で直接見ることは、あなたの取引にとって真のゲームチェンジャーであり、画期的な解決策です。 基本チュートリアル → "FX出来高を使った取引方法" をお読みください。 よくある質問、取引のヒント、チュートリアルビデオなど、より多くの情報を私たちの FX Volume情報公開チャンネル SI Connectをインストールして実行 し、弊社データセンターへの常時接続を確立してください。 背景情報 私たちは皆、FXが分散型市場であることを知っています。そのため、私たちは既成概念にとらわれず、ユニークなソリューションを開発し、この貴重な情報を私たちのチャートに取り込むために、これまでで最も複雑なプロジェクトをコード化する必要がありました。2018年10月以来、私たち
33 USD
サポートとレジスタンススクリーナーは、1つのインジケーター内に複数のツールを提供するMetaTraderの1つのレベルインジケーターにあります。 利用可能なツールは次のとおりです。 1.市場構造スクリーナー。 2.強気のプルバックゾーン。 3.弱気プルバックゾーン。 4.デイリーピボットポイント 5.毎週のピボットポイント 6.毎月のピボットポイント 7.ハーモニックパターンとボリュームに基づく強力なサポートとレジスタンス。 8.銀行レベルのゾーン。 期間限定オファー:HVサポートおよびレジスタンスインジケーターは、50ドルと生涯でのみご利用いただけます。 (元の価格125 $) MQL5ブログにアクセスすると、分析例を含むすべてのプレミアム指標を見つけることができます。 ここをクリックしてください。 主な機能 ハーモニックおよびボリュームアルゴリズムに基づく強力なサポートおよびレジスタンスゾーン。 ハーモニックおよびボリュームアルゴリズムに基づく強気および弱気のプルバックゾーン。  市場構造スクリーナー 毎日、毎週、毎月のピボットポイント。 ドキュメント すべてのサ
50 USD
Forex Master Pattern
Alberto Gauer Borrego
4.8 (10)
The Forex Master Pattern  is an alternative form of technical analysis that provides a framework which will help you to find and follow the hidden price pattern that reveals the true intentions of financial markets. This algorithm here does a good job detecting the Phase 1 of the Forex Master Pattern cycle, which is the contraction point (or Value).  On Phase 2 we get higher timeframe activation (also called Expansion), which is where price oscillates above and below the average price defined
49 USD
Buy and sell signals based on Larry Williams's exponential moving average strategies 9.1, 9.2, 9.3 and 9.4 for trend reversals and continuations. To understand the logic and how to trade the signals, please check: Setup 9.1:  https://www.mql5.com/pt/market/product/50986 Setup 9.2:  https://www.mql5.com/pt/market/product/52268 Setup 9.3:  https://www.mql5.com/pt/market/product/52269 Setup 9.4:  https://www.mql5.com/pt/market/product/52273 Notices:  - This indicator displays a lot of signals.
199 USD
Stargogs Spike Catcher V3.11 This Indicator is Developed To milk the BOOM and CRASH indices . Send me Message if you need any help with the indicator.  CHECK OUT THE STARGOGS SPIKE CATCHER EA/ROBOT V3: CLICK HERE ALSO CHECK OUT SECOND TO NONEFX SPIKE CATCHER:   CLICK HERE STARGOGS SPIKE CATCHER V3.11 WHATS NEW! Brand New Strategy. This is the Indicator you need for 2023. The Indicator Gives you an Entry at a time when conditions are met and you should use TP & SL. New Trendline that changes col
100 USD
Introduction to Fractal Pattern Scanner Fractal Indicator refers to the technical indicator that makes use of the fractal geometry found in the financial market. Fractal Pattern Scanner is the advanced Fractal Indicator that brings the latest trading technology after the extensive research and development work in the fractal geometry in the financial market. The most important feature in Fractal Pattern Scanner is the ability to measure the turning point probability as well as the trend probabil
185 USD
フィルタ:
joseverasay
134
joseverasay 2023.05.10 04:45 
 

excelente, gracias

BlackArmor
213
BlackArmor 2023.03.28 03:47 
 

Excellent. Simple and clean indicator. Thank you!

Jason Minds
48
Jason Minds 2022.11.09 14:50 
 

Super! Thank you!

RKE
615
RKE 2022.11.06 15:54 
 

Great, thank you!

frico1970tm
14
frico1970tm 2022.08.28 12:21 
 

Super idicator :)

beboo12
44
beboo12 2022.08.02 22:27 
 

its nice i liked

paddock
220
paddock 2022.07.23 00:51 
 

Excellent free indicator. Thanks to the author for sharing this simple but very helpful indicator. :)

James Wioos
402
James Wioos 2022.05.19 02:24 
 

Best Indicator, no need to guess or research what each pair is worth! Pip value and Spread are very important for my trading strategy.

fredjj
16
fredjj 2022.02.27 17:30 
 

good

mchelpmf
184
mchelpmf 2022.02.05 14:39 
 

very good, the spread has a little delay, I wanted it to be updated in real time. But it's the best!

Max0r847
146
Max0r847 2021.10.01 00:36 
 

Shows me the pip value :P

Kevin
109
Kevin 2021.09.16 04:56 
 

Works well as stated on the box ... Much appreciated thanks

El Mehdi Sabry
18
El Mehdi Sabry 2021.06.30 12:51 
 

thank you for this indicator.

Koresch156
17
Koresch156 2021.06.28 21:38 
 

Нормально!

Profit4U
66
Profit4U 2021.06.13 21:35 
 

Súper Good , i need the same for MT4

benonimonteiro
26
benonimonteiro 2021.06.03 18:39 
 

muito útil, funciona perfeitamente.

wanorbit
29
wanorbit 2021.05.01 14:50 
 

very good in stating pip value for all pairs

Bolacha
116
Bolacha 2021.03.23 19:36 
 

muito bom, funciona bem.

Aleksandr Tamonin
4080
Aleksandr Tamonin 2021.01.13 18:33 
 

Удобный информационный индикатор.

Vahid Mosaffa
6021
開発者からの返信 Vahid Mosaffa 2021.01.21 04:38
Thank you for your review
レビューに返信
バージョン 1.10 2022.11.05
Divide by Zero bug - due to lack of broker information - has been fixed.