WaSpread MT5

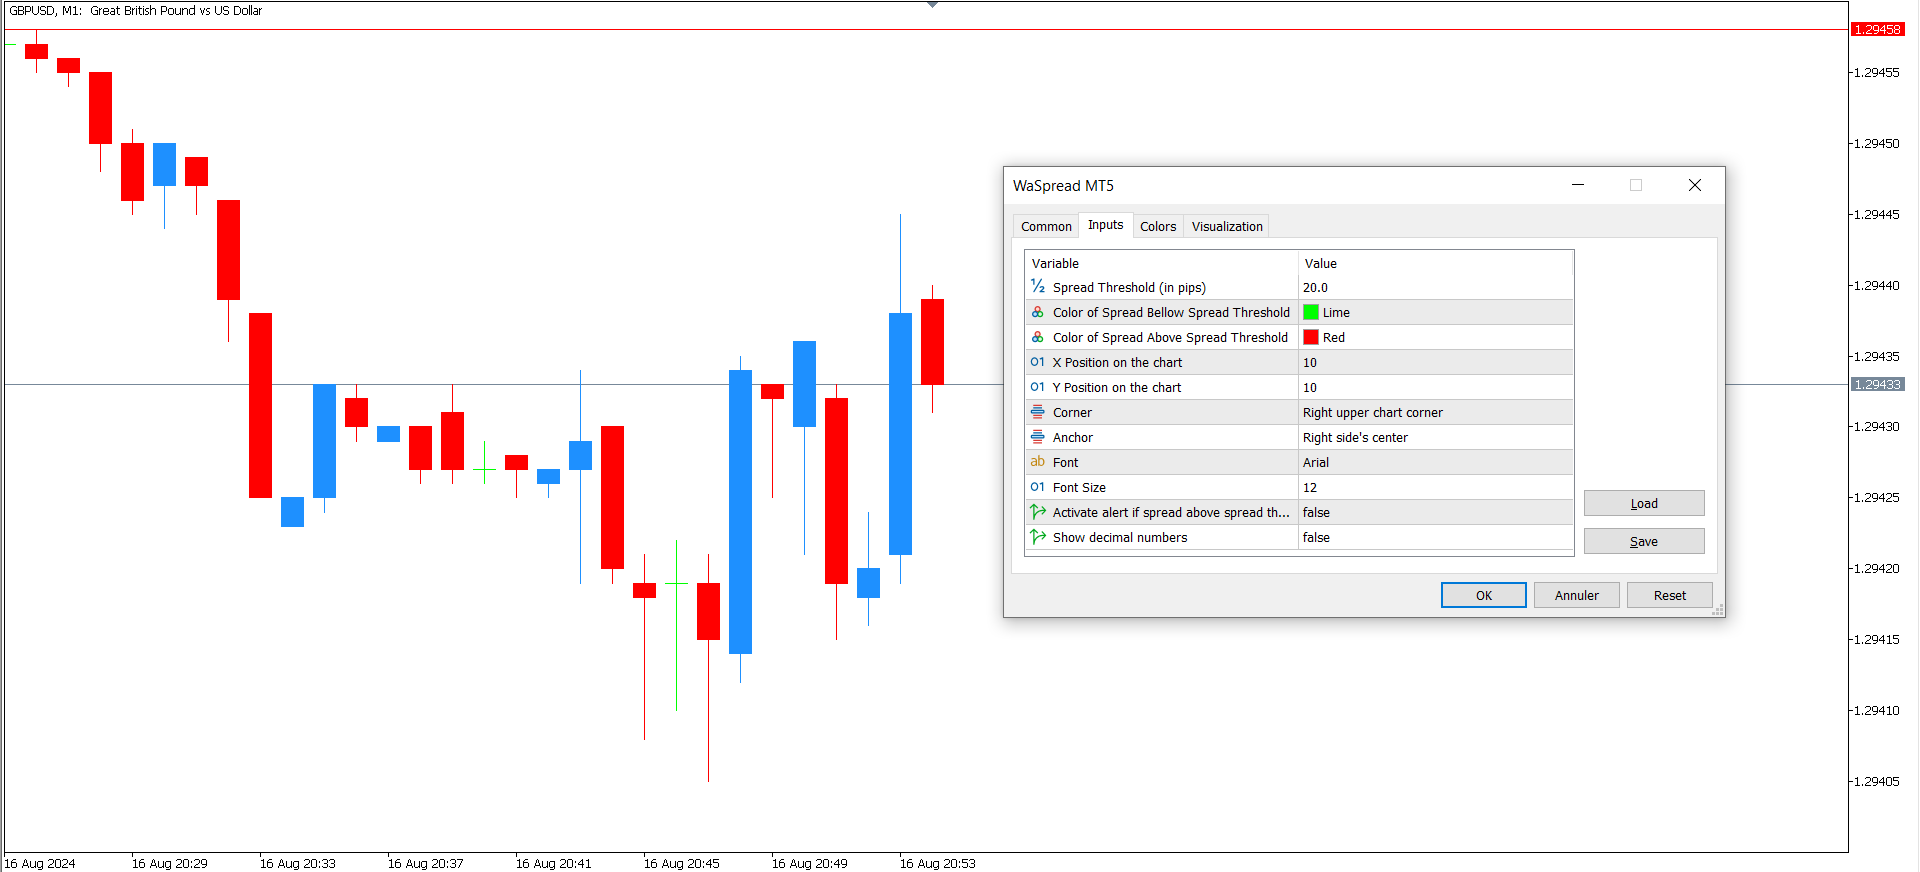
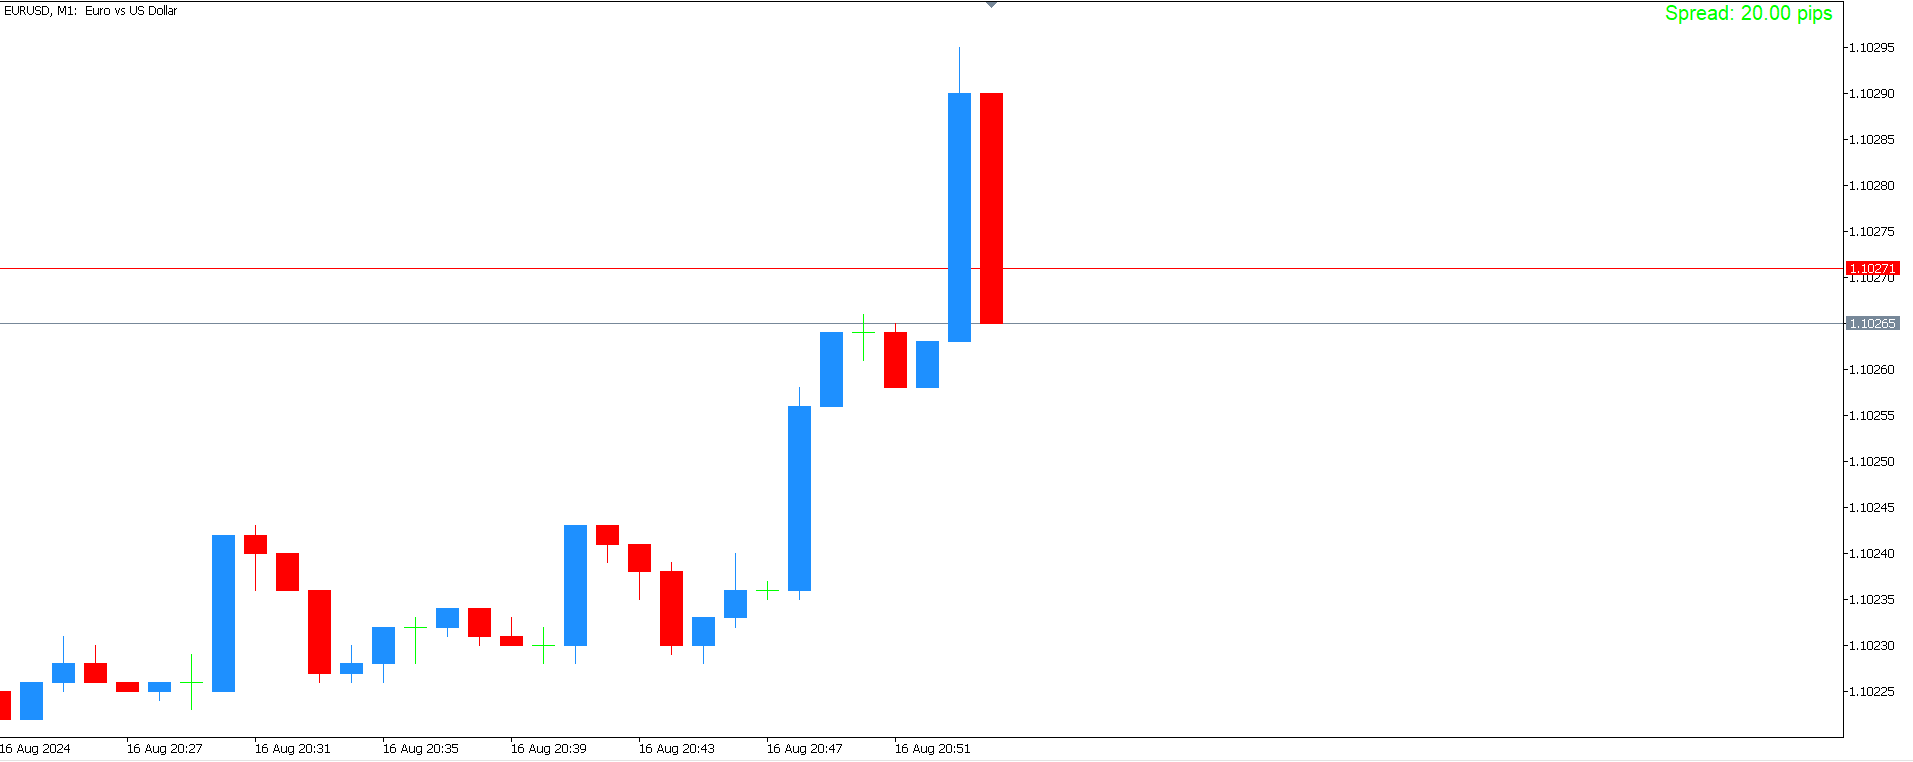
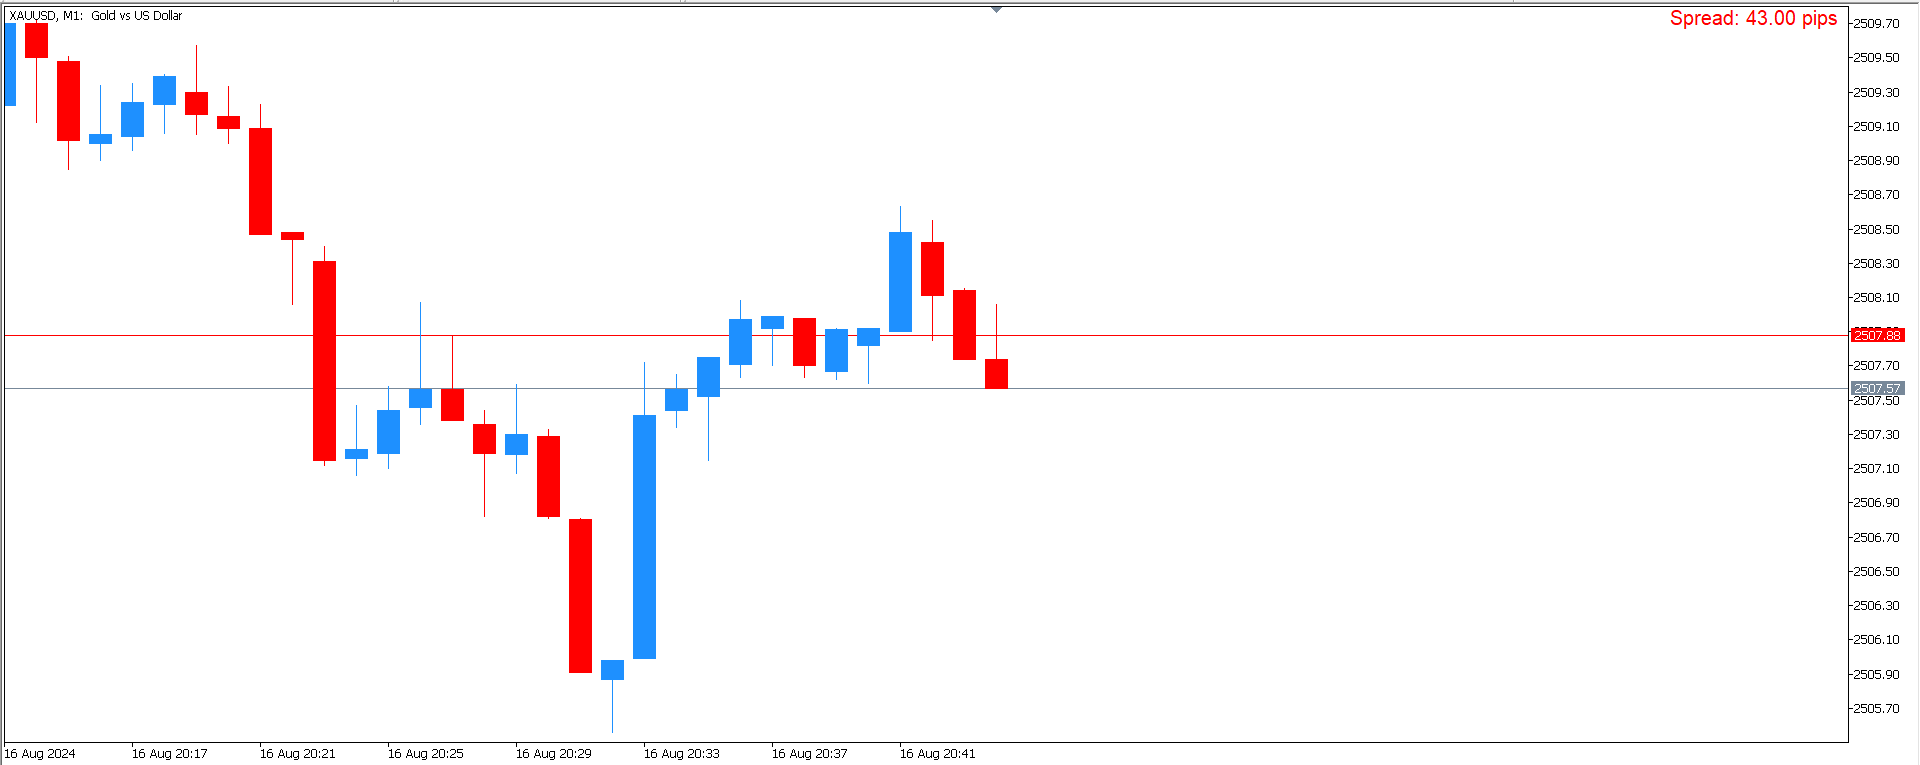
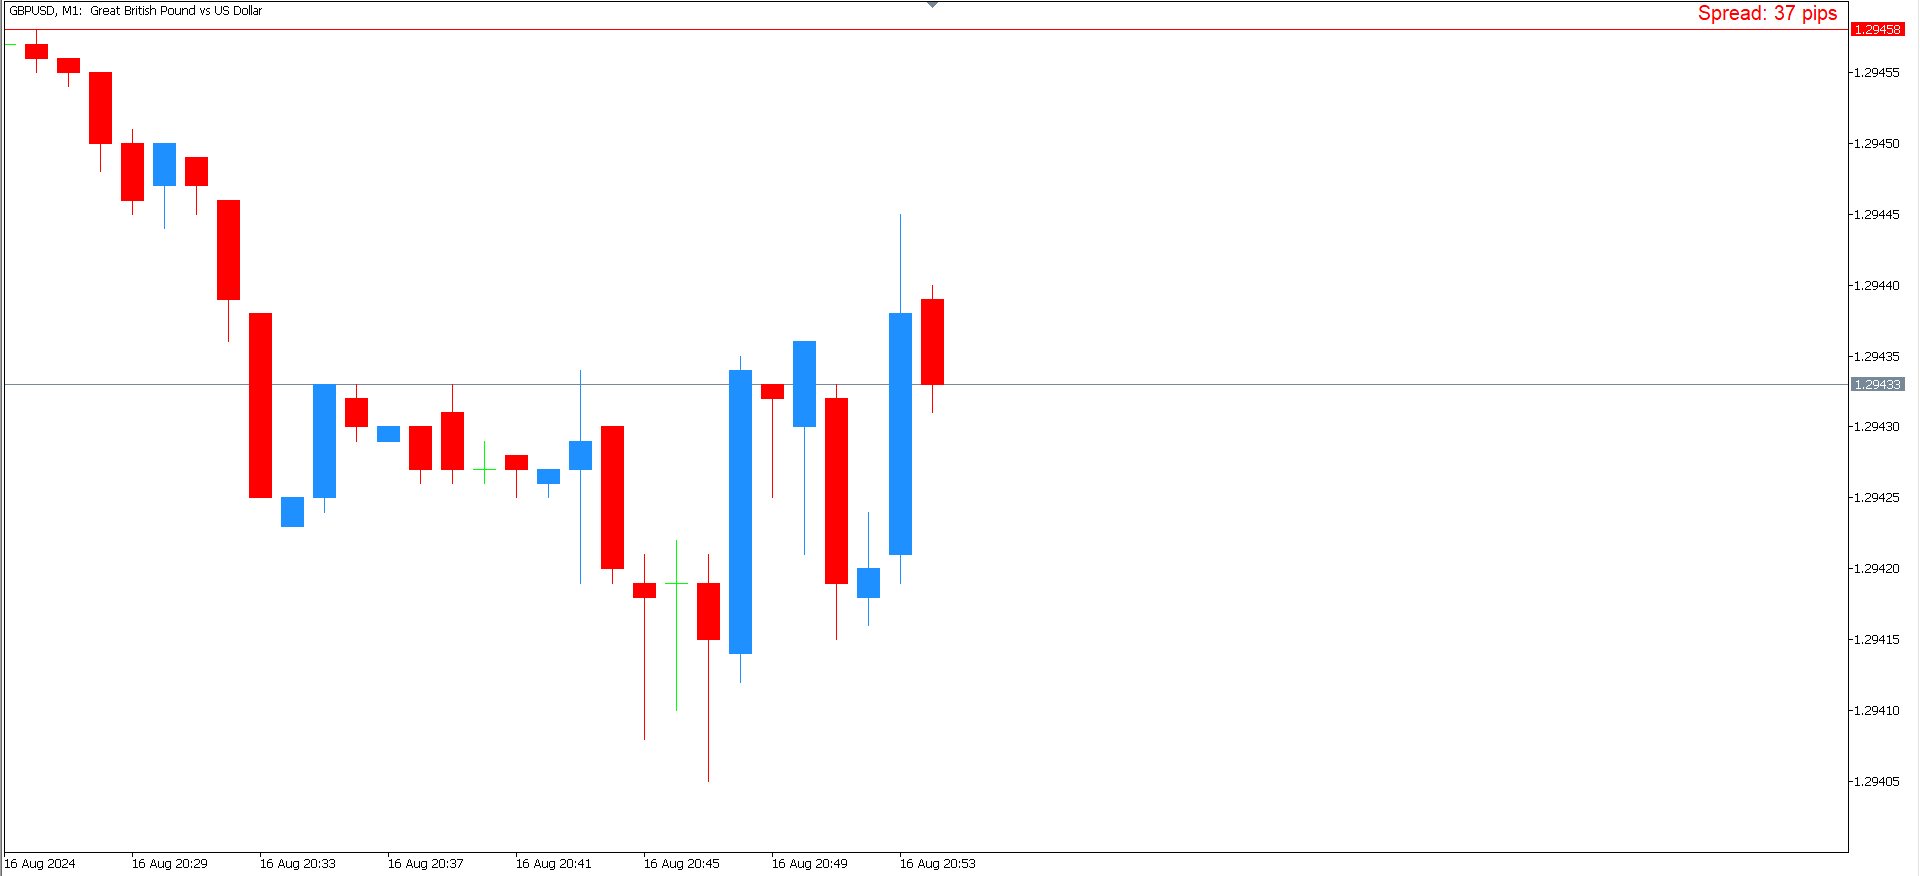
WaSpread MT5 Indicator shows the current spread in pips with color.

* Set the Spread Threshold and the color to identify when the current spread is below or above the Spread Threshold.

* Set X axis and Y axis and chose the Corner and the Anchor to position the Spread Label on the chart.

* Write the font and the font size for more confort.

* Activate alert if the current spread is above the spread threshold.

* For more precision, the user can choose to show the decimal numbers.

* The user will never enter a trade with a large spread, WaSpread MT5 Indicator will notify with the sound.

おすすめのプロダクト
The indicator shows the current spread of the symbol, the minimum, average and maximum values for the current bar in the form of digital, analog and graphic indicators. Has two modes of operation: fixing the system spread, or calculating the spread as the difference between the "Bid" and "Ask" prices on each incoming tick. Parameters  The indicator has a single input parameter: Type of calculation  - type of spread calculation. It can take the following values:  System spread  - the spread value
FREE
INFOPadはMetaTrader 5ターミナルで選択された通貨ペアに関する情報を作成する情報パネルです。 この指標には5つの機能があります。 選択したシンボルの主および主な情報を表示します。売値、スプレッド、ストップレベル、スワップ、ティック値、コミッション価格。 SL目標とTP目標(確立されたストップロスとテイクプロフィットのポイント数、ドル額)の将来の目標を示します。 今日、週、月、年、選択した通貨の総利益などの期間に受け取った利益が表示されます。 それは現在のオープンポジション、そのロット(ボリューム)、ポジション数、ポイントでのポジションの利益、ドル、パーセントを表示します。 オープンディールのチャートに追加情報を表示します。それはストップロスを示し、利益レベルとこれらのストップレベルの目標を取ります。 トランザクションがシンボルに対して開かれたとき、トランザクションが閉じられたとき、トランザクションが変更されたときに、ログファイルに情報を書き込みます。 取引の開始時、取引の終了時、取引の変更時にサウンドファイルを再生します。 トランザクションを開くとき、トランザクション
FREE
インジケーターは現在のシンボルの利益(損失)を表示します。 線を自由にドラッグ&ドロップして現在の損益を表示できます。 You can find my products   here パラメーター Calculation in money or in points — 損益をポイントまたは金額で計算します。 Add pending orders to calculate — 計算では未決注文を考慮します。 Magic Number (0 - all orders on symbol) — 特定の注文を評価する必要がある場合のマジック ナンバー。 Offset for first drawing (points from the average price) — 最初の開始時の平均価格からのラインのオフセット。 Decimal places for calculating the Sum — 合計を表示するための小数点以下の桁数。 Decimal places for calculating the Percentage — パーセンテージを表示するための小数点以下の桁数。
FREE
Magic 7 Indicator
Marek Pawel Szczesny
5 (1)
Overview Magic 7 Indicator is a comprehensive MetaTrader 5 (MQL5) indicator that identifies seven different trading scenarios based on candlestick patterns and technical analysis. The indicator combines traditional price action patterns with modern concepts like Fair Value Gaps (FVG) to provide trading signals with precise entry points and stop loss levels. Features 7 Trading Scenarios : Each scenario identifies specific market conditions and trading opportunities Visual Signals : Clear buy/sell
FREE
Time Candle with Sound Alert This indicator will be display the time left candle Features : 1. Multi Time Frames, Multi Pairs 2. Time Left 2. Position dynamic with Bid Price or Edge of Chart Screen 3. Font Size and Color 4. Display Current Spread, Maximum Spread and Minimum Spread Note: Maximum and Minimum Spread will be reset when you change TF Tested On MT5 Version 5 Build 5200 If you want the source code, just PM me
FREE
まとめ 主要なキーレベルを表示し、リスクパーセンテージとストップロス距離に基づいてポジションサイズを計算する、MetaTrader 5 用の軽量ユーティリティ。 チャートを乱雑にすることなく迅速な意思決定を望むトレーダー向けに設計されています。 特徴 • 前日の高値、安値、日次の区切り線を表示 • オプションのアジア、ロンドン、ニューヨークのセッション範囲 • リスクパーセンテージに基づいた自動ロットサイズ計算機能 • あらゆるシンボルまたはタイムフレームに対応 • 軽量で、CPU 使用率が低いように最適化されています。 • 最小限の入力ですっきりとしたオンチャートパネル 次のようなトレーダーに最適です。 • 取引流動性レベル • 構造化されたリスク管理を使用する • 手動計算を行わずに迅速にポジションを決定したい • きれいなグラフとシンプルなツールを好む 注意事項 • すべてのブローカーで動作します • MetaTrader 5用に設計 • 戦略ロジックは含まれていません - これは純粋に取引ユーティリティです
FREE
Are you tired of drawing trendlines every time you're analyzing charts? Or perhaps you would like more consistency in your technical analysis. Then this is for you. This indicator will draw trend lines automatically when dropped on a chart. How it works Works similar to standard deviation channel found on mt4 and mt5. It has 2 parameters: 1. Starting Bar 2. Number of bars for calculation The   starting bar   is the bar which drawing of the trend lines will begin, while the   number of bars for c
FREE
Main purpose:   "Pin Bars"   is designed to automatically detect pin bars on financial market charts. A pin bar is a candle with a characteristic body and a long tail, which can signal a trend reversal or correction. How it works:   The indicator analyzes each candle on the chart, determining the size of the body, tail and nose of the candle. When a pin bar corresponding to predefined parameters is detected, the indicator marks it on the chart with an up or down arrow, depending on the directi
FREE
Range Pullback Limits – Smart Buy/Sell Zone Indicator for MT5 Range Pullback Limits is a professional MT5 indicator that automatically marks potential Buy Limit and Sell Limit levels during ranging markets. It helps traders identify high-probability pullback zones and avoid trading when the market is trending strongly. *Note: Combine this indicator to filter entry points -  https://www.mql5.com/en/market/product/149443 Key Features Works on Forex, Gold (XAUUSD), Crypto, Indices, Stocks Detects r
FREE
Trading Room Indicator is a professional market-structure tool built to give traders a clear, complete trading framework — combining CPR levels, dynamic targets, and trend direction in one clean view. Instead of guessing direction or overloading the chart with indicators, Trading Room Indicator focuses on what actually matters : levels, direction, and potential price expansion. What This Indicator Provides CPR Structure BUY level SELL level Pivot Point (PP) Designed to highlight equilibrium
The indicator detects and displays М. Gartley's Butterfly pattern. The pattern is plotted by the extreme values of the ZigZag indicator (included in the resources, no need to install). After detecting the pattern, the indicator notifies of that by the pop-up window, a mobile notification and an email. The pattern and wave parameters are displayed on the screenshots. The default parameters are used for demonstration purposes only in order to increase the amount of detected patterns. Parameters z
Basic Theme Builder: チャートカスタマイズを簡単に Basic Theme Builder インジケーターで、MetaTrader 5   のチャート外観のカスタマイズをシンプルに変革しましょう。この直感的なインジケーターは、使いやすいパネルを提供し、さまざまなテーマやカラースキームを簡単に切り替えることができます。これにより、取引環境の視覚的な魅力と機能性が向上します。 Free MT4 version Basic Theme Builder インジケーターは、MetaTrader 5 のチャートを簡単にパーソナライズしたいトレーダーに最適なツールです。シンプルなパネルインターフェースとさまざまなテーマプリセットを使用して、取引スタイルや気分に合わせてチャートの外観をすぐに調整できます。クラシックなルックからモダンな美学まで、多彩なオプションを提供する Basic Theme Builder で、視覚体験を最適化しましょう。 主な機能: 簡単なテーマ管理: 便利なパネルインターフェースを使用して、ワンクリックでチャートのテーマを素早く変更できます。 定義済みのプ
FREE
The Penta-O is a 6-point retracement harmonacci pattern which usually precedes big market movements. Penta-O patterns can expand and repaint quite a bit. To make things easier this indicator implements a twist: it waits for a donchian breakout in the right direction before signaling the trade. The end result is an otherwise repainting indicator with a very reliable trading signal. The donchian breakout period is entered as an input. [ Installation Guide | Update Guide | Troubleshooting | FAQ | A
FREE
Coral trend is   a trend-following indicator that is widely popular among FOREX traders . It is usually used as a confluence with other indicators. It uses combinations of moving averages with complex smoothing formulas! It has two configurable parameters: Coefficient   - smoothing ratio (*) Applied price Calculation: Coral = (-0.064) * B6 + 0.672 * B5 - 2.352 * B4 + 2.744 * B3
FREE
Follow The Line MT5
Oliver Gideon Amofa Appiah
4.6 (35)
This indicator obeys the popular maxim that: "THE TREND IS YOUR FRIEND" It paints a GREEN line for BUY and also paints a RED line for SELL. (you can change the colors). It gives alarms and alerts of all kinds. IT DOES NOT REPAINT and can be used for all currency pairs and timeframes. Yes, as easy and simple as that. Even a newbie can use it to make great and reliable trades. NB: For best results, get my other premium indicators for more powerful and reliable signals. Get them here: https://www.m
FREE
Important Lines
Terence Gronowski
4.88 (24)
This indicator displays Pivot-Lines, preday high and low, preday close and the minimum and maximum of the previous hour. You just have to put this single indicator to the chart to have all these important lines, no need to setup many single indicators. Why certain lines are important Preday high and low : These are watched by traders who trade in a daily chart. Very often, if price climbs over or falls under a preday low/high there is an acceleration in buying/selling. It is a breakout out of a
FREE
概要 このインジケーターは、クラシックな ドンチャンチャネル を強化したバージョンで、実践的なトレード機能を追加しています。 標準の3本線(上限、下限、中央線)に加え、 ブレイクアウト を検出し、チャート上に矢印で視覚的に表示します。また、チャートを見やすくするために、 現在のトレンド方向と逆側のラインのみを表示 します。 インジケーターの機能: 視覚的シグナル :ブレイクアウト時にカラフルな矢印を表示 自動通知 :ポップアップ、プッシュ通知、Eメール RSIフィルター :市場の相対的な強弱に基づいてシグナルを検証 カスタマイズ可能 :色、ラインの太さ、矢印コード、RSI閾値など 動作原理 ドンチャンチャネルは次のように計算します: 上限線 :直近N本のクローズ済みローソク足の最高値 下限線 :直近N本のクローズ済みローソク足の最安値 中央線 :最高値と最安値の平均値 上方ブレイクアウト は終値が上限線を超えたときに発生し、 下方ブレイクアウト は終値が下限線を下回ったときに発生します。 インジケーターは以下を行います: 3本のドンチャンラインを描画 方向転換後の最初のブレイクアウト
FREE
This is a free version of the indicator, the period between the vertical lines is always 30 bars. In the paid version the period can be set by user, so a configuration with many ThreePointsChannel indicators with different periods is possible. The principle of construction - on top of any number of bars set by the user, a channel is constructed with maximum and minimum lines so that the bars touch the maximum and minimum of the channel at exactly three points. The name of the indicator follows
FREE
Description : Rainbow MT5 is a technical indicator based on Moving Average with period 34 and very easy to use. When price crosses above MA and MA changes color to green, then this is a signal to buy. When price crosses below MA and MA changes color to red, then this is a signal to sell. The Expert advisor ( Rainbow EA MT5 ) based on Rainbow MT5 indicator is now available here . MT4 version is available here .
FREE
The indicator identifies when a divergence occurs between price and an indicator or oscillator. It identifies both regular and hidden divergences. Combined with your own rules and techniques, this indicator will allow you to create (or enhance) your own powerful system. For higher probability setups I can recommend you to use my Supply Demand indicator and trade only if the divergence occurs inside a zone. Supply zone for bearish div and demand zone for bullish div. The optimal scenario is if it
FREE
Show Pip Value and Spread on Chart as Object or Comment. User can select to display Pip Value and/or Spread by object on main Chart, or show both only as Comment lines on chart. Object Color, Font face and Size  and also which corner to show, may change by user.  Pip Value calculated in accordance of input Lot size , Default is 1 lot . Can use at all currency pairs , Gold , Silver and most other charts.
FREE
The indicator displays the size of the spread for the current instrument on the chart. Very flexible in settings. It is possible to set the maximum value of the spread, upon exceeding which, the color of the spread label will change, and a signal will sound (if enabled in the settings). The indicator will be very convenient for people who trade on the news. You will never enter a trade with a large spread, as the indicator will notify you of this both visually and soundly. Input parameters: Aler
FREE
The idea of the system is to indentify the reversal patterns using the calculation of the composite candle. The reversal patterns is similar to the "Hammer" and "Hanging Man" patterns in Japanese candlestick analysis. But it uses the composite candle instead the single candle and doesn't need the small body of the composite candle to confirm the reversal. Input parameters: Range - maximal number of bars, used in the calculation of the composite candle. Minimum - minimal size of the composite can
FREE
平均足(ヘイキンアシ)MT5インジケーター 平均足(ヘイキンアシ)MT5インジケーターは、標準的な価格データをより滑らかでトレンドに沿ったローソク足に変換し、市場トレンドや潜在的な反転ポイントをより簡単に識別できるようにする強力なツールです。 主な特徴: 明確なトレンド識別: 異なるローソク足の色で上昇トレンドと下降トレンドを視覚的に区別します。 ノイズの低減: 価格変動をフィルタリングし、 市場の主要な動きをより明確に表示します。 早期トレンド検出: 標準チャートでトレンドの変化が明らかになる前に、 潜在的なトレンド変化を予測します。 汎用性: 単独で使用することも、 他のテクニカル指標と組み合わせて総合的な分析を行うこともできます。 カスタマイズ可能な設定: インジケーターを特定の取引設定や戦略に合わせて調整できます。 メリット: トレンドを特定し、 潜在的なエントリーポイントと出口ポイントを識別する能力を向上させます。 市場ノイズの影響を減らし、 重要な価格変動に集中します。 市場ダイナミクスをより明確に理解することで、 より情報に基づいた取引決定を行うことができます。 検証済
FREE
TradeQL
Abdiel Aviles Jimenez
The TradeQL Indicator is a customizable tool that highlights specific trading patterns on candlestick charts. Users can define patterns through TradeQL queries, which the indicator then applies to the chart, visually representing matches and captured groups. Ideal for identifying complex trade setups in real-time. TradeQL queries are specified using the TradeQL Language. See https://github.com/abdielou/tradeql for more details. This language is expressed as a regular expression. The language al
FREE
インディケータはチャート上にトレンドラインを描画します。このインジケーターには6つの入力があります。ユーザーは両方の行に代替ラベルを指定できます。インジケーターの複数のインスタンスが使用される場合、ラベルは異なっている必要があります。ユーザーは、線の幅と色、および使用する重要なピークを指定する深さを設定できます。たとえば、Depth = 10は、現在の山と谷を使用してトレンドラインを設定します。この山と谷は、左右に少なくとも10本のバーがあり、高/低がピークの高/低よりも小さい/大きいです。インジケーターは、以前の山と谷もペイントします。インジケーターには、価格がサポート/レジスタンスラインから事前に設定された距離にあるときにユーザーに通知するために使用できるアラート機能が追加されています。アラート距離はピップで設定されます。
FREE
STAMINA HUD – Advanced Market & Trend Dashboard (MT5) STAMINA HUD   is a professional   market information panel   designed for traders who want   clarity, speed, and control   directly on the chart. It provides a   clean heads-up display (HUD)   with essential market data and   multi-timeframe trend direction , without cluttering the chart or generating trading signals. What STAMINA HUD Shows   Current Price   Spread (in real pips)   Today High–Low range (pips)   Average D
FREE
Candle Countdown — MT5用 正確なローソク足カウントダウン Candle Countdown は、 現在のローソク足が閉じるまでの残り時間 をチャート上に表示するシンプルで正確なツールです。 エントリーがローソク足のクローズに依存する場合、数秒の違いが重要になります。 このインジケーターは正確な時間を表示し、焦らずに判断できるようサポートします。 ローソク足のクローズ時間を正確に把握するためのインジケーターです。 表示内容: ローソク足が閉じるまでの残り時間 サーバー現在時刻 スプレッド ストップレベル(Stop Level) タイマーはティックに依存せず、プラットフォームの内部タイマーによって更新されるため、市場の動きが少ない場合でも安定した表示を維持します。 これにより、低ボラティリティの環境でも滑らかで安定したカウントダウンを実現します。 情報は背景付きのブロック内に表示されるため、どのチャートカラーでも見やすく、分析の妨げになりません。 ローソク足のクローズが近づくと、タイマーの色が変化し、視覚的に状況を把握しやすくなります。 MT4版はこちら: Cand
FREE
This Mt5 Indicator Signals when there is two opposite direction bars engulfed by current bar.  has a recent Exponential Moving Average Cross and past bar was oversold/bought Expert Advisor Available in Comments  Free Version Here : https://www.mql5.com/en/market/product/110114?source=Site&nbsp ; Full Alerts for mt5 terminal , phone , email, print to file, print to journal  Buy Signal ( blue line ) Past ema cross ( set at 30 bars back ) Past bar rsi is oversold ( level 40  ) Engulfing bar closes
FREE
DoubleRSI — Dual RSI Crossover Indicator with Signal Filters Description DoubleRSI displays two RSI lines with configurable periods on a separate window and generates buy/sell signals based on crossovers between the two RSI lines within defined price zones. How it works A buy signal is generated when the short RSI crosses above the long RSI while the long RSI is within the configured buy zone (default 50-70). A sell signal is generated when the short RSI crosses below the long RSI while the long
FREE
このプロダクトを購入した人は以下も購入しています
SuperScalp Pro
Van Minh Nguyen
4.72 (18)
SuperScalp Pro — 高度なマルチフィルター対応スキャルピングインジケーターシステム SuperScalp Pro は、クラシックな Supertrend と複数のインテリジェントな確認フィルターを組み合わせた高度なスキャルピング用インジケーターシステムです。M1〜H4 のすべての時間足で効率的に機能し、特に XAUUSD、BTCUSD、および主要なFX通貨ペアに適しています。単体のシステムとして、また既存の取引戦略へ柔軟に統合して使用できます。 本インジケーターは 11 以上のフィルターを統合しており、短期・長期の EMA、トレンド判定に用いる 3 本の EMA、EMA スロープ(EMA slope)、RSI、ADX、出来高、VWAP、ボリンジャーバンドのブレイクアウト、MACD ダイバージェンスフィルターなどを含みます。スマートキャンドルフィルターはローソク足の終値を確認して弱いシグナルを排除し、3 本の EMA と MACD ダイバージェンスを組み合わせたトレンド認識メカニズムにより勝率の高いシグナルの選別を支援します。 SuperScalp Pro は ATR に基
Power Candles – あらゆる市場に対応した強度ベースのエントリーシグナル Power Candles は、Stein Investments が長年培ってきた強度分析を価格チャート上に直接反映します。価格だけに反応するのではなく、各ローソク足は実際の市場の強さに基づいて色分けされ、モメンタムの蓄積、強度の加速、明確なトレンド転換を瞬時に把握できます。 すべての市場に共通する単一ロジック Power Candles は すべての取引シンボル で自動的に動作します。現在のシンボルが Forex か非 Forex 市場かを自動判別し、内部で適切な強度モデルを適用します。 Forex および Gold :FX Power のデルタ値を使用(絶対値レンジ最大 100) 指数、暗号資産、CFD :IX Power の強度値を使用(絶対値レンジ最大 50) 必要な強度計算は Power Candles に直接組み込まれています。ローソク足のカラーリングやシグナルロジックに、追加のインジケーターは不要です。 価格ノイズではなく「強度状態」 各ローソク足は、以下の 9 つの明確に定義された強
Azimuth Pro
Ottaviano De Cicco
5 (6)
発売プロモーション Azimuth Proは先着100名様限定で 299ドル でご提供します。最終価格は 499ドル となります。 リテールとインスティテューショナルのエントリーの違いはインジケーターではなく、ロケーションにあります。 多くのトレーダーは、モメンタムを追いかけたり、遅行シグナルに反応して、任意の価格レベルでエントリーします。機関投資家は、需給が実際にシフトする構造的なレベルに価格が到達するのを待ちます。 Azimuth Proはこれらのレベルを自動的にマッピングします:スイングアンカーVWAP、マルチタイムフレーム構造ライン、高確率ロケーションにのみ出現するABCパターン。 Azimuth Proは、構造分析とインテリジェントな自動化の両方を求めるプロフェッショナルトレーダー向けに構築されています。 Azimuthが外科的精度で市場構造をマッピングする一方、Azimuth Proはインテリジェンスレイヤーを追加します:トレーディングスタイルの自動検出、スマート設定された移動平均線、20年のデータでバックテストされた最適化パラメータ。その結果、お使いの銘柄と
Entry In The Zone and SMC Multi Timeframe is a real-time 2-in-1 market analysis tool that combines market structure analysis and a No Repaint BUY / SELL signal system into a single indicator, built on Smart Money Concepts (SMC) — a widely adopted framework used by professional traders to understand market structure. This indicator helps you see the market more clearly, make decisions based on structure rather than guesswork, and focus on high-probability zones where price is more likely to react
このインジケーターを購入された方には、以下の特典を 無料 で提供しています: 各トレードを自動で管理し、ストップロスとテイクプロフィットを設定し、戦略ルールに基づいてポジションを決済する補助ツール 「Bomber Utility」 様々な銘柄に合わせたインジケーターの設定ファイル(セットファイル) 「最小リスク」、「バランスリスク」、「待機戦略」 の3つのモードで使用できる Bomber Utility 用の設定ファイル このトレーディング戦略をすぐに導入・設定・開始できる ステップバイステップのビデオマニュアル ご注意: 上記の特典を受け取るには、MQL5のプライベートメッセージシステムを通じて販売者にご連絡ください。 オリジナルのカスタムインジケーター 「Divergence Bomber(ダイバージェンス・ボンバー)」 をご紹介します。これは、MACDのダイバージェンス(乖離)戦略に基づいた 「オールインワン」型のトレーディングシステム です。 このテクニカルインジケーターの主な目的は、価格とMACDインジケーターの間に発生するダイバージェンスを検出 し、将来の価格の動きを示す
OmniSync Projection
Antonio-alin Teculescu
5 (1)
Chronos Fractal Engine is an innovative price projection indicator for MetaTrader 5, designed to transform your technical analysis by intelligently identifying and projecting historical price patterns. Built upon an advanced correlation algorithm and the fractal principles of the market, this powerful tool visualizes potential future price movements, giving you a unique edge in your trading decisions. What is Chronos Fractal Engine? At its core, the Chronos Fractal Engine employs a sophisticat
Meridian Pro
Ottaviano De Cicco
5 (1)
Meridian Pro:MT5用プロフェッショナル・マルチタイムフレーム・トレンドマトリックス 概要 Meridian Pro は Merkava Labs が開発したマルチタイムフレーム・トレンドマトリックスで、方向性の状態、強度、モメンタムの状況、マトリックスの合意をひとつのコンパクトなパネルに集約します。ひとつのアダプティブエンジンがM1からW1まで一貫して適用されます。シンボルごとの調整は不要。インジケーターの積み重ねも不要。すべてのアセットとすべてのタイムフレームをカバーするひとつの構造化された読み取りです。 発売キャンペーン — Meridian Proを USD 99 (導入価格)で入手。通常価格:USD 149 。 1. Meridian Proが他と異なる理由 ひとつのエンジン、バラバラなインジケーターのダッシュボードではない 多くのMTFダッシュボードは、タイムフレームごとに生のインジケーター値を繰り返すだけです。Meridian Proはマトリックス全体でひとつのアダプティブ・トレンドエンジンを使用するため、パネルの各行が同じ構造化フレームワークから導出されます
このインジケーターを購入すると、プロ仕様のトレードマネージャーを無料で差し上げます。 まず第一に、このトレーディングシステムがノンリペイント、ノンリドロー、ノンラグのインジケーターであることを強調する価値がある。これにより、手動取引とロボット取引の両方に理想的なものになっています。 オンラインコース、マニュアル、プリセットのダウンロード。 「スマートトレンドトレーディングシステム MT5」は、新規および経験豊富なトレーダー向けにカスタマイズされた包括的なトレーディングソリューションです。10以上のプレミアムインジケーターを組み合わせ、7つ以上の堅実なトレーディング戦略を備えており、多様な市場状況に対応する多目的な選択肢となっています。 トレンドフォロー戦略:トレンドを効果的に乗り越えるための正確なエントリーとストップロス管理を提供します。 リバーサル戦略:潜在的なトレンドの反転を特定し、トレーダーがレンジ相場を活用できるようにします。 スキャルピング戦略:高速で正確なデイトレードおよび短期取引のために設計されています。 安定性:すべてのインジケーターはノンリペイント、ノンリドロー、ノ
Gold Entry Sniper – ゴールドスキャルピング&スイングトレード用プロフェッショナル多時間足ATRダッシュボード Gold Entry Sniper は、XAUUSDや他の銘柄向けに正確な 売買シグナル を提供する、MetaTrader 5用の高度なインジケーターです。 ATRトレーリングストップロジック と 多時間足分析ダッシュボード を搭載し、スキャルピングからスイングトレードまで対応します。 主な特徴と利点 多時間足シグナル分析 – M1、M5、M15 のトレンドを同時表示。 ATRベースのトレーリングストップ – ボラティリティに応じて動的に調整。 プロ仕様のチャートダッシュボード – シグナル状況、ATRレベル、回帰線、売買方向を表示。 明確な売買マーカー – 自動矢印とテキストラベル。 エグジットアラートとトレード管理 – 利益確定のための自動検出。 完全カスタマイズ可能 – パネル位置、色、フォント、ATR/回帰設定を調整可能。 ゴールド(XAUUSD)に最適化 – M1〜M15のスキャルピングに最適、FXや指数、暗号資産にも対応。 Gold Entry
トレンド スクリーナー インジケーターでトレンド取引の力を解き放ちます。ファジー ロジックと複数通貨システムを活用した究極のトレンド取引ソリューションです。 ファジー ロジックを活用した革新的なトレンド インジケーターである Trend Screener を使用して、トレンド取引を向上させます。 これは、13 を超えるプレミアム ツールと機能、および 3 つの取引戦略を組み合わせた強力なトレンド追跡インジケーターであり、Metatrader をトレンド アナライザーにする多用途の選択肢となります。 期間限定オファー : トレンド スクリーナー インジケーターは、わずか 100 ドルで生涯ご利用いただけます。 (元の価格 50$ ) (オファー延長) Trend Screener の 100% 非再描画精度の揺るぎない精度を体験して、取引の決定が過去の価格変動の影響を受けないようにしてください。 マルチタイムフレームおよびマルチ通貨機能の多用途性を解放し、比類のない自信を持って外国為替、商品、暗号通貨、インデックスの世界を取引できるようにします。 Trend Screener の包括的な
FX Trend NG:次世代マルチマーケット・トレンドインテリジェンス 概要 FX Trend NG は、複数の時間足に対応したプロフェッショナル向けトレンド分析およびマーケット監視ツールです。 市場全体の構造を数秒で把握することができます。 複数のチャートを切り替える必要はありません。どの銘柄がトレンド中なのか、どこでモメンタムが弱まっているのか、そしてどの時間足で強い整合性があるのかを瞬時に確認できます。 ローンチ特別オファー – FX Trend NG を $30(6ヶ月) または $80 永久ライセンス でご利用いただけます。 すでに Stein Investments のユーザーですか? -> メッセージを送信 して、プライベートグループへアクセスしてください。 セットアップや詳細情報が必要ですか? -> Stein Investments 公式ページ をご覧ください。 1. FX Trend NG が他と異なる理由 3ステート・トレンドロジック ― Buy と Sell だけではない • 多くのインジケーターは Buy または Sell の2状態のみを表示します。
Quantum TrendPulse を ご紹介します。これは、   SuperTrend   、   RSI   、および Stochastic のパワーを 1 つの包括的なインジケーターに組み合わせて、取引の可能性を最大限に引き出す究極の取引ツールです。精度と効率を求めるトレーダー向けに設計されたこのインジケーターは、市場のトレンド、勢いの変化、最適なエントリー ポイントとエグジット ポイントを自信を持って特定するのに役立ちます。 主な特徴: SuperTrend 統合: 現在の市場動向に簡単に追従し、収益性の波に乗ることができます。 RSI精度: 買われすぎと売られすぎのレベルを検出し、市場の反転のタイミングに最適で、SuperTrendのフィルターとして使用されます。 確率的精度: 確率的振動を活用して、変動の激しい市場で隠れたチャンスを見つけます。SuperTrend のフィルターとして使用されます。 マルチタイムフレーム分析:   M5 から H1 または H4 まで、さまざまなタイムフレームで市場を常に把握します。 カスタマイズ可能なアラート: カスタム取引条件が満たされ
BTMM State Engine Pro is a MetaTrader 5 indicator for traders who use the Beat The Market Maker approach: Asian session context, kill zone timing, level progression, peak formation detection, and a multi-pair scanner from a single chart. It combines cycle state logic with a built-in scanner dashboard so you do not need the same tool on many charts at once. What it does Draws the Asian session range; session times can follow broker server offset or be set in inputs. Tracks level progression (L
Trend Ai indicatorは、トレンドの識別と実用的なエントリポイントと反転アラートを組み合わせることで、トレーダーの市場分析を強化する優れたツールです。 この指標は、ユーザーが自信と正確さで外国為替市場の複雑さをナビゲートすることを可能にします トレンドAiインジケーターは、主要なシグナル以外にも、プルバックやリトレースメント中に発生するセカンダリエントリポイントを識別し、トレーダーが確立されたトレンド内の価格修正を活用できるようにします。 重要な利点: *MT4およびMT5の仕事 *明確な買いまたは売りシグナル *再描画しません ·すべての資産で動作します 私はeaやセットをtelegram it詐欺で販売しないように注意してください。 すべての設定はここでブログで無料です。  重要! 指示とボーナスを得るために購入後すぐに私に連絡してください! 私の他のプロダクトと同様、実質操作の監視はここに見つけることができます: https://www.mql5.com/en/users/mechanic/seller&nbsp ; 設定および入力: すべての
Gann Made Easy   は、ミスター・ギャンの理論を使用した取引の最良の原則に基づいた、プロフェッショナルで使いやすい外国為替取引システムです。 W・D・ガン。このインジケーターは、ストップロスとテイクプロフィットレベルを含む正確な買いと売りのシグナルを提供します。 PUSH通知を利用して外出先でも取引可能です。 ご購入後、取引方法の説明と優れた追加インジケーターを無料で入手するには、私にご連絡ください! おそらく、ギャンの取引手法についてはすでに何度も聞いたことがあるでしょう。通常、ギャンの理論は初心者のトレーダーだけでなく、すでにある程度の取引経験がある人にとっても非常に複雑なものです。なぜなら、ギャンの取引手法は理論的にはそれほど簡単に適用できるものではないからです。私はその知識を磨き、最良の原則を私の外国為替インジケーターに組み込むために数年を費やしました。 このインジケーターは非常に簡単に適用できます。必要なのは、それをチャートに添付し、簡単な取引推奨事項に従うだけです。このインジケーターは常に市場分析の仕事を行い、取引の機会を探します。適切なエントリーポイントを検
ARICoin is a powerful trading companion designed to generate high-probability entry signals with dynamic TP/SL/DP levels based on volatility. Built-in performance tracking shows win/loss stats, PP1/PP2 hits, and success rates all updated live. Key Features: Buy/Sell signals with adaptive volatility bands Real-time TP/SL/DP levels based on ATR Built-in MA Filter with optional ATR/StdDev volatility Performance stats panel (Success, Profit/Loss, PP1/PP2) Alerts via popup, sound, push, or email Cust
Crystal Heikin Ashi Signals - Professional Trend & Signal Detection Indicator Advanced Heikin Ashi Visualization with Intelligent Signal System for Manual & Automated Trading Final Price: $149 ---------> Price goes up $10 after every 10 sales . Limited slots available — act fast . Overview Crystal Heikin Ashi Signals is a professional-grade MetaTrader 5 indicator that combines pure Heikin Ashi candle visualization with an advanced momentum-shift detection system. Designed for both manual traders
このインジケーターは、反転ポイントと価格戻りゾーンを正確に表示します。     主要プレーヤー 。新たなトレンドが形成される場所を把握し、最大限の精度で意思決定を行い、すべての取引をコントロールします。 TREND LINES PRO インジケーターと組み合わせることで、その潜在能力を最大限に発揮します。 VERSION MT4 インジケーターが示す内容: 新しいトレンドの始まりに活性化する反転構造と反転レベル。 リスクと報酬の比率を最小限に抑えた利益 確定 と 損失停止の レベルの表示     RR 1:2   。 インテリジェントな削減ロジックによるストップロス。 指定されたインジケーターから 2 つのトレンド タイプの反転パターンを表示します。 指標: トレンドを追う   TREND LINES PRO   (世界的なトレンドの変化) TREND PRO   (クイックトレンド変更) シンプルで効果的   スキャナー   リアルタイムトレンド(新機能)。 マルチタイムフレームのインストゥルメント フィルタリング。 画面   利益     LOGIC AI信号の後。 当日プラス方
あなたのシンボルでどの戦略が実際に機能するか確認しましょう - リアルマネーをリスクにさらす前に。 Power Barは、あらゆるシンボルとあらゆるタイムフレームで 極端な価格バー を検出し、3つの異なるトレード戦略を即座にバックテストします。勝率、プロフィットファクター、損益を並べて比較できます。すべてが1つのインタラクティブなパネルに集約されています。 推測なし。カーブフィッティングなし。データだけです。 Power Barが特別な理由 ほとんどのインジケーターはシグナルを出すだけで、それが機能するかどうかは推測に任されます。Power Barはさらに先を行きます - すべてのシグナルを 3つの戦略 に対してテストし、統計を表示します。FlipFlop、Momentum、Reversalをワンクリックで切り替え、数値が即座に変化するのを確認できます。 FlipFlop - 常にポジションを保有。シグナルでエントリーし、反対シグナルでイグジット。当社のリサーチでは、US30、US500、DAXなどのトレンドのあるインデックスで最も効果的です。 Momentum - シグナルの方向に
まず第一に、この取引インジケーターは再描画されず、再描画されず、遅延しないことを強調する価値があります。これにより、手動取引とロボット取引の両方に理想的なものになります。 ユーザーマニュアル:設定、入力、戦略。 アトミックアナリストは、価格の強さとモメンタムを利用して市場でより良いエッジを見つけるためのPA価格アクションインジケーターです。ノイズや誤ったシグナルを除去し、取引ポテンシャルを高めるための高度なフィルターを備えています。複雑なインジケーターの複数のレイヤーを使用して、アトミックアナリストはチャートをスキャンし、複雑な数学的計算をシンプルなシグナルと色に変換します。これにより、どのような初心者トレーダーでも理解して使用し、一貫した取引の決定を行うことができます。 「アトミックアナリスト」は、新規および経験豊富なトレーダー向けにカスタマイズされた包括的な取引ソリューションです。プレミアムインジケーターとトップノッチの機能を1つの取引戦略に組み合わせ、すべてのタイプのトレーダーにとって汎用性のある選択肢にします。 デイリートレーディングとスキャルピング戦略:高速で正確なデイ
まず第一に、この取引ツールはノンリペイント、ノンリドロー、ノンラグの指標であり、プロの取引に理想的ですことを強調する価値があります。 オンラインコース、ユーザーマニュアル、デモ。 スマートプライスアクションコンセプトインジケーターは、新米から経験豊富なトレーダーまで、非常 に強力なツールです。Inner Circle Trader AnalysisやSmart Money Concepts Trading Strategiesなど、20以上の有用な指標を1つに組み合わせています。このインジケーターはスマートマネーコンセプトに焦点を当て、大手機関の取引方法を提供し、彼らの動きを予測するのに役立ちます。 特に、流動性分析に優れており、機関がどのように取引しているかを理解しやすくしています。市場のトレンドを予測し、価格の動きを慎重に分析するのに優れています。機関の戦略とトレードを合わせることで、市場の動向についてより正確な予測ができます。このインジケーターは多目的であり、市場構造を分析し、重要な注文ブロックを特定し、さまざまなパターンを認識するのに優れています。 このインジケーター
Auto Optimized Parabolic RSI: 高度な3Dモメンタムエンジン ほとんどのリテール向けインジケーターは、市場のボラティリティが変化した瞬間に破綻する静的な入力値に依存しているため、失敗に終わります。Auto Optimized Parabolic RSIは、自らの数学的優位性を継続的に再計算することで「インジケーターの陳腐化」問題を解決し、機関投資家レベルの定量的適応力をMT5ターミナルに直接もたらします。 最大の強み: カスタムインメモリ3D最適化 標準的な自動最適化ツールは、インジケーターの呼び出しで端末に過負荷をかけるため、頻繁にMT5プラットフォームをフリーズさせます。本ツールは、このボトルネックを完全に回避しています。RAMベースのカスタムネイティブ計算機を内蔵した内部エンジンは、チャートを読み込んだりタイムフレームを変更したりするたびに、超高速の3Dグリッド探索を実行します。RSI期間(頻度)、SARステップ(加速度)、SAR最大値(制限速度)を同時にスイープし、プラットフォームを遅延させることなく、数万通りものパラメーターの組み合わせを絶対的なミ
RelicusRoad Pro: 定量的市場オペレーティングシステム 【期間限定】無制限アクセス 70% OFF - 2,000人超のトレーダーと共に なぜ多くのトレーダーは「完璧な」インジケーターを使っても失敗するのでしょうか? それは、文脈を無視して 単一の概念 だけでトレードしているからです。文脈のないシグナルは単なるギャンブルです。勝ち続けるには、 根拠の重なり(コンフルエンス) が必要です。 RelicusRoad Proは単なる矢印インジケーターではありません。完全な 定量的市場エコシステム です。独自のボラティリティモデリングを用いて、価格が推移する「適正価値の道(Fair Value Road)」をマッピングし、ノイズと真の構造的ブレイクを判別します。 推測はやめましょう。機関投資家レベルの「ロード・ロジック」でトレードを。 コアエンジン:「Road」アルゴリズム システムの中心となる Road Algo は、市場環境にリアルタイムで適応するダイナミックなボラティリティチャネルです。 安全ライン(平衡点) と、価格が数学的に反転しやすい 拡張レベル を投影します。 Si
FX Power: 通貨の強弱を分析して、より賢い取引を実現 概要 FX Power は主要通貨と金の実際の強弱をあらゆる市場状況で理解するための必須ツールです。強い通貨を買い、弱い通貨を売ることで、 FX Power は取引の意思決定を簡素化し、高い確率の取引機会を見出します。トレンドを追従する場合でも、極端なデルタ値を使用して反転を予測する場合でも、このツールはあなたの取引スタイルに完全に適応します。ただ取引するだけではなく、 FX Power で賢く取引をしましょう。 1. なぜ FX Power がトレーダーにとって非常に有益なのか 通貨と金のリアルタイム強弱分析 • FX Power は主要通貨と金の相対的な強弱を計算し、マーケットダイナミクスに関する明確な洞察を提供します。 • どの資産がリードしているか、または後れを取っているかを監視して、取引するペアを賢く選びましょう。 マルチタイムフレームの包括的なビュー • 短期、中期、長期のタイムフレームで通貨と金の強弱を追跡し、マーケットトレンドに基づいて取引戦略を調整できます。 • スキャルピングからスイングトレード
Bill Williams Advanced is designed for automatic chart analysis using Bill Williams' "Profitunity" system. The indicator analyzes four timeframes at once. Manual (Be sure to read before purchasing) Advantages 1. Analyzes the chart using Bill Williams' "Profitunity" system. Signals are displayed in a table in the corner of the screen and on the price chart. 2. Finds all known AO and AC signals, as well as zone signals. Equipped with a trend filter based on the Alligator. 3. Finds "Divergence Bar
Currency Strength Dashboard Pro MetaTrader 5 用の リアルタイム通貨強度分析プロフェッショナルダッシュボード 。 このインジケーターは、 8つの主要通貨 (EUR、USD、GBP、JPY、CHF、AUD、CAD、NZD)の強さを計算し、 28の通貨ペア を同時に複数の時間足で分析・表示します。 ダッシュボードにより、トレーダーは 市場全体の状況を一目で把握 でき、余計な計算や複数のチャートを切り替える必要がありません。 計算方法 このインジケーターは、 高度な数学的通貨強度分析手法 に基づいています。 これは、類似インジケーターで一般的に使用されている RSIベースの手法 と比較して、より正確で客観的です。 この方法は 28の通貨ペアすべての相互関係を同時に分析 し、市場における実際の力関係をよりクリーンで偏りのない形で表示します。 リアルタイムダッシュボード メインテーブルには 8つの通貨 の完全なデータが表示されます。 Rank(順位) — 通貨の総合強度による順位。 1(最も強い)〜8(最も弱い) 。 Strength(強度) — 現在
CGE Trading Suite
Carl Gustav Johan Ekstrom
5 (1)
CGE Trading Suite delivers the analytical edge typically reserved for professional trading desks. The platform integrates a full suite of analytical tools into one seamless workflow: dynamic grid mapping, liquidity behavior analysis, ECM, trend lines, MIDAS, trade cycles, and directional channel projections. Together, these provide a unified view of market structure and momentum. Directional clarity is further enhanced by the capital flow index, which measures currency basket strength to identif
トレンドラインプロ   市場の真の方向転換点を理解するのに役立ちます。この指標は、真のトレンド反転と主要プレーヤーが再び参入するポイントを示します。 分かりますか     BOSライン   複雑な設定や不要なノイズなしに、より長い時間足でのトレンドの変化と重要なレベルを把握できます。シグナルは再描画されず、バーが閉じた後もチャート上に残ります。 MT4バージョン   -   RFI LEVELS PRO インジケーター と組み合わせることで、その最大限の能力を発揮します インジケーターが示す内容: 本当の変化   トレンド(BOSライン) 一度シグナルが現れたら、それは有効です!これは、リペイント機能を持つインジケーターとの重要な違いです。リペイント機能を持つインジケーターは、シグナルを発した後、それを変更し、資金の損失につながる可能性があります。これにより、より高い確率と精度で市場に参入できます。また、矢印が現れた後、目標値(利益確定)に達するか、反転シグナルが現れるまで、ローソク足の色を変更する機能もあります。 繰り返しエントリ   主要プレーヤーの補充 エントリーポイントを探す
ARIPoint is a powerful trading companion designed to generate high-probability entry signals with dynamic TP/SL/DP levels based on volatility. Built-in performance tracking shows win/loss stats, PP1/PP2 hits, and success rates all updated live. Key Features: Buy/Sell signals with adaptive volatility bands Real-time TP/SL/DP levels based on ATR Built-in MA Filter with optional ATR/StdDev volatility Performance stats panel (Success, Profit/Loss, PP1/PP2) Alerts via popup, sound, push, or email Cu
Berma Bands
Muhammad Elbermawi
5 (8)
Berma Bands (BBs) インジケーターは、市場のトレンドを特定して活用したいトレーダーにとって貴重なツールです。価格と BBs の関係を分析することで、トレーダーは市場がトレンド段階にあるか、レンジ段階にあるかを判断できます。 詳細については、[ Berma Home Blog ] をご覧ください。 バーマ バンドは、上部バーマ バンド、中部バーマ バンド、下部バーマ バンドの 3 つの異なる線で構成されています。これらの線は価格の周りにプロットされ、全体的な傾向に対する価格の動きを視覚的に表します。これらのバンド間の距離から、ボラティリティや潜在的な傾向の反転についての洞察を得ることができます。 バーマ バンドの線がそれぞれ離れると、市場が横ばいまたはレンジ相場の期間に入っていることを示すことがよくあります。これは、明確な方向性の偏りがないことを示しています。トレーダーは、これらの期間中にトレンドを特定するのが難しいと感じる可能性があり、より明確なトレンドが出現するまで待つ場合があります。 バーマ バンドの線が 1 本の線に収束すると、強いトレンド環境の兆候となること
作者のその他のプロダクト
Engulfing Period
Wachinou Lionnel Pyrrhus Sovi Guidi
5 (3)
エングルフィング・ピリオド V75Killed インディケーター:あなたのトレーディング戦略を革命的に! (このインディケーターはプライベートであり、その特定の目的と価値を理解しているトレーダー専用です。) エングルフィング・ピリオド V75Killed インディケーターは、複数のタイムフレームにわたる重要なエングルフィング期間を簡単に特定したいトレーダーにとってゲームチェンジャーです。このインディケーターは、エングルフィングゾーンをチャートに直接マークし、時間を節約し、高確率のトレーディングチャンスを活用する能力を向上させます。 主な特徴: マルチタイムフレーム分析 月足、週足、日足、4時間足のタイムフレームでエングルフィング期間を自動的に検出し、トレードスタイルに合わせます。 カスタマイズ可能な表示 色、フォント、ラベルの位置を調整して、最適なトレーディング体験を提供します。 リアルタイム表示 潜在的なエングルフィングゾーンを即座に特定し、市場の先を行く。 ユーザーフレンドリーな設計 簡単なインターフェースで、チャートにインディケーターを適用するだけで自信を持って取引を開
FREE
WaCandleTimerMT5
Wachinou Lionnel Pyrrhus Sovi Guidi
Wa Candle Timer MT5 は、主チャート上で現在のローソク足が確定するまでの残り時間をリアルタイム表示します。バー終盤が近づくと色が変わります(既定ではローソク足の経過時間が約 95% に達した時=残り約 5% )。 軽量・見やすく、足の確定に合わせてエントリー/イグジットを同期したいトレーダーに最適です。 主な機能 どの銘柄・時間足でも使える 確定までのカウントダウン 。 終盤で自動色変更 (既定の閾値 ≈ 95% 経過)。 シンプルで邪魔しない テキスト表示(フォント/サイズをカスタマイズ可)。 安全なオブジェクト管理 : v2 は自分のオブジェクト(接頭辞 「Wa_CT」 )のみを削除し、他の描画は保持。 高効率・低負荷 。 入力項目 clrBeforeDecisionPointTimer —— 閾値前のテキスト色。 clrAfterDecisionPointTimer —— 閾値超過(確定間際)のテキスト色。 fontSizeTimer —— テキストサイズ。 fontTimer —— フォント(例:「Arial」)。 注: 内部閾値は DecisionPoint
FREE
Asian Range BreakOut
Wachinou Lionnel Pyrrhus Sovi Guidi
完全カスタマイズ可能 – レンジ時間、カラー、ラインスタイル、リスク・リワード設定などのパラメータを調整して、あなたのトレードスタイルに合わせてインジケーターをカスタマイズできます。 トレードレベルの視覚化 – ブレイクアウト条件に基づいて、エントリー価格、ストップロス (SL)、テイクプロフィット (TP) レベルを自動的に描画します。 エキスパートアドバイザー (EA) とシームレスに統合 – RSI、移動平均線、ブレイクオブストラクチャー (BOS) などの追加の確認を加えて、自動売買戦略を完全にコントロールできます。また、 バッファ名をカスタマイズ して EA の要件に適合させることで、戦略の柔軟性をさらに高められます。 マルチアセット & マルチタイムフレームのバックテスト – FXペア、仮想通貨、その他の金融商品 でさまざまな設定をテストし、最適なトレード戦略を見つけましょう。 シンプルで見やすいインターフェース – 非干渉型のデザインで価格アクションに集中でき、トレードシグナルを簡単に解釈できます。 このインジケーターはブレイクアウト戦略の 強固な基盤
FREE
Wa Candle Timer MT5
Wachinou Lionnel Pyrrhus Sovi Guidi
Wa Candle Timer MT5 は、次のローソク足が形成されるまでの残り時間をMT5チャート上に表示する、強力で使いやすいインジケーターです。ローソク足の終了時間を把握することで、より正確なトレードと意思決定を支援します。 主な機能 : 現在のローソク足のカウントダウンを表示 残り時間がユーザー定義のパーセンテージを下回ると色が変化 指定したパーセンテージに達するとアラート通知 フォントとカラーの完全なカスタマイズが可能 時間管理とトレード精度の向上 カスタマイズ可能な設定 : 1️⃣ 閾値以上のタイマー色 2️⃣ 閾値以下のタイマー色 3️⃣ フォントサイズ 4️⃣ フォントスタイル 5️⃣ アラート発生パーセンテージ(%)
FREE
Wa Candle Timer MT4
Wachinou Lionnel Pyrrhus Sovi Guidi
5 (1)
Wa Candle Timer MT4 は、次のローソク足が形成されるまでの残り時間を表示する、強力でユーザーフレンドリーなMT4インジケーターです。このツールは、ローソク足のクローズタイミングを把握しやすくし、より良い取引判断を支援します。 主な機能 : 現在のローソク足のカウントダウンを表示 残り時間が指定した割合を下回ると色が変化 バージョン3.00の新機能:指定した割合でアラートを出す設定が可能 フォントと色の完全カスタマイズ対応 時間管理と取引精度の向上に貢献 カスタマイズ可能な設定 : 1️⃣ 閾値以上のカラー設定 2️⃣ 閾値以下のカラー設定 3️⃣ フォントサイズ 4️⃣ フォントスタイル 5️⃣ アラート発動の割合(%)
FREE
Previous Candle Levels MT5
Wachinou Lionnel Pyrrhus Sovi Guidi
1 (1)
Previous Candle Levels MT5 shows the previous candle levels, it shows the previous candle Open High Low Close levels (OHLC Levels) in different time frame. It's designed to help the trader to analyse the market and pay attention to the previous candle levels in different time frame.  We all know that the OHLC Levels in Monthly, Weekly and Daily are really strong and must of the time, the price strongly reacts at those levels. In the technical analysis, the user can use them as a support and res
FREE
Gbpjpy Asian Breakout
Wachinou Lionnel Pyrrhus Sovi Guidi
GBPJPY Asian Breakout EA アジアセッションブレイクアウト戦略 | M5専用の全自動エキスパートアドバイザー 100%自動売買システム GBPJPY Asian Breakout は、**GBPJPY(ポンド円)**の通貨ペア専用に開発された、 アジア時間帯のレンジブレイクアウト を狙うエキスパートアドバイザー(EA)です。 **M5(5分足)**に最適化されており、洗練されたロジックとリスク管理、時間フィルターを組み合わせた、 完全自動で安定した取引 が可能です。 戦略の特徴 アジア時間帯の レンジを自動検出しブレイクでエントリー エントリー時間帯: 08:00〜13:00(ブローカー時間) 20:00には全ポジションを自動クローズ ダイナミックなストップロスと カスタマイズ可能なリスクリワード比率 月〜木曜日のみ稼働 (金曜と週末は取引なし) マーチンゲール、グリッド、スキャルピングなし 低スプレッドECNブローカー との相性が抜群 ️ 主な設定と機能 • 売買方向(ロング/ショート)を自由に設定
FREE
Wa Candle Timer Percentage MT5
Wachinou Lionnel Pyrrhus Sovi Guidi
Wa Candle Timer Percentage MT5 is an indicator which shows the user how much time is remaining until the next candle will form. The percentage of the evolution of the current candle is also displayed. The user can set the percentage that the candle timer will change the color. These are the settings: 1- The percentage that the candle timer will change the color. 2- Color of Candle Timer when it's BELOW the percentage set by the user. 3- Color of Candle Timer when it's ABOVE the percentage set b
FREE
Previous Candle Levels MT4
Wachinou Lionnel Pyrrhus Sovi Guidi
WaPreviousCandleLevels MT4 shows the previous candle levels, it shows the previous candle Open High Low Close levels (OHLC Levels) in different time frame. It's designed to help the trader to analyse the market and pay attention to the previous candle levels in different time frame.  We all know that the OHLC Levels in Monthly, Weekly and Daily are really strong and must of the time, the price strongly reacts at those levels. In the technical analysis, the user can use them as a support and res
FREE
WaPreviousCandleLevelsMT5
Wachinou Lionnel Pyrrhus Sovi Guidi
!!!This Free Version just works on EURUSD!!! Wa Previous Candle Levels MT5 shows the previous candle levels, it shows the previous candle Open High Low Close levels (OHLC Levels) in different time frame. It's designed to help the trader to analyse the market and pay attention to the previous candle levels in different time frame.  We all know that the OHLC Levels in Monthly, Weekly and Daily are really strong and must of the time, the price strongly reacts at those levels. In the technical anal
FREE
WaPreviousCandleLevelsMT4
Wachinou Lionnel Pyrrhus Sovi Guidi
!!!The free version works only on "EURUSD"!!! WaPreviousCandleLevels MT4 shows the previous candle levels, it shows the previous candle Open High Low Close levels (OHLC Levels) in different time frame. It's designed to help the trader to analyse the market and pay attention to the previous candle levels in different time frame.  We all know that the OHLC Levels in Monthly, Weekly and Daily are really strong and must of the time, the price strongly reacts at those levels. In the technical analys
FREE
WaSwap MT5
Wachinou Lionnel Pyrrhus Sovi Guidi
WaSwap MT5 Indicator shows the current Swap Long and current Swap Short with color. * Set the Swap Threshold and the color to identify when the current swap is below or above the Spread Threshold. * Set X axis and Y axis and chose the Corner and the Anchor to position the Swap Label on the chart. * Write the font and the font size for more confort. * Activate alert if the current Swap Long or the current Swap Short is below the swap threshold. * The user will never swing with a negative sw
FREE
Wa Candle Timer Percentage
Wachinou Lionnel Pyrrhus Sovi Guidi
Wa Candle Timer Percentage MT4 is an indicator which shows the user how much time is remaining until the next candle will form. The percentage of the evolution of the current candle is also displayed. The user can set the percentage that the candle timer will change the color. These are the settings: 1- The percentage that the candle timer will change the color. 2- Color of Candle Timer when it's BELOW the percentage set by the user. 3- Color of Candle Timer when it's ABOVE the percentage set b
FREE
Engulfing Period MT4
Wachinou Lionnel Pyrrhus Sovi Guidi
Engulfing Period V75Killed(MT4) – 市場の転換点を正確に捉えよう! (このインジケーターは プライベート であり、その価値を理解しているトレーダーのみが使用できます。) Engulfing Period V75Killed は、MetaTrader 4 向けの強力なツールであり、 複数の時間足 で 強気(ブル)および弱気(ベア)の包み足パターン を自動的に識別します。重要な包み足ゾーンをチャート上に直接表示し、高確率のトレードチャンスを簡単に特定できます。 主な機能: マルチタイムフレーム分析 月足(MN)、週足(W1)、日足(D1)、4時間足(H4) の包み足パターンを自動検出し、市場の流れをより明確に把握。 カスタマイズ可能な表示設定 色、フォント、ラベルの位置やサイズを自由に調整し、自分のトレードスタイルに最適化。 リアルタイム識別 包み足ゾーンを即座に検出し、重要なトレードチャンスを逃さない。 新機能:Doji & Hammer パターンのサポート(v4.00) 包み足ゾーン内の 十字線(Doji) や ハンマー(Hamm
FREE
WaSwap MT4
Wachinou Lionnel Pyrrhus Sovi Guidi
5 (1)
WaSwap MT4 Indicator shows the current Swap Long and current Swap Short with color. * Set the Swap Threshold and the color to identify when the current swap is below or above the Spread Threshold. * Set X axis and Y axis and chose the Corner and the Anchor to position the Swap Label on the chart. * Write the font and the font size for more confort. * Activate alert if the current Swap Long or the current Swap Short is below the swap threshold. * The user will never swing with a negative sw
FREE
WaSpread MT4
Wachinou Lionnel Pyrrhus Sovi Guidi
WaSpread MT4 Indicator shows the current spread in pips with color. * Set the Spread Threshold and the color to identify when the current spread is below or above the Spread Threshold. * Set X axis and Y axis and chose the Corner and the Anchor to position the Spread Label on the chart. * Write the font and the font size for more confort. * Activate alert if the current spread is above the spread threshold. * For more precision, the user can choose to show the decimal numbers. * The user
FREE
フィルタ:
レビューなし
レビューに返信