SimplyTrade
- インディケータ
- バージョン: 1.0
- アクティベーション: 7

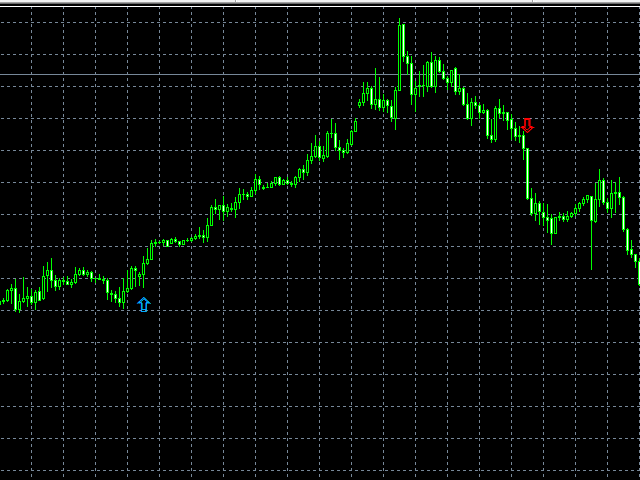
This is a combination of 3 customized indicators, to make chart clean, we only showing up or down arrows. This gives good result in 1 hour and above time frames. In one hour chart, please set sl around 50 pips. Once price moves into your direction, it would be good to trail your sl by 30 to 50 pips to get more profit as this indicator kinda trend follower. In four hour chart, set ls around 100 pips. Works in all major pairs and winning ration is around 70 % based on back test.