Gobbo MT5
- インディケータ
- バージョン: 1.0
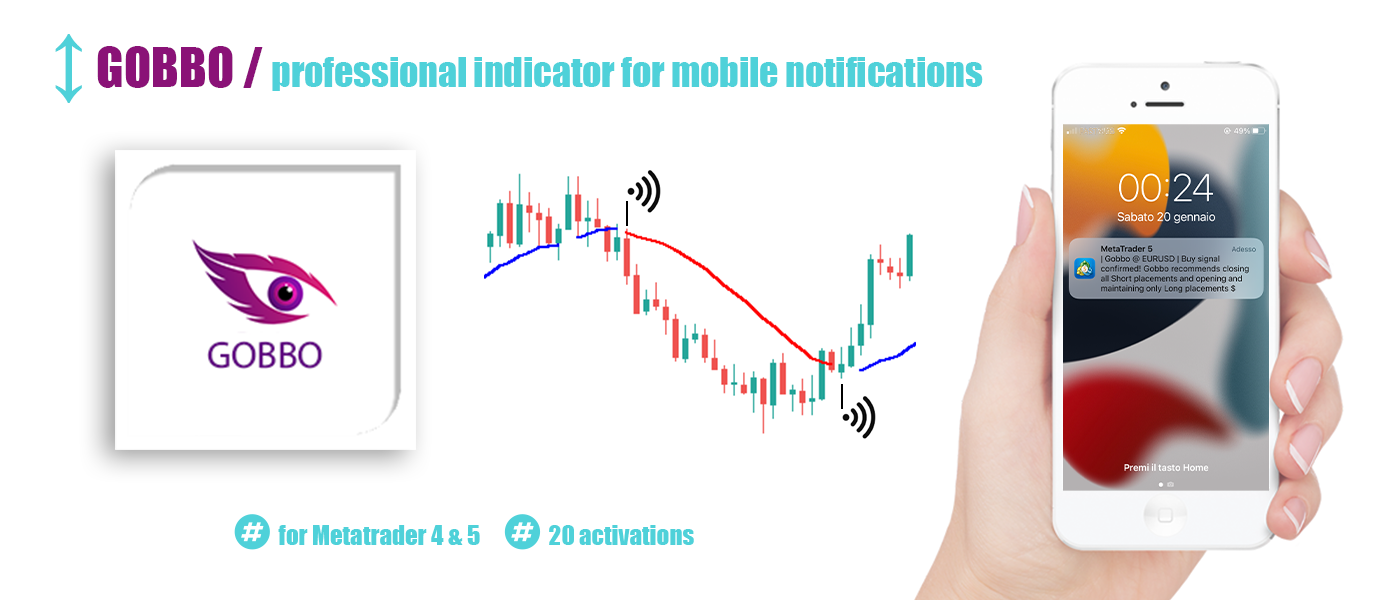
- アクティベーション: 20

Gobbo è un indicatore professionale che evidenzia il trend del mercato con un aspetto grafico chiaro e comprensibile, è basato sulla Moving Average e può essere impostato su qualsiasi periodo di intervallo, di default impostato sul periodo 14, scegliendo un periodo più alto evidenzierà meno cambi di tendenza per un approccio sul medio o lungo periodo, con un periodo più basso più cambi di tendenza per un approccio sul breve termine
L'aggiornamento e l'adattamento al time frame scelto avviene in automatico ed è possibile personalizzare il colore del trend Short e Long
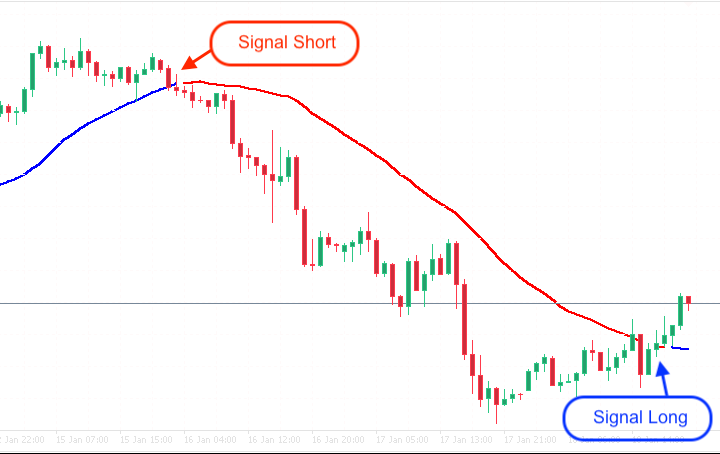
Le candele che hanno chiuso al di sotto del periodo selezionato verranno evidenziate da una linea Rossa e quelle che hanno chiuso sopra da una linea Blu, l'impatto visivo eccellete rende semplificata la scelta di entrata su ogni mercato
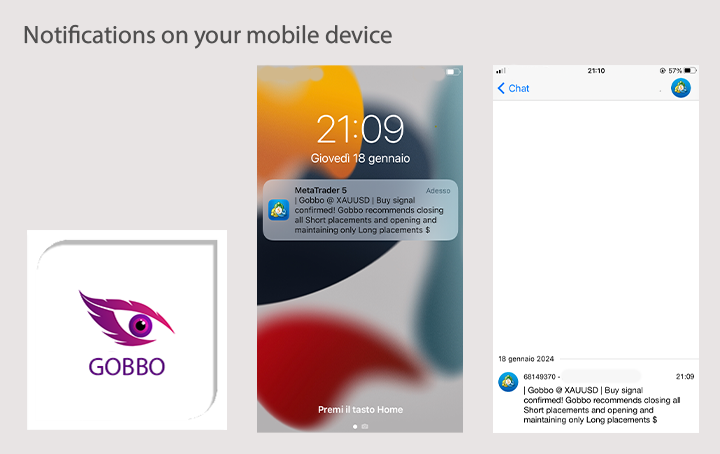
Inoltre è dotato di un sistema integrato che invia le notifiche di conferma continuazione o di cambio di trend direttamente sul tuo smartphone in modo tale potrai essere aggiornato anche quando non puoi fisicamente osservare i mercati, invia una notifica per candela quindi se per esempio operi sul time frame H1 riceverai una notifica ogni ora
Per ricevere le notifiche basta allegarlo al grafico del mercato su cui vuoi operare su un computer che dovrà rimanere sempre acceso e connesso ad internet o su un virtual private server
Per configurare Metatrader all'invio delle notifiche sul tuo smartphone basta aprire Metatrader andare su Strumenti > Opzioni > Notifiche poi selezionare Abilita Notifiche Push e Notifiche dal terminale locale o Notifiche dal server di trading ed inserire il proprio MetaQuote ID che è possibile trovare sul Metatrader del vostro mobile device in impostazioni > Chat e Messaggi
Non appena configurato sul vostro computer e sul mobile device riceverai i segnali che genera, Gobbo non apre ne chiude posizioni lasciando all'investitore il completo controllo
#tag segnali trading trend moving average notifiche smartphone successo aggiornati prezzi andamento mercati