Load positions from MQL5 history reports for MT5
- ユーティリティ
- バージョン: 23.102
- アップデート済み: 19 10月 2023

Script to load on chart the orders, starting from "Signal history report" downloaded from MQL5.
If you found a good signal on "Signals" section of this site and you want to see the history orders on chart, you can do it, following this steps:
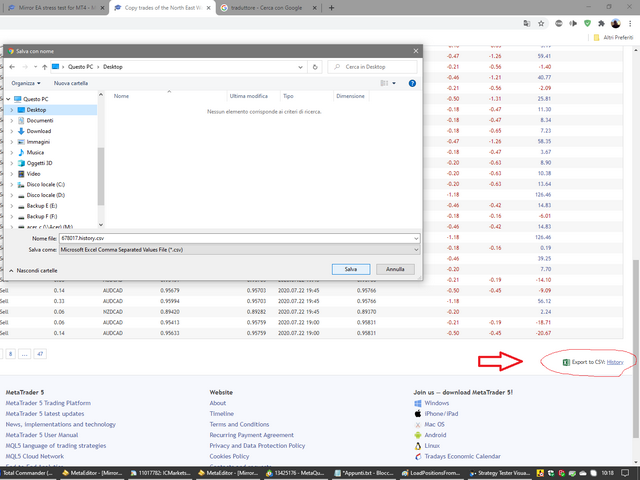
- Download the csv file of history orders
- Copy file in the common folder
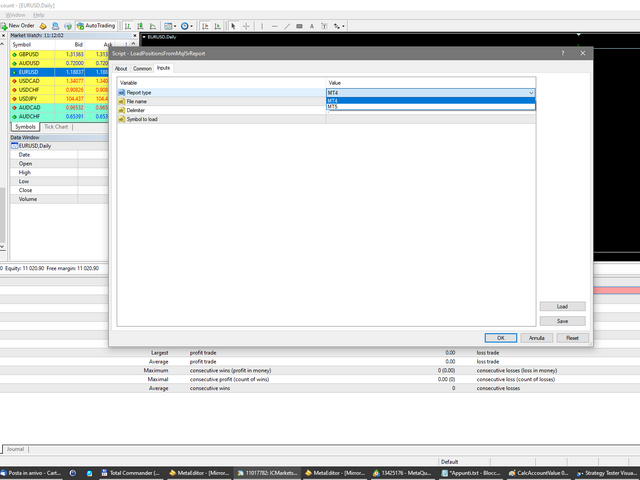
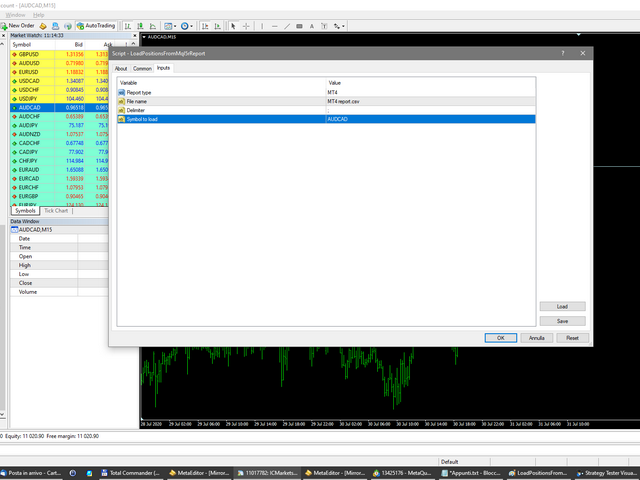
- Launch the script and set the input that are:
- Report type (MT4 or MT5)
- File name
- Delimiter (default is ;)
- Name of symbol to load (if symbol on file is for example EURUSDi, write it on this input)
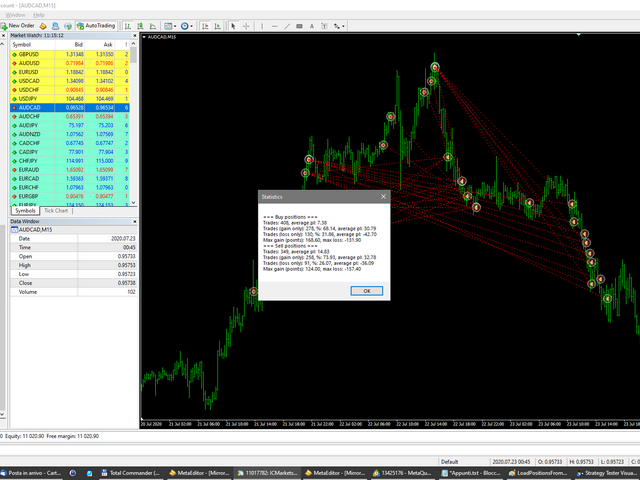
The script will draw arrows and lines on chart for every positions readed on file and will show a message box with a syntetic report of performance.