Mirror controller for MT5
- インディケータ
- バージョン: 25.937
- アップデート済み: 14 11月 2025

The new version of MirrorSoftware 2021 has been completely rewriten and optimized.
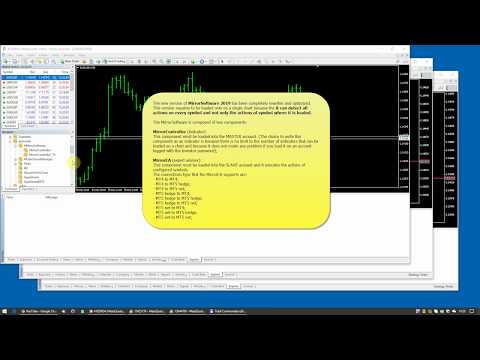
This version requires to be loaded only on a single chart because it can detect all actions on every symbol and not only the actions of symbol where it is loaded.
Even the graphics and the configuration mode have been completely redesigned.
The MirrorSoftware is composed of two components (all components are required to work):
MirrorController (free indicator):
This component must be loaded into the MASTER account. (The choice to write this component as an indicator is because there is no limit to the number of indicators that can be loaded on a chart and because it does not create any problem if you load it on an account logged with the Investor password);
You can download:
MirrorEA (expert advisor):
This component must be loaded into unlimited SLAVE account and it executes the actions of configured symbols.
The connections type that the MirrorEA supports are:
- MT4 to MT4;
- MT4 to MT5 hedge;
- MT4 to MT5 net;
- MT5 hedge to MT4;
- MT5 hedge to MT5 hedge;
- MT5 hedge to MT5 net;
- MT5 net to MT4;
- MT5 net to MT5 hedge;
- MT5 net to MT5 net;
You can Download:
Demo Video
- MirrorController setup
- MirrorEA setup
- Place and delete orders (synchronized and synchronized mode)
- Orders and positions on other chart
- Orders and positions on other symbols (invert mode)
- Orders and positions from all account
- Modify, delete and execute of orders only on SLAVE account
- Orders execution
- Open, close, increase and split positions
- Open, close, increase and split positions copied from MASTER account MT4
- Modify positions
- Split positions on MASTER account MT4
- Comments on orders and positions
* See the demo video for details
Settings of MirrorСontroller
In the Window settings for each action, you can choose a audio voice among 4 predefined ones (David, Peter, Mary, Jennifer) for the events alerts: *
Settings of MirrorEA
In the "Options" tab:
- Open charts of other symbols; *
- Total drawdown %; *
- Close positions; *
- Delete orders; *
In the "Notifications" tab:
- You can enable notifications on your mobile device; *
In the "Voice events" tab:
- For each action, you can choose a audio voice among 4 predefined ones (David, Peter, Mary, Jennifer) for the events; *
In the "Symbols" tab:
- You can add any symbol you decide to copy from the MASTER accounts. Each symbol can be configured in to the Settings window;
In the "Settings" window:
- In the "Filters" tab of symbol settings you can set the follow options:
- Buy, Buy limit, Buy stop; *
- Sell, Sell limit, Sell stop; *
- Invert actions; *
- Copy exit positions; *
- Copy stoploss, Copy takeprofit; *
- Copy actions with magic; *
- Copy actions without magic; *
- Copy actions with comment; *
- Copy actions without comment; *
- Perform actions previously transmitted to the symbol connections; *
- Only alert; *
- Slippage entry (Deviation entry on MT5 version); *
- Slippage exit (Deviation exit on MT5 version); *
- Timeout seconds; *
- Emergency stop loss; *
- Pending mode (Place orders (not synchronized), Not place orders (synchronized)); *
- In the "Money management" tab you can set the follow options:
- Max size; *
- Size calculation mode (Ratio of balance, Ratio of size, Larry Williams formula, Fix size); *
- In the "Schedule" tab settings you can set the follow options:
- Stop copy; *
- Close positions; *
- Delete orders; *
- Intraday trading periods; *
Features
- The MirrorSoftware copies any action, manually or automatically executed (also on account logged with investor password);
- You can execute any action on orders and positions on SLAVE account only;
- You do not need DLLs or other external applications;
- The symbol names between different brokers are not a problem;
- You can manage any SLAVE symbol independently;
- You can set an emergency stoploss for any single positions;
- You can set a total drawdown value;


ユーザーは評価に対して何もコメントを残しませんでした