Ultimate Double Top Bottom Scanner MT5
- インディケータ
- FXsolutions
- バージョン: 1.0
- アクティベーション: 10
This indicator scans for you up to 15 trading instruments and up to 21 time frames for occurrences of the high probability reversal patterns: Double Tops/Bottoms with fake breakouts.
What this indicator detects:
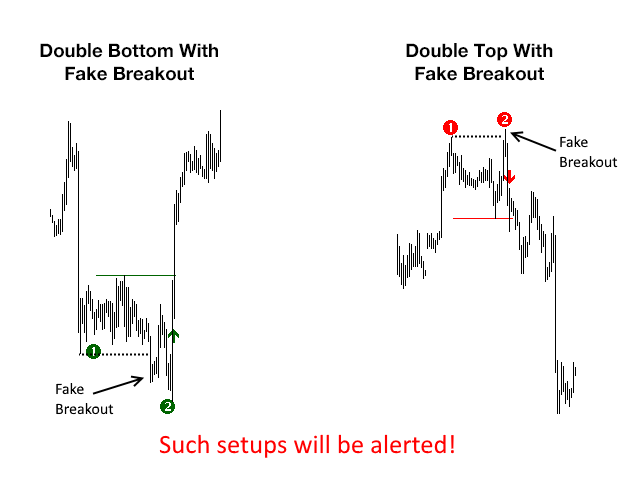
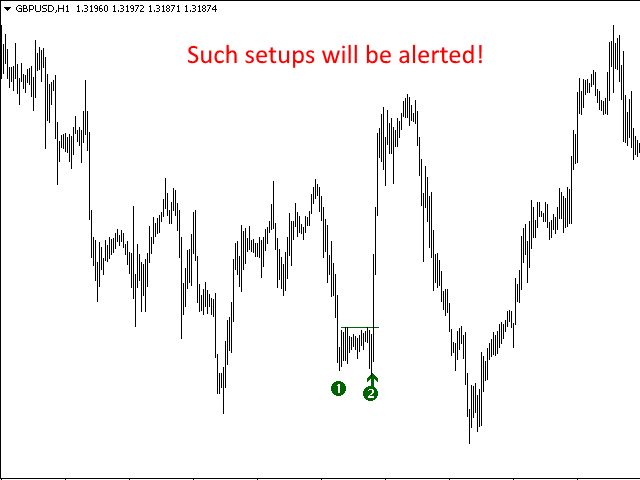
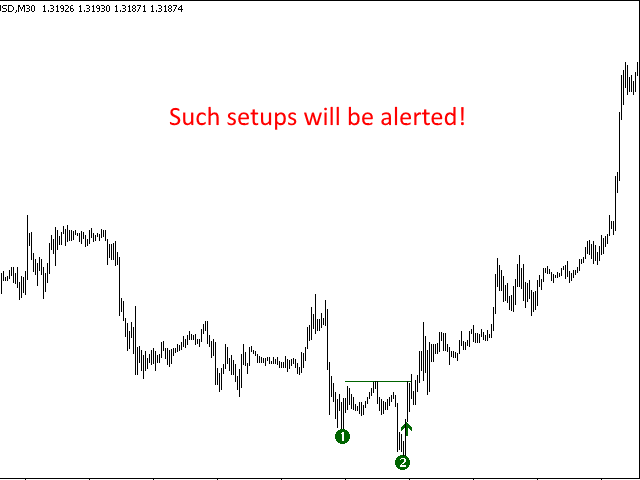
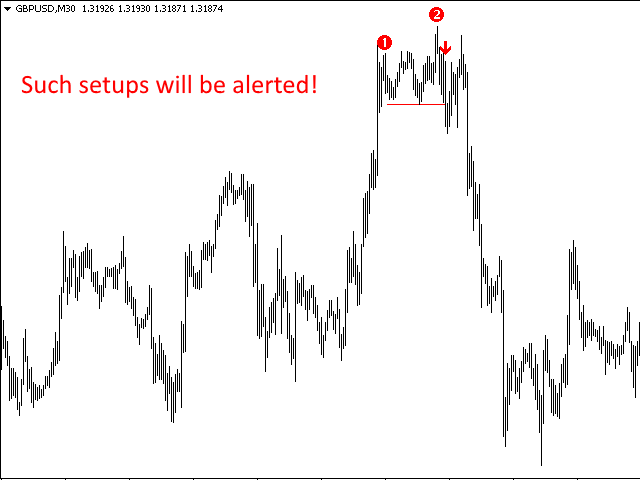
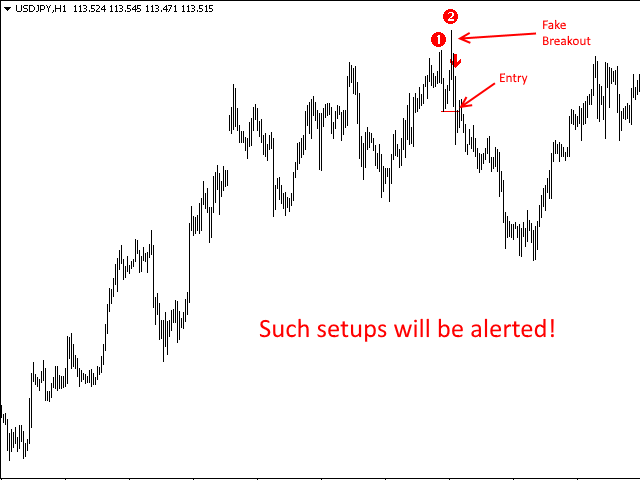
This indicator detects a special form of Double Tops and Bottoms, so called Double Tops/Bottoms with fake breakouts.
For double tops with fake breakouts the highest price of the right shoulder must be higher than the left shoulder. For double bottoms with fake breakouts the lowest price of the right leg must be lower than the left leg.
These special Double Tops/Bottoms are created by the smart money to accumulate its own position size. With the fake breakout the smart money traps as much traders on the wrong side of the market as possible. Then the smart money reverses the direction very sharply. The trapped traders are in panic and exit their position or even reverse their position. This makes the reversal very strong and profitable. The indicator detects exactly these games of the smart money and therefore gives you high probability entry signals.
Please read also the blog post "Professional Trading With Double Tops/Bottoms And Divergences!" which explains the concepts behind the ULTIMATE Double Top/Bottom indicator and how you can use a professional top-down approach.
You can get alerts via MetaTrader 5, email and push notifications at the moment when a signal occurs on any timeframe and any trading instrument you have configured.
You need to install this indicator on only one single chart. The indicator then scans up to 15 instruments and 21 time frames automatically for you! Of course, if you want to scan more than 15 instruments then you can add the scanner to another chart and scan more trading instruments.
Important
The purpose of this indicator is to alert signals so that you will be able to trade these signals even with a normal day job. Therefore, on live charts you will only see the dashboard view as shown in the video. This indicator will NOT draw signals on live charts.
If you need the signals visible on live charts, then you can additionally purchase the Ultimate Double Top Bottom Reversal Indicator
Parameters
- alertsLong: True = Yes, False = No - if true, then the indicator alerts occurrences of "Double Bottom" signals for long entries
- alertsShort: True = Yes, False = No - if true, then the indicator alerts occurrences of "Double Top" signals for short entries
- alertsViaMT5: True = Yes, False = No - if true, then the indicator gives alerts via MetaTrader 5 popup
- alertsViaEmail: True = Yes, False = No - if true, then the indicator gives alerts via email
- alertsViaPush: True = Yes, False = No - if true, then the indicator gives alerts direct to your mobile phone
- alertsM1 - alertsMN1: True = Yes, False = No - if true, then the indicator searches for "Double Top/Bottom" signals on the appropriate time frame e.g. M1, M2 and so on. You can define which time frames will be checked.
- templateName: - if you press a button on the chart (which contains the name of an instrument), then the appropriate chart will open and a template with the specified name will be attached
- checkEveryXSeconds - every X seconds, the indicator checks the next instrument/timeframe for the occurrence of a "Double Top/Bottom" signal
- i1-i15 - define up to 15 instruments, which will be monitored/checked for the occurrence of a "Double Top/Bottom" signal


Useless system. Please don't purchase. Don't waste your money