Channel Architect Indicator
- インディケータ
- バージョン: 1.1
- アクティベーション: 9

This indicator calculates and draws lines over the chart. There are two types of channels:
- Channel A: the mainline is drawn using local lows for uptrends and local highs for downtrends
- Channel B: the mainline is drawn using local highs for uptrends and local lows for downtrends
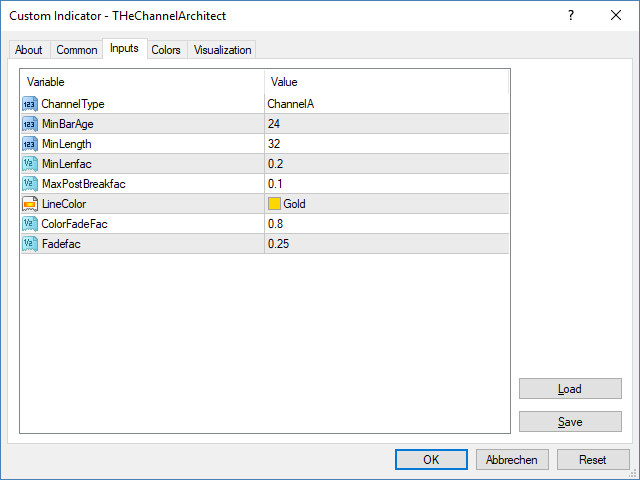
The parallel lines of both types are built using the max. fractal between the base points of the mainline. There are a few conditions, which have to be fullfilled and can be changed by the parameters (see also picture 4):
- MinBarAge: the count of bars to the last base point of a line is called BarAge and has to be greater than the parameter MinBarAge
- MinLength: the length of the line starting at the first base point is measured in bars and has to be greater than MinLength
- MinLenfac: the ratio of the length between the base points of the mainline and the length of the whole line has to be greater than MinLenfac
- MaxPostBreakfac: the ratio of bars since the line was broken (PostBreak) and the unbroken line length has to be less than MaxPostBreakfac
One feature of the utility is that the lines will fade out with incoming bars, if they are near to the point that they do not fulfill the conditions mentioned above (e.g. line is broken and PostBreakfac gets too big). That makes it easier to differ the lines. So the next parameters are just for visual effects:
- LineColor sets the main color of the lines
- ColorFadefac represents the color intensity at the point the conditions are scraped through; 0 means main color, 1 means background color.
- FadeFac is similar to MinLenfac and sets the ratio when to start the fadeout.
The indicator works on all currency pairs and timeframes.
This indicator is very messy and impossible to delete from the charts once it has been installed! Even when I open a new chart, sometimes it appears even without having been installed. I now have to re-install MT4 in order to get rid of this indicator. Very bad coding skills!