Risk vs Reward dashboard

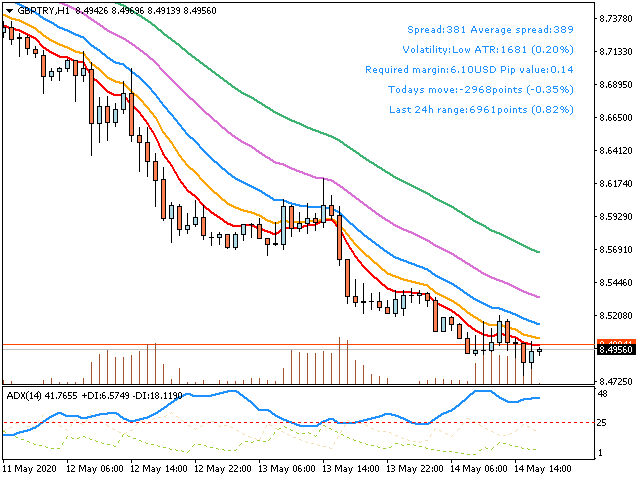
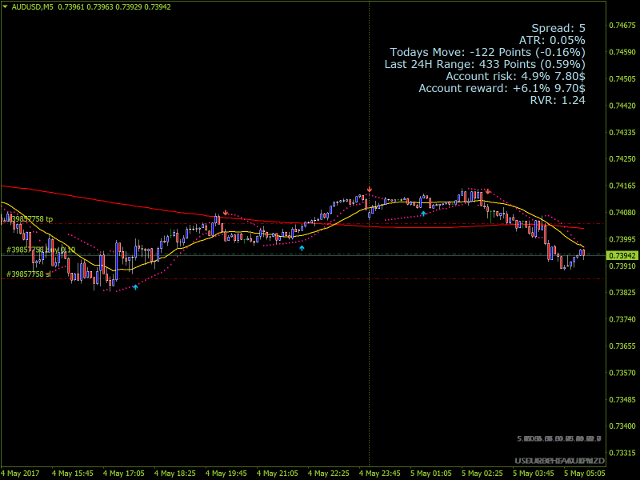
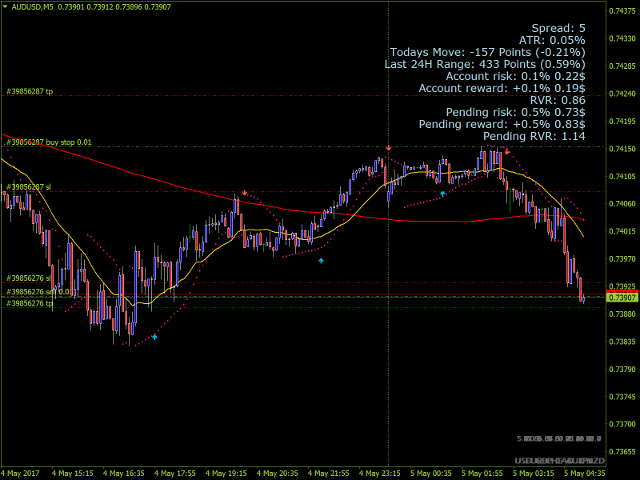
Tired of online risk calculators that you manually have to fill out?

This neat little dashboard instantly shows you, your risk, reward and risk vs reward as soon as you've sat your Stop-loss or Take-profit.

Works on both market and pending orders.

By far, my most used indicator when trading manually on mt4.


Advantages

  • Can handle multiple positions. And gives the total risk and reward for all positions on all manually placed or pending positions on the current chart.
  • Automatically recalculates to your main currency.
  • Automatically ignores robot trades. Which means you can trade manually on the same pair and account as robots.
  • Dashboard can be moved to any corner, letter size can be increase, row spacing can be changed and Dashboard position, relative to chosen corner.
  • Calculate risk on Hedges as well. But only simple ones with equal lot size and equal number of positions, on each side.
  • As a little bonus, I've included a function that draws "Nikos Mermigas" Set&Forget boxes, with this indicator.


Indicator Parameters

  • ATR Periods - The periods to calculate ATR in percent on
  • USE GMT to calculate todays move - Use GMT time to calculate the move of the day
  • Placing of the Dash board - Pick a corner for the Dashboard to appear in
  • Dashboard's y position - The vertical position from the chose corner in pixels
  • Dashboard's x position - The horizontal position from the chosen corner in pixels
  • Letters size - Pick a letter size
  • Space between lines - Pick a distance between lines . Current is optimized for high resolution screens
  • DashTextColor - Chose what color the text should be in
  • Paint boxes - Paints boxes of the average upper and lower range before midnight. (From Nikos Mermigas Set&Forget strategy)
  • Distance from box to lines(pips) - Distance from the box to paint the pending order lines.
  • BoxColor - Pick a color of the boxes
おすすめのプロダクト
If you ever wanted to know your local time (or NY time) at any bar on the chart without needing to waste time with mental calculations, look no further. This indicator creates a crosshair which you can drag anywhere on the chart and will show you the local time in a label on top of the time axis. Press the "c" key to show/hide the crosshair. Left click it to pick it up and drag anywhere, left click again let it go. You can't hide the crosshair without letting it go first. Time setting inputs
Eve
Oeyvind Borgsoe
This EA is fully automated and uses a highly intelligent system to enter the market and manage the positions with accuracy and precision.  The strategy is based on price action and the EA uses advanced filters to identify the most rewarding trading opportunities. Each potential trade is analyzed inside out and bad entries are excluded.  Eve EA is optimized for long-term stability and robustness. Benefits High spread protection Two level trailing stop  Smart Recovery Module FIFO compatible M
このプロジェクトが好きなら、5つ星レビューを残してください。                                                  機関が大きなボリュームを取引するので、それらが試してみることは珍しくありません 特定のパーセンテージレベルでポジションを守る これらのレベルは、あなたが使用できる自然なサポートと抵抗として役立ちます 取引を入力するか、ポジションに対する危険性を認識する。 このオシレータは、以下の比率の変動を示します。 日。 週。 月 日 クォーター。 生年月日 サポートと抵抗をトレースするサブウィンドウで。
FREE
This indicator is meant for Harmonic Traders, it helps them in identifying the formed patterns by analyzing the market past data, looking for Harmonic Patterns. The Patterns that this indicator can detect are: AB=CD Butterfly Gartely Crab Bat The indicator shows the following: The completed pattern, with the critical zone highlighted in Gray box The suggested 3 take profit levels (in green) The Suggested Stop Loss level (in Red) The formed pattern ratios can be checked by hovering the mouse on t
This is a key indicator and guideline for institutions and pension plans that look to take large positions and need to know whether they are getting in at a good price or not. It also allows them to get into positions without disrupting the market or elevating prices unnaturally with their large orders, resulting in unfavorable entry prices for them. The VWAP is a major level of importance that a lot of big traders and institutions monitor and is why you should be paying attention to it too.  Ba
Retracement Hunter This Indicator based on powerfull daily  levels . support and resistance, Buy / Sell entries which is more based on low risk  and high reward and winning ratio, Enter trade  when you get popup alert , book profit on target1, target 2, target3 levels, most of the trending days it will hit target3, but its always safe  to book partial at target1 or target2 Buy best entry when rule 1) look for Buy 2) Emas aligned less than 0.25 3) Main Ema aligned Buy , it will alert when all th
Please contact me at telegram  https://t.me/smartforex7 After purchasing SmartForex Indicator then Use This Indicator...................... SMART EXIT PROFIT LINE Indicator is very Helpful with SmartForex Indicator ........................................ SMART EXIT PROFIT LINE Indicator Attach with SmartForex Indicator after then Red Line Show Exit buy Profit , Green Line show Exit Sell Profit................
FREE
The indicator allows you to trade binary options. The recommended time frame is М1 and the expiration time is 1,2,3 minutes. The indicator suitable for auto and manual trading. A possible signal is specified as a arrows above/under a candle. You should wait until the candle closes! Arrows are not re-painted Trade sessions: TOKYO section (Half-end) Currency pairs: USD/JPY Working time frame: M1 Expiration time: 1,2,3 minutes. The indicator also shows good results when using the martingale strateg
FREE
The Arrow Scalper
Fawwaz Abdulmantaser Salim Albaker
1 (2)
Dear Friend..  I share with you this simple Expert Adviser .. it is full automatic  this Expert Adviser following the trend of the pair you install on or any stocks or indices , it is works like that: - when the trend on H4 chart show a start of up trend the expert will wait till the 15M & 1H charts show an up trend the EA will open a buy order directly , and do the same for down trend and open a sell order the buy or sell  order lot size and take profit and stop loss will measured manually  by
FREE
Индикатор Magneto Weekly Pro отображает: Недельные важные линии поддержки и сопротивления (выделены желтым, красным и синим цветами). Основные недельные цели (выделены белым цветом). Недельные паттерны возврата цены (обозначаются красными флажками). Применение индикатора Magneto Pro можно использовать и как дополнение к существующей стратегии, и как самодостаточную торговую стратегию. Данный продукт состоит из двух индикаторов, работающих на разных временных промежутках, и предназначен для скаль
Qv² Stdev is indicator developed based on standard deviation of prices and trading volume. Buy signals are indicated by arrows up. Sell signals are indicated by arrows down. An important detail is that the Qv² Volume has two bands, an upper and a lower, both of which serve as a target for take profit. It is recommended to use it in H1 Can be used in all pairs (I use in Gold). Good Business, in the trending market To find out some more about my work please click here
FerrerDCA
Leonardo Garcia Ferrer
Trading robot for EURUSD on the H1 timeframe. Despite working on this timeframe, it doesn't execute a trade per hour, only when the RSI and MACD coincide to give an up or down signal. After that, it performs DCA, i.e., it averages the entry prices. Using the same lot size. NO MARTINGALE. Backtested from January 2020 to October 2025 to monitor its performance during the pandemic. Target monthly 2% Full recomendly ECN or RAW account If you test on demo, please write me to receive it for free +
FREE
Auto Elliott Engine The Auto Elliott Engine is a tool designed for MetaTrader 4 that automates the identification, decomposition, and projection of price structures based on the Elliott Wave Theory. Powered by a pattern-recognition engine, this indicator processes price action to identify market configurations, translating data into structured scenarios. Key Features Multi-Degree Recognition: Analyzes price action across multiple fractal levels. From higher degrees, such as Supercycle or Cycle,
便利な取引のための14のインジケーターと補助ツール このユーティリティには、トレーダーの特定の行動に役立つ14の追加ツールが含まれており、   取引プロセスを簡素化し、高速化します。 私の  #1 Trade Manager をチェックしてください: 66以上の機能とインジケーターを含む  |   ご質問はこちら  まで モニターの解像度が異なるため、一部のユーザーはラベルが重なって表示されたり、小さすぎたりする場合があります。この問題が発生した場合は、 フォントサイズを調整できます: 入力変数の最初のパラメータです。 パターンの視覚的設定が可能なプロフェッショナルなプライスアクションインジケーター。 未来のバーのインジケーター。 任意の時間軸のろうそくの終了までのカウントダウン。 バーのサイズのインジケーター。 自動サポートとレジスタンスレベル。 自動フィボナッチレベル。 ギャップインジケーター。 潜在的な利益/損失のレベル。 1つのウィンドウで複数の時間軸を表示するユーティリティ。 グローバル取引セッションのインジケーター。 オープントレードの結果を計算するユーティリティ。 市場情
NO REPAINT ADVANCED CHART PATTERN INDICATOR By definition, a price ( chart)  pattern is a recognizable configuration of price movement that is identified using a series of  trendlines  and/or curves. When a price pattern signals a change in trend direction, it is known as a reversal pattern; a continuation pattern occurs when the trend continues in its existing direction following a brief pause. Advanced Chart Pattern Tracker is designed to find the MOST ACCURATE patterns. A special script is a
Fimathe Market Opening サマータイムにご注意ください XAUUSD の時間を 23 から 22 に変更してください Fimathe Market Opening は、市場のオープニング時に形成されるチャネルを基準として自動売買を行うために開発された Expert Advisor です。ローソク足の実体終値によるブレイクアウト確認(C1)と、最初の取引がストップロスで終了した後の構造的なリバーサルロジックを組み合わせて動作します。 本システムは、XAUUSD の公式オープニングを基準とした独自のオペレーショナルデイの中でのみ動作します。チャネル形成、ブレイクアウト確認、ポジション管理はすべてチャネルサイズに基づく客観的なルールに従って実行されます。 この戦略は完全に価格構造に基づいており、外部インジケーター、移動平均線、または主観的なフィルターは使用しません。すべての判断は価格の動きと事前に定義された構造ルールのみに基づいて行われます。 運用コンセプト このシステムは次の3つの要素を中心に構成されています。 オープニングチャネルの形成 ローソク足の実体終値によ
FREE
このプロジェクトが好きなら、5つ星レビューを残してください。 機関が大きなボリュームを取引するので、それらが試してみることは珍しくありません 特定のパーセンテージレベルでポジションを守る これらのレベルは、あなたが使用できる自然なサポートと抵抗として役立ちます 取引を入力するか、ポジションに対する危険性を認識する。 一般的に使用されるパーセンテージの例は、EURUSDの0.25%と0.50%です。 毎週、スクリーンショットでこの例を見ることができます。 このインジケータを使用すると、以下の割合の変動を描画することができます。 日。 週。 月 日 クォーター。 生年月日
FREE
Hello ! If you scroll in one chart, all charts will be scrolled If you change the time frame in one chart, it will change in all charts Of course, you can turn this feature on or off All the charts in which you want changes to be applied are specified through ID in the indicator settings You can scroll the charts of different time frames in two ways at the same time 1: Coordinated based on time That is, 1 hour candle is 60 candles one minute back 2: scroll in the form of number of candles That i
This Expert seeks price trends through the interaction of two SMA's. The main idea is to lose little and quickly and win slowly and a lot. Operational: When the faster moving average crosses above the slower moving average and the price is above the faster moving average, this is an entry signal to buy. When the price crosses below the faster moving average, this is a signal to close the trade. The same happens for sales entry and exit, but with the opposite logic. The best results were obt
The Market Structures Pro indicator finds and displays 5 (five) patterns of the Smart Money Concepts (SMC) system on the chart, namely: Break Of Structures (BoS)       Change of character (CHoCH) Equal Highs & Lows Premium, Equilibrium and Discount zones with Fibo grid High-high, Low-low, High-low and Low-high extremes Patterns are displayed for two modes - Swing and Internal and are easily distinguished by color on the chart. Internal mode features higher contrast colors, finer lines, and smal
Market Profile with Dashboard Indicator - Complete User Guide indicator Overview The Market Profile with Dashboard is a comprehensive trading analysis tool for MetaTrader 4 that displays market profile data, volume analysis, and key market structure information directly on your chart. This indicator helps traders identify significant price levels, market balance areas, and potential trading opportunities based on market profile theory. Core Components and Features Market Profile Display - Sh
Euro Gift (EURUSD M15) I am celebrating my birthday, so i will publish some EAs for FREE. This EA has been developed for EURUSD M15.  Strategy is based on ICHIMOKU indicator and has very little parameters - so its VERY ROBUST. It uses Stop pending orders with   ATR   Stop Loss . At 9:00 pm we are closing trading every Friday to prevent from weekly gaps. !!!Adjust these times to your broker time. Preset values are for UTC+2 only!!! For every candle the pending orders are modified to adapt the mar
FREE
Ska ZigZag BuySell
NKATEKO VUKOSI LEROY MASANGO
Ska ZigZag BuySell indicator determines the overbought and oversold regions within a trend. The indicator determines the overbought region by the candlestick high and the oversold region by the candlestick low. This indicator only gives signals with arrow and audible alerts each and every time when a new candlestick appear. To utilize the full strategy i recommend using "Ska ZigZag BuySell" together with "Ska ZigZag Line". The Ska ZigZag Line indicator is available for free. NOTE: Indicator is h
What Is a Pivot Point? A pivot point is a technical analysis indicator, or calculations, used to determine the overall trend of the market over different time frames. The pivot point itself is simply the average of the intraday high and low, and the closing price from the previous trading day. On the subsequent day, trading above the pivot point is thought to indicate ongoing bullish sentiment, while trading below the pivot point indicates bearish sentimen How to Use Pivot Points The very ess
トレードは確率のプロセスです。精密なロジックと厳格な規律こそが、Apexシリーズの戦略の核となる基盤です。 公式リアルタイム取引シグナル (MT5 旗艦口座) 戦略の長期的な安定性を示すため、当社の公式リアルタイム実績はMT5環境で運用されています。 MT4版は、これと全く同じコアロジックおよび取引アルゴリズムを共有しています。 シグナル 1 (Pepperstone): シグナルの詳細を表示 シグナル 2 (TMGM): シグナルの詳細を表示 製品設計コンセプト 自動売買において、ロジックの透明性は極めて重要です。Apex Origin MT4版は、安定性を追求するトレーダーのために開発されたアルゴリズムシステムです。数学的統計原理に基づき、リスク管理とシステム的な実行に焦点を当てながら、さまざまな相場環境においてロジックの整合性を維持することを目指しています。 高精度ヒストリカルデータによるバックテスト (2010 - 2026) MT4標準データの制限を補うため、本システムは 99%の高精度ティックデータ(Tick Data) を使用し、16年間にわたる詳細なテストを実施しまし
FREE
SX Supply Demand Zones accurately identifies and draws high-probability Supply and Demand zones using a sophisticated algorithm. Unlike traditional indicators that clutter your chart, this indicator is designed with a focus on performance and a clean user experience. New Unique Feature: Interactive Legend System What truly sets this indicator apart from everything else is the Interactive Control Legend. You have a professional dashboard directly on your chart that allows you to: Show/Hide: Ins
FREE
シンプルだが効果的。 反転インジケーター - それは何か? スーパートレンドのロジックと指数曲線技術を組み合わせたトレンドフォロー型オーバーレイインジケーターです。トレンドの方向を検知し、チャート上に動的なチャネルを描画し、トレンドが反転した際にリアルタイムでアラートを送信します。 仕組み ATRとスーパートレンド係数を用いて指数ベースラインを算出。価格がこのベースラインを上抜け/下抜けした時点でトレンド反転を確認。緑矢印は買いトレンド開始、赤矢印は売りトレンド開始を示す。 特徴: ATRベースの動的チャネル付き指数トレンドベースライン 緑/赤で色分けされたトレンドラインと塗りつぶしチャネル トレンド反転時の買い/売り矢印シグナル 内蔵アラート:ポップアップ、プッシュ通知、メール、サウンド 重複アラート防止(1バーあたり1アラート) 完全カスタマイズ可能:色、線幅、矢印サイズ、チャネル幅 遅延のないクリーンなチャートオーバーレイ 入力パラメータ: 指数係数、スーパートレンド係数、ATR期間、チャネル幅 オン/オフ切り替え:チャネル塗りつぶし、矢印、各アラートタイプ 全視覚
FREE
The indicator informs when the current bar closes and a new bar opens. TIME is an important element of trading systems. BarTimerPro indicator helps you CONTROL THE TIME . Easy to use: place on the chart and set “alarms” if it necessary. In the tester, the indicator does not work. See the Lite version BarTimerPro-Lite Key Features 4 operating modes: Shows the time elapsed since the opening of the current bar (11) Shows the time remaining until the current bar closes (11) Indicator Updates Every
FREE
The Market Maker indicator focuses on key levels as minimum, maximum, opening and closing of important time frames. An attentive observation of these levels will enable you to identify the proper direction of the trend. On these levels the Market Makers try to make a very hunt of Stop Loss. We recommend to use Daily values on H1 chart, Weekly values on H4 chart and Monthly values on D1 charts. Use it setting all three time frames on the same chart and you will see that these levels will be a gre
Alert Up Down MT4
William Oswaldo Mayorga Urduy
アラートアップ-メタトレーダー5のダウン このインジケーターは、価格がUPラインとDOWNラインの間のゾーンを離れたときにアラートを生成します。 次のようなさまざまなタイプのアラートを生成できます。 >サウンド >メッセージボックス >エキスパートボックスのメッセージ >メール(以前に構成済み) >プッシュ通知(以前に構成済み) 線は、線のプロパティからではなく、インジケータのプロパティから構成する必要があります。これは、線のプロパティから行うと、フィノナッチが影響を受ける可能性があるためです。 設定の中で、色、線のスタイル、幅を変更できます。 線は、線のプロパティからではなく、インジケータのプロパティから構成する必要があります。これは、線のプロパティから行うと、フィノナッチが影響を受ける可能性があるためです。 設定の中で、色、線のスタイル、幅を変更できます。
このプロダクトを購入した人は以下も購入しています
Scalper Inside PRO – Since 2020. An exclusive indicator that utilizes an innovative algorithm to swiftly and accurately determine the market trend. The indicator automatically calculates opening, closing, and profit levels, providing detailed trading statistics. With these features, you can choose the most appropriate trading instrument for the current market conditions. Additionally, you can easily integrate your own arrow indicators into Scalper Inside Pro to quickly evaluate their statistics
Gann Made Easy は、ミスター・ギャンの理論を使用した取引の最良の原則に基づいた、プロフェッショナルで使いやすい外国為替取引システムです。 W・D・ガン。このインジケーターは、ストップロスとテイクプロフィットレベルを含む正確な買いと売りのシグナルを提供します。 PUSH通知を利用して外出先でも取引可能です。 ご購入後、取引方法の説明と優れた追加インジケーターを無料で入手するには、私にご連絡ください! おそらく、ギャンの取引手法についてはすでに何度も聞いたことがあるでしょう。通常、ギャンの理論は初心者のトレーダーだけでなく、すでにある程度の取引経験がある人にとっても非常に複雑なものです。なぜなら、ギャンの取引手法は理論的にはそれほど簡単に適用できるものではないからです。私はその知識を磨き、最良の原則を私の外国為替インジケーターに組み込むために数年を費やしました。 このインジケーターは非常に簡単に適用できます。必要なのは、それをチャートに添付し、簡単な取引推奨事項に従うだけです。このインジケーターは常に市場分析の仕事を行い、取引の機会を探します。適切なエントリーポイントを検出す
M1 SNIPER は使いやすいトレーディングインジケーターシステムです。M1時間足向けに設計された矢印インジケーターです。M1時間足でのスキャルピングのためのスタンドアロンシステムとして、また既存のトレーディングシステムの一部としても使用できます。このトレーディングシステムはM1時間足での取引に特化して設計されていますが、他の時間足でも使用できます。元々、この手法はXAUUSDとBTCUSDの取引用に設計しましたが、他の市場においても役立つと考えています。 インジケーターのシグナルは、トレンドの方向と逆方向に取引できます。インジケーターのシグナルを利用して両方向に取引するのに役立つ特別な取引テクニックをご紹介します。この手法は、特別な動的なサポートとレジスタンスの価格帯を利用することに基づいています。 ご購入後、M1 SNIPER矢印インジケーターをすぐにダウンロードできます。さらに、M1 SNIPERツールのすべてのユーザーに、以下のスクリーンショットに表示されているApollo Dynamic SRインジケーターを無料で提供しています。この2つのインジケーターを組み合わせることで
ゴールドラッシュ・トレンド・アロー・シグナル ゴールドラッシュ・トレンド・アロー・シグナル 指標は、XAU/USDにおける高速・短期スキャルパー向けに最適化された、正確でリアルタイムのトレンド分析を提供します。 1分足専用に設計されたこのツールは、明確なエントリーポイントを示す方向矢印を表示し、スキャルパーが変動の激しい市場状況でも自信を持って取引できるよう支援します。 この指標は、PRIMARY(主要)とSECONDARY(補助)のアラート矢印で構成されています。PRIMARYシグナルは、トレンドの方向転換を示す白と黒の方向矢印であり、SECONDARYシグナルは、PRIMARY矢印が示す方向を確認し、潜在的なエントリーポイントを示す青と赤の矢印です。 注意:トレンド方向の変化後にPRIMARYアラート矢印が1つだけ表示される場合、複数のSECONDARY青/赤矢印が表示される点に注意が必要です。SECONDARYシグナルは、シグナル基準を満たす任意のローソク足後に表示されます。したがって、長期的なトレンド移動の場合、画面に多くのSECONDARY矢印が表示されます(添付の
The indicator is built on a non-standard Zig Zag, it draws accumulations after which if the price leaves this zone and a test of this zone occurs, then a sound signal is given and an arrow appears - after the test candle closes.The indicator does not redraw its signals, it is very easy to use, there are only three settings 1- this is the zig zag parameter 2- this is the minimum price exit from the zone 3- this is the maximum price exit from the zone. The lower the parameter for Zig Zag, the more
PRO Renko Systemは、特別にRENKOチャートを取引するために設計された高精度の取引システムです。 これは、様々な取引商品に適用することができる普遍的なシステムです。 システムは効果的に正確な逆転信号へのアクセスを与えるいわゆる市場の騒音を中和する。 表示器は非常に使いやすく、信号の生成に責任がある1つの変数だけがあります。 あなたは簡単にお好みの任意の取引ツールとレンコバーのサイズにツールを適応させることができます。 私はいつもあなたが私のソフトウェアで収益性の高い取引を支援するために余分なサポートを提供する準備ができています! 私はあなたに幸せで収益性の高い取引をしたいです! ご購入後にご連絡ください! 私はあなたに私のレンコチャートジェネレータを送信します。 私はまた、私の個人的な推奨事項やシステムの他のモジュールを無料で共有します!
After purchase, contact me privately to receive 1 month of free testing with EA Forex Proton! This advanced MT4 trading robot automatically executes signals from any MT4 indicator, including Market Makers. The latest version also includes AI integration, allowing each trade signal to be analyzed using Artificial Intelligence. Live Signal with EA Forex Proton: Click here Market Makers is a powerful price action trading system designed to identify high-probability Buy and Sell opportunities based
チャートを構成し、周期的な価格変動を識別するテクニカル指標。 どのチャートでも動作します。 いくつかの種類の通知。 グラフ自体に追加の矢印があります。 履歴を再描画せずに、キャンドルのクローズに取り組みます。 M5以上のTFを推奨します。 パラメータの使用と設定が簡単です。 異なるパラメータを持つ 2 つのインジケーターを使用する場合、他のインジケーターなしで使用できます。 入力パラメータは2つあります 周期性と信号持続時間 これら 2 つのパラメータは、チャート構造の処理を扱います。 Cyclicity - 反転サイクルが変化する頻度を調整し、サイクルを滑らかにします。 Signal duration - 最小数では価格変動の衝動を検出し、最大数では長期的なトレンドの動きを検出します。
現在40%オフ! 初心者やエキスパートトレーダーに最適なソリューション! このインジケータは、独自の機能と秘密の数式を組み込んだ、ユニークで高品質かつ手頃な価格のトレーディングツールです。たった1枚のチャートで28の通貨ペアのアラートを表示します。新しいトレンドやスキャルピングチャンスの引き金となるポイントを正確に把握することができるので、あなたのトレードがどのように改善されるか想像してみてください! 新しい基本的なアルゴリズムに基づいて構築されているため、潜在的な取引の特定と確認がより簡単になります。これは、通貨の強さや弱さが加速しているかどうかをグラフィカルに表示し、その加速のスピードを測定するためです。加速すると物事は明らかに速く進みますが、これはFX市場でも同じです。つまり、反対方向に加速している通貨をペアにすれば、利益を生む可能性のある取引を特定することができるのです。 通貨の勢いを示す縦の線と矢印は、あなたの取引の指針となるでしょう。 ダイナミックマーケットフィボナッチ23レベルはアラートトリガーとして使用され、市場の動きに適応します。もしインパルスが黄色のトリガ
Advanced Supply Demand
Bernhard Schweigert
4.91 (300)
現在40%オフ 初心者にもエキスパートトレーダーにも最適なソリューション このインジケーターは独自の機能と新しい公式を多数内蔵しており、ユニークで高品質かつ手頃な取引ツールです。このアップデートでは、2つの時間枠ゾーンを表示できるようになります。より長いTFだけでなく、チャートTFとより長いTF(ネストゾーンを表示)の両方を表示できます。すべてのSupply Demandトレーダーの皆さんのお気に召すはずです。:) 重要情報の公開 Advanced Supply Demandの可能性を最大化するには、 https://www.mql5.com/ja/blogs/post/720245 にアクセスしてください。   エントリーまたはターゲットの正確なトリガーポイントを正確に特定できれば取引がどのように改善されるか想像してみてください。新しい基盤となるアルゴリズムに基づいて構築されているため、買い手と売り手の間の潜在的な不均衡をさらに簡単に特定できます。これは、最も強い需要と供給のゾーンと、過去のパフォーマンス(古いゾーンを表示)がグラフィカルに表現されるためです。これらの機能は、最適な
まず第一に、この取引インジケーターは再描画されず、再描画されず、遅延しないことを強調する価値があります。これにより、手動取引とロボット取引の両方に理想的なものになります。 ユーザーマニュアル:設定、入力、戦略。 アトミックアナリストは、価格の強さとモメンタムを利用して市場でより良いエッジを見つけるためのPA価格アクションインジケーターです。ノイズや誤ったシグナルを除去し、取引ポテンシャルを高めるための高度なフィルターを備えています。複雑なインジケーターの複数のレイヤーを使用して、アトミックアナリストはチャートをスキャンし、複雑な数学的計算をシンプルなシグナルと色に変換します。これにより、どのような初心者トレーダーでも理解して使用し、一貫した取引の決定を行うことができます。 「アトミックアナリスト」は、新規および経験豊富なトレーダー向けにカスタマイズされた包括的な取引ソリューションです。プレミアムインジケーターとトップノッチの機能を1つの取引戦略に組み合わせ、すべてのタイプのトレーダーにとって汎用性のある選択肢にします。 デイリートレーディングとスキャルピング戦略:高速で正確な
現在40%オフ 初心者やエキスパートトレーダーに最適なソリューション! このインジケーターは、独自の機能と新しい計算式を取り入れた、ユニークで高品質、かつ手頃な価格のトレーディングツールです。たった1枚のチャートで28の為替ペアの通貨強度を読み取ることができます。新しいトレンドやスキャルピングチャンスの引き金となるポイントを正確に特定することができるので、あなたのトレードがどのように改善されるか想像してみてください。 ユーザーマニュアルはこちら  https://www.mql5.com/en/blogs/post/697384 これが最初の1本、オリジナルだ! 価値のないクローンを買わないでください。 特別な サブウィンドウの矢印で強い通貨の勢いを表示 GAPがあなたのトレードを導く! 基準通貨や気配値が売られすぎ・買われすぎのゾーン(外相フィボナッチレベル)にあるとき、個別チャートのメインウィンドウに警告表示。 通貨がレンジの外側から反落した場合、プルバック/リバーサルのアラート。 クロスパターンの特別なアラート 複数の時間枠を選択可能で、トレンドを素早く確認できます
Apex Edge No Repaint MT4対応、プロ仕様のリペイントしないトレーディングインジケーター Apex Edge No Repaintは、リペイントする矢印の煩わしさから解放され、明確なシグナルを求める真剣なFXおよび仮想通貨トレーダー向けに設計された、高品質でクリーンかつ信頼性の高いトレーディングツールです。 主な機能: 100% リペイントなし – チャートに表示されたシグナルは固定されたままです デュアルシグナルシステム:早期のチャンスを提供するRAWシグナルと、高確率で確定したエントリーを提供するCONFシグナル シンプルなワンクリック切り替えボタン:RAW ON/OFFとCONF ON/OFF トレンド、強度パーセンテージ、シグナルステータスを表示するプロフェッショナルなリアルタイムダッシュボード インスタントアラート:ポップアップ、サウンド、メール通知 すべてのCONFシグナルにTP1、TP2、ストップロスレベルを自動描画 視覚的に分かりやすい、色分けされた矢印: ライムグリーン → CONF買い 赤 → CONF売り ドジャーブルー → RAW買
このインジケーターは、反転ポイントと価格戻りゾーンを正確に表示します。     主要プレーヤー 。新たなトレンドが形成される場所を把握し、最大限の精度で意思決定を行い、すべての取引をコントロールします。 TREND LINES PRO インジケーターと組み合わせることで、その潜在能力を最大限に発揮します。 VERSION MT5 インジケーターが示す内容: 新しいトレンドの始まりに活性化する反転構造と反転レベル。 リスクと報酬の比率を最小限に抑えた利益 確定 と 損失停止の レベルの表示     RR 1:2   。 インテリジェントな削減ロジックによるストップロス。 指定されたインジケーターから 2 つのトレンド タイプの反転パターンを表示します。 指標: トレンドを追う   TREND LINES PRO   (世界的なトレンドの変化) TREND PRO   (クイックトレンド変更) シンプルで効果的   スキャナー   リアルタイムトレンド(新機能)。 マルチタイムフレームのインストゥルメント フィルタリング。 画面   利益     LOGIC AI信号の後。 当日プラス方
このインジケーターは、エリオット波動理論と組み合わせて作動し、2つの方法で使用されます: 自動モード: このモードでは、インジケーターがチャート上の全ての5つのモーティブ波を自動的に検出し、予測とポテンシャルな逆転ゾーンを提供します。また、アラートやプッシュメッセージを生成する能力も備えています。この自動機能により、エリオット波動パターンの識別と分析のプロセスが効率化されます。 手動モード: このオプションは、エリオット波動理論を手動で扱いたいトレーダー向けです。9つの段階を使用して波を描画することができます。各段階は、表示された後に描画されたラインを調整して個別に定義できます。この機能により、手動で波を描画するプロセスがより効率的になります。重要な点として、すべての描画データが将来の参照のためにプラットフォームのデータフォルダに保存されることに注意してください。 パラメータ: Name: インジケーターの名前。 Use_System_Visuals: インジケーターのテーマを有効または無効にして、取引プラットフォーム全体の外観に合わせます。 Explain_Comment: 波の番号
Auto Optimized Parabolic RSI: 高度な3Dモメンタムエンジン ほとんどのリテール向けインジケーターは、市場のボラティリティが変化した瞬間に破綻する静的な入力値に依存しているため、失敗に終わります。Auto Optimized Parabolic RSIは、自らの数学的優位性を継続的に再計算することで「インジケーターの陳腐化」問題を解決し、機関投資家レベルの定量的適応力をMT5ターミナルに直接もたらします。 最大の強み: カスタムインメモリ3D最適化   標準的な自動最適化ツールは、インジケーターの呼び出しで端末に過負荷をかけるため、頻繁にMT5プラットフォームをフリーズさせます。本ツールは、このボトルネックを完全に回避しています。RAMベースのカスタムネイティブ計算機を内蔵した内部エンジンは、チャートを読み込んだりタイムフレームを変更したりするたびに、超高速の3Dグリッド探索を実行します。RSI期間(頻度)、SARステップ(加速度)、SAR最大値(制限速度)を同時にスイープし、プラットフォームを遅延させることなく、数万通りものパラメーターの組み合わせを絶対的
このインジケーターを購入すると、プロ仕様のトレードマネージャーを無料で差し上げます。 まず第一に、このトレーディングシステムがノンリペイント、ノンリドロー、ノンラグのインジケーターであることを強調する価値がある。これにより、手動取引とロボット取引の両方に理想的なものになっています。 オンラインコース、マニュアル、プリセットのダウンロード。 「スマートトレンドトレーディングシステム MT5」は、新規および経験豊富なトレーダー向けにカスタマイズされた包括的なトレーディングソリューションです。10以上のプレミアムインジケーターを組み合わせ、7つ以上の堅実なトレーディング戦略を備えており、多様な市場状況に対応する多目的な選択肢となっています。 トレンドフォロー戦略:トレンドを効果的に乗り越えるための正確なエントリーとストップロス管理を提供します。 リバーサル戦略:潜在的なトレンドの反転を特定し、トレーダーがレンジ相場を活用できるようにします。 スキャルピング戦略:高速で正確なデイトレードおよび短期取引のために設計されています。 安定性:すべてのインジケーターはノンリペイント、ノンリドロー、ノ
「 Dynamic Scalper System 」インジケーターは、トレンド波の中でスキャルピング取引を行う手法のために設計されています。 主要通貨ペアと金でテスト済みで、他の取引商品との互換性があります。 トレンドに沿った短期的なポジションオープンのシグナルを提供し、追加の価格変動サポートも提供します。 インジケーターの原理 大きな矢印はトレンドの方向を決定します。 トレンド波の中では、小さな矢印の形でスキャルピングシグナルを生成するアルゴリズムが機能します。 赤い矢印は強気方向、青い矢印は弱気方向です。 トレンドの方向には敏感な価格変動ラインが描かれ、小さな矢印のシグナルと連動します。 シグナルは次のように機能します。適切なタイミングでラインが現れるとエントリーシグナルが形成され、ラインが開いている間はポジションが保持され、完了すると取引が終了します。 推奨される動作時間枠はM1~H4です。 矢印は現在のローソク足に形成され、次のローソク足が開いている場合は、前のローソク足の矢印は再描画されません。 入力パラメータ Trend Wave Period - トレンド方向
Scalping Lines System - は、M1-H1の時間枠で金(XAUUSD)を取引するために特別に設計されたスキャルピング取引システムです。 トレンド、ボラティリティ、買われ過ぎ/売られ過ぎの市場分析のための指標を1つのオシレーターに統合し、短期的なシグナルを識別します。 シグナルラインの主要な内部パラメータは事前​​に設定されています。 一部のパラメータは手動で調整可能です。「トレンド波の持続時間」(MAトレンドを使用してトレンド方向の一連のシグナルの持続時間を調整)と「シグナルラインにスムージングを適用」(シグナルラインの生成を調整)です。 始値でシグナルラインを計算する際、インジケーターは再描画されません。他の価格では、シグナル矢印がちらつく場合があります。 シグナルはローソク足が閉じた後に表示され、複数のアラートタイプが用意されています。 推奨される時間枠:M1-M5-M15-M30-H1。 このインジケーターは元々金の取引用に設計されましたが、スプレッドの低いボラティリティの高い資産(BTCや暗号通貨、銀、株価指数CFD(ナスダック100など))の取引にも適
地震計マーケット クエイク検出器。 Description in English : https://www.mql5.com/en/market/product/113869?source=Site+Market+Product+Page#description How to use the Seismograph : https://www.mql5.com/en/market/product/113869#!tab=comments&page=2&comment=52806941 Create an EA : https://www.mql5.com/en/market/product/113869#!tab=comments&page=3&comment=52816509 どのような取引方法であれ、流動性の低い市場への参入は避けたいものです。 地震計は、市場が上昇する前に市場に参入する適切なタイミングに役立ちます。 しかし、忙しいはずの市場時間帯にエントリーするようにしたにもかかわらず、流動性の低い市場に閉じ込められてしまう人が多いのが実情です。 数時間待った後、
KURAMA GOLD SIGNAL PRO(MT4版)— 7層フィルター搭載 XAUUSD完全トレードシステム リペイントなし リドローなし ラグなし すべてのサインは確定後に変わりません。 購入者限定特典:買い切りライセンスをご購入いただいた方に、AI Zone Radar($59相当)を無料プレゼント+PDFマニュアルをお渡しします。購入後にMQL5でメッセージをお送りください。 AI Zone Radar: https://www.mql5.com/en/market/product/175834 あなたの問題 — そしてその解決策 ゴールドは1日$30〜$50動く。チャンスがあるのは分かっている。でもこういう経験はないか: — エントリーが早すぎて、$10逆行してから思った方向に動く — MAタッチのたびに入って、半分は負ける — TP/SLの基準がないから、持ちすぎるか早すぎる決済をする — 動かない時間帯にトレードして消耗する KURAMA GOLD SIGNAL PROは、これらすべてを解決するために作られた。1つのフィルターで
Trend Screener
STE S.S.COMPANY
4.79 (95)
トレンドインジケーター、1つのツールに組み込まれたすべての重要なトレンド機能を備えたトレンドトレーディングとフィルタリングのための画期的なユニークなソリューション! これは、すべてのシンボル/商品(外国為替、商品、暗号通貨、インデックス、株式)で使用できる100%再描画されていないマルチタイムフレームおよびマルチ通貨インジケーターです。 期間限定オファー: サポートおよびレジスタンス スクリーナー インジケーターは、たった 65 ドルで永久的にご利用いただけます。(元の価格 250 ドル) (オファー延長) トレンドスクリーナーは、チャート内のドットで矢印トレンドシグナルを提供するインジケーターに続く効率的なインジケーターです。 トレンド分析インジケーターで使用できる機能: 1.トレンドスキャナー。 2.最大利益分析を備えたトレンドライン。 3.トレンド通貨強度メーター。 4.アラート付きのトレンド反転ドット。 5.アラート付きの強いトレンドドット。 6.トレンド矢印 毎日の分析例、毎日のシグナルパフォーマンス...など、トレンドスクリーナーインジケーターを使用して、ここで見つけること
Super Signal – Skyblade Edition プロ仕様のノンリペイント / ノーラグ・トレンドシグナルシステム。卓越した勝率を実現 | MT4 / MT5 対応 1分足、5分足、15分足などの低い時間足で最も効果を発揮します。 主な特徴: Super Signal – Skyblade Edition は、トレンド取引に特化したスマートなシグナルシステムです。マルチレイヤーのフィルターロジックを用いて、明確な方向性と実際のモメンタムに支えられた強力なトレンドのみを検出します。 このシステムは 天井や底を予測するものではありません 。次の3つの条件がすべて満たされた場合にのみシグナルを発生させます: 明確なトレンド方向 モメンタムの増加 健全なボラティリティ構造 市場セッションに基づく流動性分析と組み合わせることで、シグナルの精度とタイミングがさらに向上します。 シグナルの特性: すべての矢印シグナルは 100% 非リペイント / 遅延なし 一度出現したシグナルは固定され、点滅・消失しません チャート上の矢印、情報パネル、ポップアップ通知、音声アラート、プッシュ通知
CRYSTAL HEIKIN ASHI SIGNALS MT4 Professional Trend Detection Indicator with Smart Entry Signals See the Trend. Catch the Move. Trade with Confidence. The professional Heikin Ashi indicator built for traders who want clarity, precision, and EA-ready signal automation. WHAT IS CRYSTAL HEIKIN ASHI SIGNALS? Crystal Heikin Ashi Signals is a professional-grade MetaTrader 4 indicator that combines pure Heikin Ashi candle visualization with an advanced momentum-shift detection system. Designed for both
NextCandlePredictor インジケーター NextCandlePredictorは、再描画しない、色が変わらない、動かない、消えない、遅延がないアラート付きのシグナルインジケーターです。あらゆるタイムフレームで次のキャンドルまたはその次のキャンドルの方向を識別するのに役立ちます。ニューヨーク、ロンドン、またはその両方の重なり合う高ボラティリティ市場に特にお勧めです。 主な特徴: タイムフレームの汎用性: M1からH1以上のあらゆるタイムフレームで迅速かつ正確なシグナルを提供します。 明確な買い/売りシグナル: ADXのDI+とDI-ラインを使用して明確な買いと売りのシグナルを生成し、最良のトレード判断を下せるようにします。 直感的な視覚化: シグナルはチャート上に緑色(買い)と赤色(売り)の矢印で直接表示され、迅速かつ簡単に読み取れます。 カスタマイズ可能な設定: 分析するバーの数とアラートオプションを好みとトレード戦略に応じて調整できます。使用するTFに応じた提案表を以下で確認してください。 即時およびオプションのキャンドル終了時アラート: デフォルトでは、ADX条件が
FullScalping は、あらゆる市場で 継続的なスキャルピングエントリー を生成するように特別に設計された 再描画なし、後方描画なし のインジケーターです。絶え間ないアクションを求める積極的なトレーダーに最適です! 独占情報とアップデートを入手するには、チャンネルに参加してください: https://www.mql5.com/en/channels/forexnewadvisor ほぼすべてのローソク足 でシグナルを出し、トレンドを確認するか、重要なリトレースメントをシグナルします。常にあなたを導くレーダーのようなものです。 どのように機能しますか?非常にシンプルです: 赤い矢印 売り 取引に入る。 青い矢印 買い 取引に入る。 常に一般的なトレンドの方向に取引し、 取引ごとに15〜20ピップ を積極的にターゲットにし、急激な市場の反転の前に素早く退出します。 シグナルは 継続的 なので、取引機会が尽きることはありません。目標は以下を使用して 集中的なスキャルピング を実行することです: 高ロット 低スプレッド(左下隅に表示) 最後のトレンド変化の近くに配置された
Special offer : ALL TOOLS , just $35 each! New tools   will be   $30   for the   first week   or the   first 3 purchases !  Trading Tools Channel on MQL5 : Join my MQL5 channel to update the latest news from me Fibonacci Confluence Toolkit Multi-Timeframe は、プロのトレーダー向けに設計された高度な技術的分析ツールで、主要な市場シグナルとパターンを組み合わせて潜在的な価格反転ゾーンを特定するのに役立ちます。タイムフレームセレクターのダッシュボードを通じたマルチタイムフレーム表示機能により、このツールキットは市場のダイナミクスを包括的かつ洞察に満ちた視点で提供し、正確かつタイムリーなトレーディング判断を可能にします。 MT5バージョンの詳細は:  Fibonacci Confluence Toolkit MT5 Multi Timefr
Apollo SR Master は、サポート/レジスタンスゾーンを利用した取引をより容易かつ確実にする特別な機能を備えたサポート/レジスタンスインジケーターです。このインジケーターは、ローカル価格の高値と安値を検出することで、タイムラグなしでリアルタイムにサポート/レジスタンスゾーンを計算します。そして、新たに形成されたSRゾーンを確認するために、インジケーターは特別なシグナルを表示します。このシグナルは、SRゾーンを実際の売りまたは買いシグナルとして考慮して使用できることを示します。この場合、SRゾーンの強度が高まり、SRエリアからの取引が成功する確率も高まります。これがこのインジケーターの基本的な考え方です。 SRゾーンは、ストップロスとテイクプロフィットの設定を容易にします。シグナルの方向に応じて、SRゾーンの上または下のスペースをストップロスとして設定できます。さらに、反対側のSRゾーンは、潜在的なテイクプロフィットエリアとして設定できます。 また、Apollo SRマスターインジケーターをご利用のすべてのユーザーには、「Apollo Price Action System」
Trend Scanner PRO First of all, it’s worth emphasizing that this trading system is 100% Non-Repainting, Non-Redrawing, and Non-Lagging , which makes it ideal for both   manual   and   algorithmic   trading setups. Online course, user manual, and downloadable presets included. The Trend Scanner Dashboard is a professional   multi pair scanner   that analyzes multiple symbols and timeframes at once, giving you an instant   market scanner   view of the real trend direction. Instead of switching ch
Trend Sniper Super Indicator is one of the best indicator which can provide you will perfect signals for short term and long term trades. This indicator is suitable for both scalping and swing trading strategies. The indicator is over 85% accurate. It uses terminal Message Alerts, Emails and Push notifications to your mobile device to inform you about the new trading opportunities and it will calculate the take profit and stop loss level for you. All you will need to do is to place a trade. Subs
作者のその他のプロダクト
Multi currency and multi timeframe scanner. Scans all instruments in "market watch" and gives either pc-alert or push-notification to the phone on a breakout. A breakout is by default defined as when a candle becomes longer than three ATR with a period of 300. If you have the need for a custom buildt scanner, to scan for your particular setup. Please add a personal jobb under the Freelance section. Functionality Has spread filter , to not open stupid mega spread crypto currency charts. Has lo
FREE
ATR is an excellent indicator to visualize if volatility is increasing or decreasing. But what if you want to compare the volatility to another pair or instrument? Since each pair with different quote currency has different pip value, the output of the ATR doesn't really say that much. Comparing pairs to other instruments is even harder.  What you as a trader care about is how much the pair has moved up or down in percentage, therefore normalizing ATR to percent would make things much easier.  T
FREE
Lotsize panel
Cristian Eriksson
5 (4)
Compliement your normal MT5 Buy/Sell panel with this automatic lot size panel. This product is free without any limitations. There will be a pro verision later with additional functionality, but my motto is to always have awesome free products. It automatically places the stop and sizes the lot according to the given ATR for risk. You have to try it to experience it! Now I can't trade manually without it. It's turned out to be much more intuitive than I would think before creating it. There's
FREE
It is is your personal risk guard. Drop it on any chart on your VPS or trading computer and it will guard your total risk in any pair or asset and make sure the sum of all stops is within your risk. If you happened to exceed the risk, in a split second this EA will calculate the exact position for the combined risk of all open positions and place all stops at the exact same spot. If you open a new position with another lot size . No problem, all stoplosses will automatically adjust. Tired of man
FREE
Action Scanner
Cristian Eriksson
5 (1)
Action Scanner is a market scanner. It’s yet another product in my "Can’t trade with out it" series. Do you want to know what is moving right now? Action Scanner  scans your watchlist and opens the 10 currently most moving charts. You can chose between, most moving in points, most moving in your account currency(if you were to trade it with a standard lot size 1.00) and most moving in percentage.  The standard version is a complete tool with no limitations.  However the pro version has additiona
FREE
Range bands works the same way as Bollinger bands except that they are self adapting, with range trading in mind. Unless you are familiar with Bollinger bands, it is a standard deviation indicator that is based around the concept that when price deviates to quickly from the average, it's going to encounter resistance. This is true for all period settings, since standard deviation 2 or 3 is an extreme on any data. This indicator automatically chooses the period that is currently most suitable for
EA based on a standard RSI indicator accompanied by an advanced Self Optimizer. A carefully crafted EA that self-optimizes on any pair and any time frame, to give you the best RSI settings for Reverse  or Breakout trades. It also self-optimizes on what time of day to trade if you wish. It can also be set to only optimize on that same hour, for every day in the history. It's the ultimate tool for those that wish to have a powerfull RSI trader in their arsenal, to just drop on the chart. The ba
Action Scanner is a market scanner. It’s yet another product in my "Can’t trade with out it" series. Do you want to know what is moving right now? Action Scanner  scans your watchlist and opens the 10 currently most moving charts. You can chose between, most moving in points, most moving in your account currency(if you were to trade it with a standard lot size 1.00) and most moving in percentage.  The standard version is a complete tool with no limitations.  However the pro version has additiona
Are you accidently making mistakes with your stoplosses, you thought you were risking 5% but you actually risked 15%? Are you causing yourself unncessary drawdowns by moving the sl too many times? Don't worry this ea has your back, it lies in the background and always watches your risk. No matter how many orders you have open in both directions it will make sure you stop out at your set risk percent. It also removes all stoplosses and targets in the case of a full hedge situation. The same as Ri
Multi currency, self healing, user adaptive, zone recovery system. Here's a better implementation of the zone recovery system.  You've probably noticed, with other zone recovery systems, that the zone sooner or later ends up in the worst possible range.  This EA will let you adjust the zone size on the fly (while you're trading), and move the other side on the outside of the range, if that were to happen. Did you delete or exit orders by mistake? No problem this EA also compensates user mishap
I created an indicator inspired by the "Wicks don´t lie" community on Youtube. It let's you see zones from other timeframes, and lets you keep a zone from a higher timeframe when you go to lower time frames. It operates by creating zones wherever the price has previously turned and not been retested again. This makes it easier to know where to expect a possible hick-up while going with a breakout, or where the price might make a reversal. The indicator also continues to add zones out from the cu
An imbalance indicator that marks imbalance on the chart with zones and gives the amount of imbalance as an oscillator value. There's one line for the amount of short imbalance, one line for the long imbalance and the combined imbalance as a thicker line. The combined imbalance goes above 0 if there's more imbalance above than below the current price and vice versa. The blue thicker line, shows (imblance above - imbalance below). The greeen dotted line shows imbalance above The red dotted line s
This Pro version of the LotSizePanel let's you set the stoploss with a line. Instantly the ea will calculate the lotsize based on where you drag the line on the chart. Press the "Show Line" button again, and the line dissappears and the ea reverts back to calculating the lot size from an ATR based stoploss again. I can't see how I would ever trade manually without this panel again. Remember that autotrading needs to be turned on to place orders with the buttons.
フィルタ:
レビューなし
レビューに返信