Range Bands

Range bands works the same way as Bollinger bands except that they are self adapting, with range trading in mind.

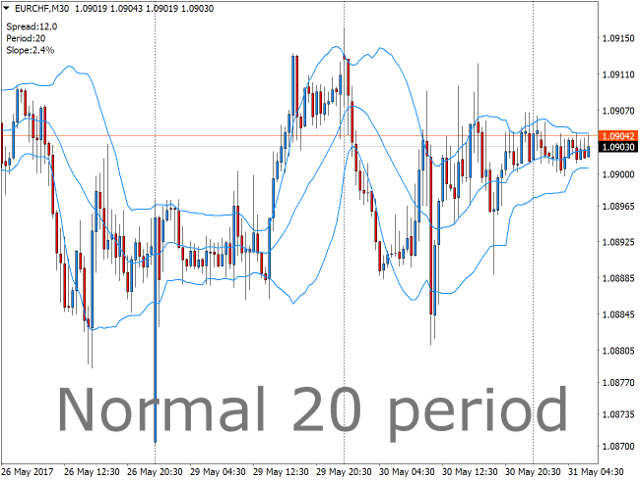
Unless you are familiar with Bollinger bands, it is a standard deviation indicator that is based around the concept that when price deviates to quickly from the average, it's going to encounter resistance. This is true for all period settings, since standard deviation 2 or 3 is an extreme on any data. This indicator automatically chooses the period that is currently most suitable for range trading or scalping (on smaller time frames).

If you use "Bollinger Bands" for trend trading, this is not the indicator for you, then it is better to stick with 20, 36 or 50.

  • The indicator comes with an alarm that sends a push notification on either close outside, close inside or both to the user.

In the notification comes information about what period is running and the slope of the mid band, so that the user can beforehand make a decision to open the trade or wait for the next signal.

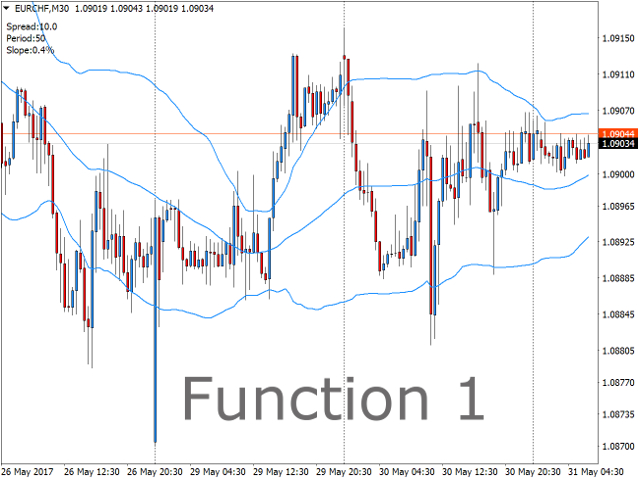
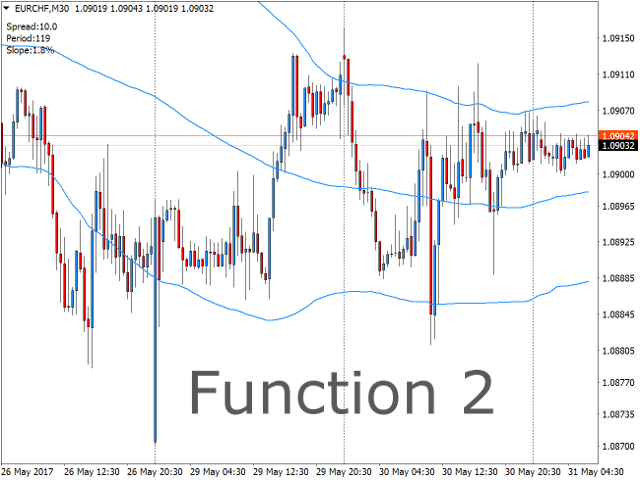
  • The indicator also comes with two different formulas for band optimization, both give very good calculations and most of the time they will agree, you can see which one you like best.

Remember that if you get an optimization that is higher than 100 periods on for example the 1-minute time frame, it means that 1 minute is not suitable for standard deviation range trading right now, but is in a trend, switch over to 5 minutes. If you look on 100 periods on the 1-minute time frame it is the same as 20 periods on the 5-minute time frame. It is therefore recommended to go over to the next time frame for better overview of what´s happening in the market.

Also remember that the band period is changing all the time, and therefore looking back on the history of the indicator will not give any information about it's performance. That can only be achieved by forward real or demo trading. And also performance will always be subject to traders decision.


Inputs

  • Chose an algorithm for optimization - Choose what algorithm to adjust the band period with. 1-3 uses the same way of optimizing deviation, the deviation is therefore usually better set by the user on these.
  • Bands period(0 for auto) - Define your own period or let the indicator do it for you.
  • Bands standard deviation - Choose the standard deviation for the bands or put "0" to let it be optimized.
  • Bands shift - Change the shift of the bands.
  • Bands maximum period - Pick the max period that can be chosen by the optimizer.
  • Bands minimum period - Pick the min period that can be chosen by the optimizer.
  • Send a push notification on close outside - The first close outside after leaving inside will give a notification.
  • Send a push notification on close inside - The first close inside after a close outside will give a notification.
  • Wait for candle to close - No notification is sent before candle closes. If false, push is sent before candle closes.
  • Filter by slope - Only send push-notification if slope is lower than a certain value.
  • Max slope value - Set a slope value.
  • Filter by bandwidth - Only send push if bandwidth is wider than this times ATR (period 100).
  • Acceptable slope on band optimization - On function one, put a threshold for the optimizer to be satisfied. If slope is lower than this, it stops looking for new settings.
  • Band cycles to check for touches - On function four. Lets you set how many band-period-cycles back to verify settings. One cycle is the length of the band-period currently being tested.
  • Maximum % of closes to allow outside of bands - Maximum percentage of closes allowed outside bands to satisfy optimizer.
  • Min total touches to accept new settings - Pick a minimum of times price needs to touch the bands in all cycles to satisfy optimizer. Every visit on each side is only counted once.
  • Show comment - Show the comment field on the left hand side of the screen.
おすすめのプロダクト
Trend Flasher Trend is your friend is the age old saying quote in trading arena, there are though many ways to gauge the trend and its direction, more scientific measure and logically meaningful will be an ATR break outs to identify and spot the trend and its acceleration, so we created this easy to use trend identification panel and optimized super trend based multi time frame panel entry system to aid and help the traders to make their trading decision. Unique Features of Trend Flasher 1. H
Signals with TP SL Indicator — a powerful trading tool that combines EMA crossover , RSI filter , and ATR-based TP/SL levels to help you spot high-probability market entries. This indicator is built to visually support the Signals with TP SL Expert Advisor , but can also be used manually as a standalone confirmation tool for intraday and swing trading. Features: Buy/Sell arrows based on EMA crossover + RSI condition Real-time dynamic SL and TP levels calculated using ATR Plots arrows directly
GM Arrows Pro
Guillaume Pierre Philippe Mesplont
Product Name: GM Arrows Pro – Signals & Alerts Short Description: GM Arrows Pro is a clean, reliable MT4 indicator showing BUY/SELL arrows on the chart with unique alerts at the moment the signal appears. Full Description: GM Arrows Pro is a professional MT4 indicator designed for traders who want clear, actionable signals: BUY and SELL arrows visible on the entire chart history Unique alerts when a new signal appears (no repeated alerts) Option to disable repetitive signals ( disable_repeatin
Binary Options Support Resistance Indicator This indicator is designed for binary options trading and effectively shows retracements from support and resistance levels. Signals appear on the current candle. A red arrow pointing downwards indicates a potential selling opportunity, while a blue arrow pointing upwards suggests buying opportunities. All that needs adjustment is the color of the signal arrows. It is recommended to use it on the M1-M5 timeframes as signals are frequent on these timef
This indicator displays Bollinger Bands signals for multiple symbols and multiple time frames. The signals are created as a simple ratios which represent the distance between the current price and the moving average measured in standard deviations. This way we create a very versatile and easy to use indicator which helps us to identify not only the strongest trends but also the most overbought and oversold conditions. Features Accurate signals in real time for multiple time frames and multiple
This indicator is an upgrade of traditional MACD on MT4. Macd Base line cross above Macd signal line the color of histogram change is red color and entry order Sell. Macd Base line cross below Macd signal line the color of histogram change is green color and entry order Buy. For above histogram of Macd can change color to good looking by can change color above zero line and lower line.
After purchase, contact me in private to get 7 days of FREE testing with EA Forex Proton where the robot automatically takes the trade alerts from MBFX Timing! MBFX Timing is an indicator that was developed and created by Mostafa Belkhayate, one of the best traders in the world. We decided to create a modified version that takes inspiration from the Stochastic Oscillator and the Relative Strength Quality Index indicators to improve your trading.  One of the main reasons we released MBFX Timing
DMAX pro
Danny Teoh Kok Keong
DMAX SIGNAL IS VERY POWERFUL TOOL TO HELP YOU ENTRY,ITS CAN DETECT OVERSOLD AND OVERBOUGHT IN FOREX MARKET. ITS CAN TRADE 24 FOREX PAIR IN MARKET, 80% ACCURATE RESULT. MANY TRADER FAIL BECAUSE OF ENTRY POINT AND EXIT POINT , SIGNAL OF DMAX WILL GIVE VERY GOOD SIGNAL TO LET YOU KNOW WHERE TO ENTRY AND EXIT.  RISK MANAGEMENT IS VERY IMPORTANT IN TRADING FOREX, PLEASE DONT RISK OVER 5% PER TRADE IS FORE MARKET
Crypto_Forex インジケーター「ダイナミック売られ過ぎ/買われ過ぎゾーンを備えた DeMarker」MT4 用。再描画なし。 - DeMarker オシレーター曲線は、インジケーター計算期間中の以前の高値と安値に対する現在の価格位置を示します。 - ダイナミック買われ過ぎゾーンから売りエントリーを行い、ダイナミック売られ過ぎゾーンから買いエントリーを行うのに最適です。 - このインジケーターは、プライスアクションエントリーと組み合わせるのにも最適です。 - ダイナミック買われ過ぎゾーン - 黄色の線より上。 - ダイナミック売られ過ぎゾーン - 緑の線より下。 - DeMarker 自体は、他のオシレーターの中で最も効率的な定期的なダイバージェンス信号を提供します。 - PC およびモバイルアラート付き。 Click here to see high quality Trading Robots and Indicators! これは、この MQL5 ウェブサイトでのみ提供されるオリジナル製品です。
Alpha Trend signは私たちの取引システムを検証し、取引信号を明確に提示し、信号がドリフトすることはありません。 主な機能: •市場が活況を示している地域に応じて、指標に基づいて現在の相場がトレンド相場に属しているか、それとも揺れ相場に属しているかを直感的に判断することができる。 そして、指標の指示矢印に基づいて市場に切り込み、緑の矢印は購入を提示し、赤の矢印は販売を提示する。 •小周期変動による頻繁な取引信号の発生を回避するために、5分以上の時間周期で取引を行うことを推奨します。 •最適な取引タイミングを逃さないために、シグナルプロンプトをオンにすることもできます。 •本指標はトレンド相場をよく予測するだけでなく、幅広振動相場でも利益を得ることができる。 •本指標は大道至簡の原則に基づいており、異なる段階のトレーダーが使用するのに適している。 注意事項: •Alpha Trend signには明確な入退場信号があり、損失を与えないように逆位相操作を提案しない。 •Alpha Trend signは特に成熟した指標であり、デルのチー
Dear traders this is Our new Indicator called Hull Pro MTF Indicator — Precision Multi-Timeframe Trend Visualizer Overview The Hull Pro MTF Indicator is a next-generation Heiken-Ashi-based multi-timeframe visual tool designed for top-down market analysis . It blends the power of Hull Moving Average (HMA) logic and multi-level Heiken-Ashi smoothing to reveal directional bias, volatility ranges, and price symmetry across hourly, daily, weekly, monthly, and yearly structures — all in a single c
This indicator Pluuto Alert Plus indicator.Indicator displays trend movement. Indicator calculates automatically line.Alert = FiltPer.When the alert is up the next alert is down,when the alert is down the next alert is up (new bar). Features FiltPer - displays indicator period.Line1. FiltPer2 - displays indicator period.Line2. Multiplier - displays indicator multiplier.(FlitPer,Line1;step) Deviation1 - displays indicator deviation.(Line2) Deviation2 - displays indicator deviation.(Line2) Deviati
This index can be traced back to historical transactions, and can clearly see the trading location, trading type, profit and loss situation, as well as statistical information. Showlabel is used to display statistics. Summy_from is the start time of order statistics. This parameter is based on the opening time of the order. Backtracking can help us to correct the wrong trading habits, which is very important for beginners to learn manual transactions. This index is suitable for each time per
At the heart of any form of trading is the need to anticipate the direction the markets will go. To make this decision traders cannot afford to ignore trend analysis. Apply this before taking any trades otherwise you will loose. Market Trend Analysis is fundamental part of trading that's based on many indicators, patterns to predict future prices. The process of analysing each symbol can take weeks. This indicator saves the time of sitting and determining the direction of the markets. This indic
UniversalIndicator is a universal indicator. A great helper for beginners and professional traders. The indicator algorithm uses probabilistic and statistical methods for analyzing the price of a trading instrument. The indicator is set in the usual way. Advantages of the indicator works on any time period works with any trading tool has a high probability of a positive forecast does not redraw Indicator Parameters LengthForecast = 30 - the number of predicted bars
The King of Forex Trend Cloud Indicator is a trend following indicator based on moving averages. The Indicator is meant to Capture both the beginning and the end of a trend. This indicator can be used to predict both short and long terms market trends.  The king of Forex Trend Cloud if paired together with the King of Forex Trend Indicator can give a broad picture in market analysis and forecasts. I have attached images for both the  The king of Forex Trend Cloud on its own and  The king of Fore
This is a trend indicator without redrawing Developed instead of the binary options strategy (by the color of the Martingale candlestick) Also works well in forex trading When to open trades (binary options) A signal will appear in the place with a candle signaling the current candle It is recommended to open a deal for one candle of the current timeframe M1 and M5 When a blue dot appears, open a deal up When a red dot appears, open a trade down. How to open trades on Forex. When a signal is rec
ReboltP
David Theodore Caro-greene
リバランスオーバーレイテクノロジー(Rebolt)を使用すると、トレーダーは、あるチャートから別のチャートへのお金の流れを視覚化できます。 Rebolt Probabilityは、ユーザーが指定した間隔で、指定された期間、あるチャートから別のチャートにお金が流れた確率を示します。 ReboltがCyanまたはBlueを読み取る場合、これらはユーザーが指定した時間の間、または競合する信号が発生するまでの間、適切なサインを購入しています。 ReboltがVioletまたはRedを読み取ると、ユーザーが指定した時間の間、または競合する信号が発生するまでの間、売りの兆候が見られます。 Reboltは、価格変化の推定値(Rebolt Delta)、予想価格変化あたりの推定ドル値(Rebolt Delta $)、および予想される変化がチャートに追加または減算されて、将来の予想価格を表すオーバーレイとしても公開されます( Rebolt Overlay)。
FairyFibo  can generate as many as 70 different BUY signals and 70 different SELL signals solely based on Price Action and Fibonacci levels. The idea is to catch as many as Swing High's and Swing Low's but with the consideration of the current trend mind. This indicator can be also used for Binary Options Trading as most of the time price tends to follow the signal direction immediately. Most of the strategies are already optimized for different time frames and different market conditions. While
ブレイクアウトプロスカルパーソリューション このインジケーターはRPTradeProSolutionsシステムの一部です。 Breakout Pro Scalper Solutionは、プライスアクション、ダイナミックサポート、レジスタンスを使用した毎日のトレンドインジケーターです。 誰でも使用できるように設計されており、トレーディングの初心者でも使用できます。 決して塗り直さないでください。 表示は近いものから近いものへと示されます。 単独で使用するように設計されているため、他のインジケーターは必要ありません。 一日の初めにトレンドと潜在的なテイクプロフィットを提供します。 特定のグラフは、履歴データによる潜在的な利益を示しています。 どのように機能しますか Breakout Pro Scalper Solutionは、価格アクションと動的なサポートおよびレジスタンスを組み合わせたブレイクアウト戦略を使用しています。 夜のトレンドとボラティリティが分析され、翌日に使用されます。 この分析から、ブレイクアウト制限(青と濃いオレンジの線)とTakeProfitが決定されます チャ
Advanced Bollinger Bands Scanner is a multi symbol multi timeframe Bollinger bands dashboard that monitors and analyzes the Bollinger Bands indicator from one chart. This panel monitors the Bollinger bands indicator in up to 28 configurable instruments and 9 timeframes for price overbought/oversold, price consolidation (Bollinger bands squeeze), and consolidation breakout (squeeze break)  with a deep scan feature to scan all market watch symbols (up to 1000 instruments!). Download Demo here  (
Chart Patterns Detect 15 patterns (Ascending Triangle, Descending Triangle, Rising Wedge, Falling Wedge, Bullish Flag, Bearish Flag, Bullish Rectangle, Bearish Rectangle Symmetrical triangle, Head and Shoulders, Inverted Head and Shoulders, Triple top, Triple Bottom, Double Top, Double Bottom) Use historical data to calculate the probability of each pattern to succeed (possibility to filter notification according to the chance of success) gives graphic indication about the invalidation level and
The Magic MA Moving Average Indicator is a market analysis tool that has more than 30 types of moving averages that the trader can use to gauge the market trend. Among the types of moving averages that the trader can visualize are the most common MAs (SMA, EMA and SMMA), adaptive moving averages such as FRAMA and KAMA and other MAs based on innovative calculation and analysis methods such as LSMA, ZLEMA and others. The indicator is designed to display all these moving averages on a single cha
「Market Vortex.mq4」は、反転ポイントとトレンド継続を正確に特定するために設計された、強力な矢印インジケーターです。平滑化されたオシレーターと適応型移動平均を基盤としており、複雑な計算をせずに、トレーダーが市場のエントリーポイントとエグジットポイントを素早く見つけるのに役立ちます。 主な特徴: 明確な矢印シグナル:インジケーターが直接、買いと売りの矢印をチャート上に表示します。 リアルタイム動作:遅延や再描画なしにシグナルを生成します。 適応型計算:二重EMA平滑化手法を採用し、ノイズを除去して真のトレンド方向を示します。 組み込みツールチップ:現在のトレンドとスワップ値(ロング/ショート)に関するコメントを表示し、取引方向の選択を容易にします。 汎用性: あらゆる通貨ペア、時間枠、取引スタイル(スキャルピング、中期取引、デイトレード)に対応 ️ パラメータ: - Period:計算に使用する移動平均の期間。値が大きいほどシグナルは滑らかになります。 ShiftForBars:より精密な調整のためのバー単位のシフト量。
MA Cross Signal Alerts_v1.0 The Moving Average Cross displays a fast and a slow moving average (MA). A signal arrow is shown when the two MAs cross. An up arrow is displayed if the fast MA crosses above the slow MA and a down arrow is given if the fast MA crosses below the slow MA. The user may change the inputs (close), methods (EMA) and period lengths.  When two Moving Averages cross the indicator will alert once per cross between crosses and mark the cross point with down or up arrow. Ale
Renko, Heiken Ashi, Ticks Bar, Range Bar.    Easy switching, easy setup, all in one window.        Place the Custom Chart indicator and view Renko, Heiken Ashi, Tick bar, Range bar charts in real time at real chart.    Position the offline chart window so that the indicator control panel is visible.    Switch the chart mode by click of a button.    Connect to the output chart any indicator, expert advisor without any restrictions.    No, it doesn't work in the tester.    Yes, you can use an
SystemBinaryM1 - a professional indicator for trading short-term binary options, is a complete, self-contained author's strategy for working in the binary options market. The unique algorithm for analyzing the foreign exchange market is based on the calculation of reference points on three different time periods M15, M5. M1. Thus, the indicator simultaneously analyzes the long-term, medium-term and short-term price behavior before issuing a signal. The indicator is set in the usual way and work
Nexus Signal System は MT4 用のインジケーターで、12 のテクニカル条件を組み合わせてトレードシグナルを生成します。本システムは、シグナルを確定する前に複数の要素(トレンド、モメンタム、出来高、サポート/レジスタンスゾーン)の共鳴を分析し、単一の指標だけを使用する場合に比べて、誤シグナルの発生を減らします。 分析基準(スコア 0–15 点): パターン検出(ピンバー、包み足) マルチタイムフレーム分析(上位時間足でのトレンド確認) ADX マーケットレジーム(トレンドのない市場を回避) サポート/レジスタンスゾーン(自動スイングポイント) 移動平均線 20/50/200(トレンド整列) RSI 14 期間(モメンタム) 相対出来高(機関投資家の確認) ATR(ボラティリティ) 機能: 透明な品質スコア付きシグナル(0–15) 自動検出された S/R ゾーンをチャートに表示 仮シグナル(現在のバー)と確定シグナル(確定バー) ATR に基づくストップロスおよびテイクプロフィット リアルタイム市場情報ダッシュボード 8 種類のカラーテーマで視覚的カスタマイズ 56
PABT Pattern Indicator - it's classical system one of the signal patterns. Indicator logic - the Hi & Lo of the bar is fully within the range of the preceding bar, look to trade them as pullback in trend. In the way if indicator found PABT pattern it's drawing two lines and arrow what showing trend way.  - First line - it's entry point and drawing at: 1. On the high of signal bar or on middle of the signal bar (depending from indicator mode) for buy; 2. On the low of signal bar or on middle of t
Zip Trend This is a hybrid trend indicator as it is based on average true range signals that determine the range of low and high price fluctuations, as well as closing prices. As a result, it indicates the current market volatility. The indicator of the oscillator family is also used. The indicator helps to calculate the oversold and overbought levels of a trading instrument. This indicator allows you to find the most likely trend reversal points. When the trend changes, the Zip Trend indicato
このプロダクトを購入した人は以下も購入しています
Gann Made Easy は、ミスター・ギャンの理論を使用した取引の最良の原則に基づいた、プロフェッショナルで使いやすい外国為替取引システムです。 W・D・ガン。このインジケーターは、ストップロスとテイクプロフィットレベルを含む正確な買いと売りのシグナルを提供します。 PUSH通知を利用して外出先でも取引可能です。 ご購入後、取引方法の説明と優れた追加インジケーターを無料で入手するには、私にご連絡ください! おそらく、ギャンの取引手法についてはすでに何度も聞いたことがあるでしょう。通常、ギャンの理論は初心者のトレーダーだけでなく、すでにある程度の取引経験がある人にとっても非常に複雑なものです。なぜなら、ギャンの取引手法は理論的にはそれほど簡単に適用できるものではないからです。私はその知識を磨き、最良の原則を私の外国為替インジケーターに組み込むために数年を費やしました。 このインジケーターは非常に簡単に適用できます。必要なのは、それをチャートに添付し、簡単な取引推奨事項に従うだけです。このインジケーターは常に市場分析の仕事を行い、取引の機会を探します。適切なエントリーポイントを検出す
Scalper Inside PRO – Since 2020. An exclusive indicator that utilizes an innovative algorithm to swiftly and accurately determine the market trend. The indicator automatically calculates opening, closing, and profit levels, providing detailed trading statistics. With these features, you can choose the most appropriate trading instrument for the current market conditions. Additionally, you can easily integrate your own arrow indicators into Scalper Inside Pro to quickly evaluate their statistics
M1 SNIPER は使いやすいトレーディングインジケーターシステムです。M1時間足向けに設計された矢印インジケーターです。M1時間足でのスキャルピングのためのスタンドアロンシステムとして、また既存のトレーディングシステムの一部としても使用できます。このトレーディングシステムはM1時間足での取引に特化して設計されていますが、他の時間足でも使用できます。元々、この手法はXAUUSDとBTCUSDの取引用に設計しましたが、他の市場においても役立つと考えています。 インジケーターのシグナルは、トレンドの方向と逆方向に取引できます。インジケーターのシグナルを利用して両方向に取引するのに役立つ特別な取引テクニックをご紹介します。この手法は、特別な動的なサポートとレジスタンスの価格帯を利用することに基づいています。 ご購入後、M1 SNIPER矢印インジケーターをすぐにダウンロードできます。さらに、M1 SNIPERツールのすべてのユーザーに、以下のスクリーンショットに表示されているApollo Dynamic SRインジケーターを無料で提供しています。この2つのインジケーターを組み合わせることで
ゴールドラッシュ・トレンド・アロー・シグナル ゴールドラッシュ・トレンド・アロー・シグナル 指標は、XAU/USDにおける高速・短期スキャルパー向けに最適化された、正確でリアルタイムのトレンド分析を提供します。 1分足専用に設計されたこのツールは、明確なエントリーポイントを示す方向矢印を表示し、スキャルパーが変動の激しい市場状況でも自信を持って取引できるよう支援します。 この指標は、PRIMARY(主要)とSECONDARY(補助)のアラート矢印で構成されています。PRIMARYシグナルは、トレンドの方向転換を示す白と黒の方向矢印であり、SECONDARYシグナルは、PRIMARY矢印が示す方向を確認し、潜在的なエントリーポイントを示す青と赤の矢印です。 注意:トレンド方向の変化後にPRIMARYアラート矢印が1つだけ表示される場合、複数のSECONDARY青/赤矢印が表示される点に注意が必要です。SECONDARYシグナルは、シグナル基準を満たす任意のローソク足後に表示されます。したがって、長期的なトレンド移動の場合、画面に多くのSECONDARY矢印が表示されます(添付の
The indicator is built on a non-standard Zig Zag, it draws accumulations after which if the price leaves this zone and a test of this zone occurs, then a sound signal is given and an arrow appears - after the test candle closes.The indicator does not redraw its signals, it is very easy to use, there are only three settings 1- this is the zig zag parameter 2- this is the minimum price exit from the zone 3- this is the maximum price exit from the zone. The lower the parameter for Zig Zag, the more
PRO Renko Systemは、特別にRENKOチャートを取引するために設計された高精度の取引システムです。 これは、様々な取引商品に適用することができる普遍的なシステムです。 システムは効果的に正確な逆転信号へのアクセスを与えるいわゆる市場の騒音を中和する。 表示器は非常に使いやすく、信号の生成に責任がある1つの変数だけがあります。 あなたは簡単にお好みの任意の取引ツールとレンコバーのサイズにツールを適応させることができます。 私はいつもあなたが私のソフトウェアで収益性の高い取引を支援するために余分なサポートを提供する準備ができています! 私はあなたに幸せで収益性の高い取引をしたいです! ご購入後にご連絡ください! 私はあなたに私のレンコチャートジェネレータを送信します。 私はまた、私の個人的な推奨事項やシステムの他のモジュールを無料で共有します!
Auto Optimized Parabolic RSI: 高度な3Dモメンタムエンジン ほとんどのリテール向けインジケーターは、市場のボラティリティが変化した瞬間に破綻する静的な入力値に依存しているため、失敗に終わります。Auto Optimized Parabolic RSIは、自らの数学的優位性を継続的に再計算することで「インジケーターの陳腐化」問題を解決し、機関投資家レベルの定量的適応力をMT5ターミナルに直接もたらします。 最大の強み: カスタムインメモリ3D最適化   標準的な自動最適化ツールは、インジケーターの呼び出しで端末に過負荷をかけるため、頻繁にMT5プラットフォームをフリーズさせます。本ツールは、このボトルネックを完全に回避しています。RAMベースのカスタムネイティブ計算機を内蔵した内部エンジンは、チャートを読み込んだりタイムフレームを変更したりするたびに、超高速の3Dグリッド探索を実行します。RSI期間(頻度)、SARステップ(加速度)、SAR最大値(制限速度)を同時にスイープし、プラットフォームを遅延させることなく、数万通りものパラメーターの組み合わせを絶対的
After purchase, contact me privately to receive 1 month of free testing with EA Forex Proton! This advanced MT4 trading robot automatically executes signals from any MT4 indicator, including Market Makers. The latest version also includes AI integration, allowing each trade signal to be analyzed using Artificial Intelligence. Live Signal with EA Forex Proton: Click here Market Makers is a powerful price action trading system designed to identify high-probability Buy and Sell opportunities based
現在40%オフ! 初心者やエキスパートトレーダーに最適なソリューション! このインジケータは、独自の機能と秘密の数式を組み込んだ、ユニークで高品質かつ手頃な価格のトレーディングツールです。たった1枚のチャートで28の通貨ペアのアラートを表示します。新しいトレンドやスキャルピングチャンスの引き金となるポイントを正確に把握することができるので、あなたのトレードがどのように改善されるか想像してみてください! 新しい基本的なアルゴリズムに基づいて構築されているため、潜在的な取引の特定と確認がより簡単になります。これは、通貨の強さや弱さが加速しているかどうかをグラフィカルに表示し、その加速のスピードを測定するためです。加速すると物事は明らかに速く進みますが、これはFX市場でも同じです。つまり、反対方向に加速している通貨をペアにすれば、利益を生む可能性のある取引を特定することができるのです。 通貨の勢いを示す縦の線と矢印は、あなたの取引の指針となるでしょう。 ダイナミックマーケットフィボナッチ23レベルはアラートトリガーとして使用され、市場の動きに適応します。もしインパルスが黄色のトリガ
まず第一に、この取引インジケーターは再描画されず、再描画されず、遅延しないことを強調する価値があります。これにより、手動取引とロボット取引の両方に理想的なものになります。 ユーザーマニュアル:設定、入力、戦略。 アトミックアナリストは、価格の強さとモメンタムを利用して市場でより良いエッジを見つけるためのPA価格アクションインジケーターです。ノイズや誤ったシグナルを除去し、取引ポテンシャルを高めるための高度なフィルターを備えています。複雑なインジケーターの複数のレイヤーを使用して、アトミックアナリストはチャートをスキャンし、複雑な数学的計算をシンプルなシグナルと色に変換します。これにより、どのような初心者トレーダーでも理解して使用し、一貫した取引の決定を行うことができます。 「アトミックアナリスト」は、新規および経験豊富なトレーダー向けにカスタマイズされた包括的な取引ソリューションです。プレミアムインジケーターとトップノッチの機能を1つの取引戦略に組み合わせ、すべてのタイプのトレーダーにとって汎用性のある選択肢にします。 デイリートレーディングとスキャルピング戦略:高速で正確な
Advanced Supply Demand
Bernhard Schweigert
4.91 (300)
現在40%オフ 初心者にもエキスパートトレーダーにも最適なソリューション このインジケーターは独自の機能と新しい公式を多数内蔵しており、ユニークで高品質かつ手頃な取引ツールです。このアップデートでは、2つの時間枠ゾーンを表示できるようになります。より長いTFだけでなく、チャートTFとより長いTF(ネストゾーンを表示)の両方を表示できます。すべてのSupply Demandトレーダーの皆さんのお気に召すはずです。:) 重要情報の公開 Advanced Supply Demandの可能性を最大化するには、 https://www.mql5.com/ja/blogs/post/720245 にアクセスしてください。   エントリーまたはターゲットの正確なトリガーポイントを正確に特定できれば取引がどのように改善されるか想像してみてください。新しい基盤となるアルゴリズムに基づいて構築されているため、買い手と売り手の間の潜在的な不均衡をさらに簡単に特定できます。これは、最も強い需要と供給のゾーンと、過去のパフォーマンス(古いゾーンを表示)がグラフィカルに表現されるためです。これらの機能は、最適な
現在40%オフ 初心者やエキスパートトレーダーに最適なソリューション! このインジケーターは、独自の機能と新しい計算式を取り入れた、ユニークで高品質、かつ手頃な価格のトレーディングツールです。たった1枚のチャートで28の為替ペアの通貨強度を読み取ることができます。新しいトレンドやスキャルピングチャンスの引き金となるポイントを正確に特定することができるので、あなたのトレードがどのように改善されるか想像してみてください。 ユーザーマニュアルはこちら  https://www.mql5.com/en/blogs/post/697384 これが最初の1本、オリジナルだ! 価値のないクローンを買わないでください。 特別な サブウィンドウの矢印で強い通貨の勢いを表示 GAPがあなたのトレードを導く! 基準通貨や気配値が売られすぎ・買われすぎのゾーン(外相フィボナッチレベル)にあるとき、個別チャートのメインウィンドウに警告表示。 通貨がレンジの外側から反落した場合、プルバック/リバーサルのアラート。 クロスパターンの特別なアラート 複数の時間枠を選択可能で、トレンドを素早く確認できます
Apex Edge No Repaint MT4対応、プロ仕様のリペイントしないトレーディングインジケーター Apex Edge No Repaintは、リペイントする矢印の煩わしさから解放され、明確なシグナルを求める真剣なFXおよび仮想通貨トレーダー向けに設計された、高品質でクリーンかつ信頼性の高いトレーディングツールです。 主な機能: 100% リペイントなし – チャートに表示されたシグナルは固定されたままです デュアルシグナルシステム:早期のチャンスを提供するRAWシグナルと、高確率で確定したエントリーを提供するCONFシグナル シンプルなワンクリック切り替えボタン:RAW ON/OFFとCONF ON/OFF トレンド、強度パーセンテージ、シグナルステータスを表示するプロフェッショナルなリアルタイムダッシュボード インスタントアラート:ポップアップ、サウンド、メール通知 すべてのCONFシグナルにTP1、TP2、ストップロスレベルを自動描画 視覚的に分かりやすい、色分けされた矢印: ライムグリーン → CONF買い 赤 → CONF売り ドジャーブルー → RAW買
このインジケーターは、反転ポイントと価格戻りゾーンを正確に表示します。     主要プレーヤー 。新たなトレンドが形成される場所を把握し、最大限の精度で意思決定を行い、すべての取引をコントロールします。 TREND LINES PRO インジケーターと組み合わせることで、その潜在能力を最大限に発揮します。 VERSION MT5 インジケーターが示す内容: 新しいトレンドの始まりに活性化する反転構造と反転レベル。 リスクと報酬の比率を最小限に抑えた利益 確定 と 損失停止の レベルの表示     RR 1:2   。 インテリジェントな削減ロジックによるストップロス。 指定されたインジケーターから 2 つのトレンド タイプの反転パターンを表示します。 指標: トレンドを追う   TREND LINES PRO   (世界的なトレンドの変化) TREND PRO   (クイックトレンド変更) シンプルで効果的   スキャナー   リアルタイムトレンド(新機能)。 マルチタイムフレームのインストゥルメント フィルタリング。 画面   利益     LOGIC AI信号の後。 当日プラス方
このインジケーターは、エリオット波動理論と組み合わせて作動し、2つの方法で使用されます: 自動モード: このモードでは、インジケーターがチャート上の全ての5つのモーティブ波を自動的に検出し、予測とポテンシャルな逆転ゾーンを提供します。また、アラートやプッシュメッセージを生成する能力も備えています。この自動機能により、エリオット波動パターンの識別と分析のプロセスが効率化されます。 手動モード: このオプションは、エリオット波動理論を手動で扱いたいトレーダー向けです。9つの段階を使用して波を描画することができます。各段階は、表示された後に描画されたラインを調整して個別に定義できます。この機能により、手動で波を描画するプロセスがより効率的になります。重要な点として、すべての描画データが将来の参照のためにプラットフォームのデータフォルダに保存されることに注意してください。 パラメータ: Name: インジケーターの名前。 Use_System_Visuals: インジケーターのテーマを有効または無効にして、取引プラットフォーム全体の外観に合わせます。 Explain_Comment: 波の番号
Please send me Direct message on MQL5 CHAT after purchasing the Indicator for Training and Installation Support There are some additional files that is important to use with the Indicator . So be sure to contact me after purchasing the Indicator So that I can add you for training and support . If you find any difficulty with installation then send me Direct message here So that I can connect with you via Anydesk or Teamview for the product installation. " Smart Order Block Indicator " to find m
このインジケーターを購入すると、プロ仕様のトレードマネージャーを無料で差し上げます。 まず第一に、このトレーディングシステムがノンリペイント、ノンリドロー、ノンラグのインジケーターであることを強調する価値がある。これにより、手動取引とロボット取引の両方に理想的なものになっています。 オンラインコース、マニュアル、プリセットのダウンロード。 「スマートトレンドトレーディングシステム MT5」は、新規および経験豊富なトレーダー向けにカスタマイズされた包括的なトレーディングソリューションです。10以上のプレミアムインジケーターを組み合わせ、7つ以上の堅実なトレーディング戦略を備えており、多様な市場状況に対応する多目的な選択肢となっています。 トレンドフォロー戦略:トレンドを効果的に乗り越えるための正確なエントリーとストップロス管理を提供します。 リバーサル戦略:潜在的なトレンドの反転を特定し、トレーダーがレンジ相場を活用できるようにします。 スキャルピング戦略:高速で正確なデイトレードおよび短期取引のために設計されています。 安定性:すべてのインジケーターはノンリペイント、ノンリドロー、ノ
「 Dynamic Scalper System 」インジケーターは、トレンド波の中でスキャルピング取引を行う手法のために設計されています。 主要通貨ペアと金でテスト済みで、他の取引商品との互換性があります。 トレンドに沿った短期的なポジションオープンのシグナルを提供し、追加の価格変動サポートも提供します。 インジケーターの原理 大きな矢印はトレンドの方向を決定します。 トレンド波の中では、小さな矢印の形でスキャルピングシグナルを生成するアルゴリズムが機能します。 赤い矢印は強気方向、青い矢印は弱気方向です。 トレンドの方向には敏感な価格変動ラインが描かれ、小さな矢印のシグナルと連動します。 シグナルは次のように機能します。適切なタイミングでラインが現れるとエントリーシグナルが形成され、ラインが開いている間はポジションが保持され、完了すると取引が終了します。 推奨される動作時間枠はM1~H4です。 矢印は現在のローソク足に形成され、次のローソク足が開いている場合は、前のローソク足の矢印は再描画されません。 入力パラメータ Trend Wave Period - トレンド方向
トレンドトレーディング は、タイミングのプルバックとブレイクアウトにより、市場で起こっているトレンドから可能な限り利益を得るように設計された指標です。確立されたトレンドの中で価格が何をしているかを分析することにより、取引の機会を見つけます。 [ インストールガイド | 更新ガイド | トラブルシューティング | よくある質問 | すべての製品 ] 自信を持って効率的に金融市場を取引する むち打ちにならずに確立されたトレンドから利益を得る 収益性の高いプルバック、ブレイクアウト、早期の逆転を認識する この指標は、独自の品質とパフォーマンスを分析します 複数時間枠のダッシュボードを実装します インジケーターは再描画されていません 電子メール/音声/視覚アラートを実装します 確立されたトレンドは多くの取引機会を提供しますが、ほとんどのトレンド指標はそれらを完全に無視しています。インジケーターの解釈はかなり簡単です: (1) トレンドの変化 (2) トレンドの方向への後退 (3) トレンドの方向へのブレイクアウト 赤いダッシュ は下降トレンド中の修正です 青いダッシュ は上昇トレンド中
GOLD Impulse with Alert
Bernhard Schweigert
4.67 (12)
このインディケータは、当社の2つの製品 Advanced Currency IMPULSE with ALERT  +   Currency Strength Exotics . のスーパーコンビネーションです。 このインジケーターは全ての時間枠で作動し、8つの主要通貨と1つのシンボルの強弱のインパルスをグラフで表示します。 このインジケータは、金、エキゾチックペア、商品、インデックス、先物など、あらゆるシンボルの通貨強度の加速度を表示することに特化されています。金、銀、原油、DAX、US30、MXN、TRY、CNHなどの通貨強度の加速度(インパルスまたは速度)を表示するために、任意のシンボルを9行目に追加できる、この種の最初のものです。 新しいアルゴリズムに基づいて構築され、潜在的な取引の特定と確認がさらに容易になりました。これは、通貨の強さや弱さが加速しているかどうかをグラフィカルに表示し、その加速の速度を測定するためです。加速すると物事は明らかに速く進みますが、これはFX市場でも同じです。つまり、反対方向に加速している通貨をペアリングすれば、潜在的に利益を生む取引を特定
KURAMA GOLD SIGNAL PRO(MT4版)— 7層フィルター・自動TP/SL・品質スコア搭載 XAUUSD完全トレードシステム リペイントなし。リドローなし。ラグなし。すべてのサインは確定後に変わりません。見たままが結果です。 特典:買い切りライセンスをご購入いただいた方に、AI Zone Radar($59相当)+PDFマニュアルを無料プレゼント。購入後にMQL5でメッセージをお送りください。 AI Zone Radar: https://www.mql5.com/en/market/product/175834 トレーダーから信頼されています:ゴールドトレーダーのコミュニティで実際に使用され、精度と使いやすさで高く評価されています。 あなたの問題 — そしてその解決策 ゴールドは1日$30〜$50動く。チャンスがあるのは分かっている。でもこういう経験はないか: - エントリーが早すぎて、$10逆行してから思った方向に動く - MAタッチのたびに入って、半分は負ける - TP/SLの基準がないから、持ちすぎるか早すぎる決済をする - 動かない時間帯にトレ
サポート線と抵抗線のプロットにうんざりしていませんか? サポートレジスタンス は、非常に興味深いひねりを加えてチャート内のサポートとレジスタンスラインを自動検出およびプロットするマルチタイムフレームインジケーターです。価格レベルは時間とともにテストされ、その重要性が高まるにつれて、ラインは太くなり、暗くなります。 [ インストールガイド | 更新ガイド | トラブルシューティング | よくある質問 | すべての製品 ] 一晩でテクニカル分析を強化 チャートを閲覧せずに重要な価格レベルを検出 一目ですべての価格レベルの相対的な強さを認識する すべての取引で最大30時間のプロットラインを節約 インジケーターは、すべての価格レベルの年齢を表示します インジケーターは再描画されていません 過去および現在の価格レベルは近接によって崩壊し、現在の市場行動に合わせて調整されます。動作は、必ずしもピークではない場所に線が引かれます。 価格レベルは、時間とともに拒否されるにつれて、より暗く、より広くなります ノイズを避けるために、重要でない価格レベルは定期的にクリアされます カスタマイズ可能な時間枠の
Trend Screener
STE S.S.COMPANY
4.79 (95)
トレンドインジケーター、1つのツールに組み込まれたすべての重要なトレンド機能を備えたトレンドトレーディングとフィルタリングのための画期的なユニークなソリューション! これは、すべてのシンボル/商品(外国為替、商品、暗号通貨、インデックス、株式)で使用できる100%再描画されていないマルチタイムフレームおよびマルチ通貨インジケーターです。 期間限定オファー: サポートおよびレジスタンス スクリーナー インジケーターは、たった 65 ドルで永久的にご利用いただけます。(元の価格 250 ドル) (オファー延長) トレンドスクリーナーは、チャート内のドットで矢印トレンドシグナルを提供するインジケーターに続く効率的なインジケーターです。 トレンド分析インジケーターで使用できる機能: 1.トレンドスキャナー。 2.最大利益分析を備えたトレンドライン。 3.トレンド通貨強度メーター。 4.アラート付きのトレンド反転ドット。 5.アラート付きの強いトレンドドット。 6.トレンド矢印 毎日の分析例、毎日のシグナルパフォーマンス...など、トレンドスクリーナーインジケーターを使用して、ここで見つけること
Super Signal – Skyblade Edition プロ仕様のノンリペイント / ノーラグ・トレンドシグナルシステム。卓越した勝率を実現 | MT4 / MT5 対応 1分足、5分足、15分足などの低い時間足で最も効果を発揮します。 主な特徴: Super Signal – Skyblade Edition は、トレンド取引に特化したスマートなシグナルシステムです。マルチレイヤーのフィルターロジックを用いて、明確な方向性と実際のモメンタムに支えられた強力なトレンドのみを検出します。 このシステムは 天井や底を予測するものではありません 。次の3つの条件がすべて満たされた場合にのみシグナルを発生させます: 明確なトレンド方向 モメンタムの増加 健全なボラティリティ構造 市場セッションに基づく流動性分析と組み合わせることで、シグナルの精度とタイミングがさらに向上します。 シグナルの特性: すべての矢印シグナルは 100% 非リペイント / 遅延なし 一度出現したシグナルは固定され、点滅・消失しません チャート上の矢印、情報パネル、ポップアップ通知、音声アラート、プッシュ通知
NextCandlePredictor インジケーター NextCandlePredictorは、再描画しない、色が変わらない、動かない、消えない、遅延がないアラート付きのシグナルインジケーターです。あらゆるタイムフレームで次のキャンドルまたはその次のキャンドルの方向を識別するのに役立ちます。ニューヨーク、ロンドン、またはその両方の重なり合う高ボラティリティ市場に特にお勧めです。 主な特徴: タイムフレームの汎用性: M1からH1以上のあらゆるタイムフレームで迅速かつ正確なシグナルを提供します。 明確な買い/売りシグナル: ADXのDI+とDI-ラインを使用して明確な買いと売りのシグナルを生成し、最良のトレード判断を下せるようにします。 直感的な視覚化: シグナルはチャート上に緑色(買い)と赤色(売り)の矢印で直接表示され、迅速かつ簡単に読み取れます。 カスタマイズ可能な設定: 分析するバーの数とアラートオプションを好みとトレード戦略に応じて調整できます。使用するTFに応じた提案表を以下で確認してください。 即時およびオプションのキャンドル終了時アラート: デフォルトでは、ADX条件が
FullScalping は、あらゆる市場で 継続的なスキャルピングエントリー を生成するように特別に設計された 再描画なし、後方描画なし のインジケーターです。絶え間ないアクションを求める積極的なトレーダーに最適です! 独占情報とアップデートを入手するには、チャンネルに参加してください: https://www.mql5.com/en/channels/forexnewadvisor ほぼすべてのローソク足 でシグナルを出し、トレンドを確認するか、重要なリトレースメントをシグナルします。常にあなたを導くレーダーのようなものです。 どのように機能しますか?非常にシンプルです: 赤い矢印 売り 取引に入る。 青い矢印 買い 取引に入る。 常に一般的なトレンドの方向に取引し、 取引ごとに15〜20ピップ を積極的にターゲットにし、急激な市場の反転の前に素早く退出します。 シグナルは 継続的 なので、取引機会が尽きることはありません。目標は以下を使用して 集中的なスキャルピング を実行することです: 高ロット 低スプレッド(左下隅に表示) 最後のトレンド変化の近くに配置された
購入後、このインジケーターに基づいたボーナスEAを受け取るためにご連絡ください。 Self Optimizing Double MA Strategyは、パラメータ推測の必要性を排除するために設計されたプロフェッショナルグレードの取引ツールです。組み込みの自動最適化エンジンを搭載し、バックグラウンドで何千ものパラメータの組み合わせをシミュレートすることで、変化する市場状況に継続的に適応し、統計的な優位性を維持します。 静的で時代遅れの設定に依存するのではなく、インジケーターは自身のロジックを動的に更新し、現在の時間枠と取引商品にとって最も収益性の高い構成を見つけ出します。 主な機能 組み込みの自動最適化: 選択した更新頻度に基づいて、システムはFast MA、Slow MA、およびRSIの期間を定期的に再計算し、設定が常に現在の市場のリズムと一致するようにします。 MAダイバージェンスフィルター: 移動平均線が明確に乖離している(広がっている)場合にのみシグナルを検証する、トレンド強度のコア指標です。これにより、移動平均線が収束している相場や平坦なレンジ相場での誤ったエントリーを防ぎ
チャートを構成し、周期的な価格変動を識別するテクニカル指標。 どのチャートでも動作します。 いくつかの種類の通知。 グラフ自体に追加の矢印があります。 履歴を再描画せずに、キャンドルのクローズに取り組みます。 M5以上のTFを推奨します。 パラメータの使用と設定が簡単です。 異なるパラメータを持つ 2 つのインジケーターを使用する場合、他のインジケーターなしで使用できます。 入力パラメータは2つあります 周期性と信号持続時間 これら 2 つのパラメータは、チャート構造の処理を扱います。 Cyclicity - 反転サイクルが変化する頻度を調整し、サイクルを滑らかにします。 Signal duration - 最小数では価格変動の衝動を検出し、最大数では長期的なトレンドの動きを検出します。
Trend Scanner PRO First of all, it’s worth emphasizing that this trading system is 100% Non-Repainting, Non-Redrawing, and Non-Lagging , which makes it ideal for both   manual   and   algorithmic   trading setups. Online course, user manual, and downloadable presets included. The Trend Scanner Dashboard is a professional   multi pair scanner   that analyzes multiple symbols and timeframes at once, giving you an instant   market scanner   view of the real trend direction. Instead of switching ch
Apollo SR Master は、サポート/レジスタンスゾーンを利用した取引をより容易かつ確実にする特別な機能を備えたサポート/レジスタンスインジケーターです。このインジケーターは、ローカル価格の高値と安値を検出することで、タイムラグなしでリアルタイムにサポート/レジスタンスゾーンを計算します。そして、新たに形成されたSRゾーンを確認するために、インジケーターは特別なシグナルを表示します。このシグナルは、SRゾーンを実際の売りまたは買いシグナルとして考慮して使用できることを示します。この場合、SRゾーンの強度が高まり、SRエリアからの取引が成功する確率も高まります。これがこのインジケーターの基本的な考え方です。 SRゾーンは、ストップロスとテイクプロフィットの設定を容易にします。シグナルの方向に応じて、SRゾーンの上または下のスペースをストップロスとして設定できます。さらに、反対側のSRゾーンは、潜在的なテイクプロフィットエリアとして設定できます。 また、Apollo SRマスターインジケーターをご利用のすべてのユーザーには、「Apollo Price Action System」
作者のその他のプロダクト
Multi currency and multi timeframe scanner. Scans all instruments in "market watch" and gives either pc-alert or push-notification to the phone on a breakout. A breakout is by default defined as when a candle becomes longer than three ATR with a period of 300. If you have the need for a custom buildt scanner, to scan for your particular setup. Please add a personal jobb under the Freelance section. Functionality Has spread filter , to not open stupid mega spread crypto currency charts. Has lo
FREE
ATR is an excellent indicator to visualize if volatility is increasing or decreasing. But what if you want to compare the volatility to another pair or instrument? Since each pair with different quote currency has different pip value, the output of the ATR doesn't really say that much. Comparing pairs to other instruments is even harder.  What you as a trader care about is how much the pair has moved up or down in percentage, therefore normalizing ATR to percent would make things much easier.  T
FREE
Lotsize panel
Cristian Eriksson
5 (4)
Compliement your normal MT5 Buy/Sell panel with this automatic lot size panel. This product is free without any limitations. There will be a pro verision later with additional functionality, but my motto is to always have awesome free products. It automatically places the stop and sizes the lot according to the given ATR for risk. You have to try it to experience it! Now I can't trade manually without it. It's turned out to be much more intuitive than I would think before creating it. There's
FREE
It is is your personal risk guard. Drop it on any chart on your VPS or trading computer and it will guard your total risk in any pair or asset and make sure the sum of all stops is within your risk. If you happened to exceed the risk, in a split second this EA will calculate the exact position for the combined risk of all open positions and place all stops at the exact same spot. If you open a new position with another lot size . No problem, all stoplosses will automatically adjust. Tired of man
FREE
Action Scanner
Cristian Eriksson
5 (1)
Action Scanner is a market scanner. It’s yet another product in my "Can’t trade with out it" series. Do you want to know what is moving right now? Action Scanner  scans your watchlist and opens the 10 currently most moving charts. You can chose between, most moving in points, most moving in your account currency(if you were to trade it with a standard lot size 1.00) and most moving in percentage.  The standard version is a complete tool with no limitations.  However the pro version has additiona
FREE
Tired of online risk calculators that you manually have to fill out? This neat little dashboard instantly shows you, your risk, reward and risk vs reward as soon as you've sat your Stop-loss or Take-profit. Works on both market and pending orders. By far, my most used indicator when trading manually on mt4. Advantages Can handle multiple positions. And gives the total risk and reward for all positions on all manually placed or pending positions on the current chart. Automatically recalculates t
EA based on a standard RSI indicator accompanied by an advanced Self Optimizer. A carefully crafted EA that self-optimizes on any pair and any time frame, to give you the best RSI settings for Reverse  or Breakout trades. It also self-optimizes on what time of day to trade if you wish. It can also be set to only optimize on that same hour, for every day in the history. It's the ultimate tool for those that wish to have a powerfull RSI trader in their arsenal, to just drop on the chart. The ba
Action Scanner is a market scanner. It’s yet another product in my "Can’t trade with out it" series. Do you want to know what is moving right now? Action Scanner  scans your watchlist and opens the 10 currently most moving charts. You can chose between, most moving in points, most moving in your account currency(if you were to trade it with a standard lot size 1.00) and most moving in percentage.  The standard version is a complete tool with no limitations.  However the pro version has additiona
Are you accidently making mistakes with your stoplosses, you thought you were risking 5% but you actually risked 15%? Are you causing yourself unncessary drawdowns by moving the sl too many times? Don't worry this ea has your back, it lies in the background and always watches your risk. No matter how many orders you have open in both directions it will make sure you stop out at your set risk percent. It also removes all stoplosses and targets in the case of a full hedge situation. The same as Ri
Multi currency, self healing, user adaptive, zone recovery system. Here's a better implementation of the zone recovery system.  You've probably noticed, with other zone recovery systems, that the zone sooner or later ends up in the worst possible range.  This EA will let you adjust the zone size on the fly (while you're trading), and move the other side on the outside of the range, if that were to happen. Did you delete or exit orders by mistake? No problem this EA also compensates user mishap
I created an indicator inspired by the "Wicks don´t lie" community on Youtube. It let's you see zones from other timeframes, and lets you keep a zone from a higher timeframe when you go to lower time frames. It operates by creating zones wherever the price has previously turned and not been retested again. This makes it easier to know where to expect a possible hick-up while going with a breakout, or where the price might make a reversal. The indicator also continues to add zones out from the cu
An imbalance indicator that marks imbalance on the chart with zones and gives the amount of imbalance as an oscillator value. There's one line for the amount of short imbalance, one line for the long imbalance and the combined imbalance as a thicker line. The combined imbalance goes above 0 if there's more imbalance above than below the current price and vice versa. The blue thicker line, shows (imblance above - imbalance below). The greeen dotted line shows imbalance above The red dotted line s
This Pro version of the LotSizePanel let's you set the stoploss with a line. Instantly the ea will calculate the lotsize based on where you drag the line on the chart. Press the "Show Line" button again, and the line dissappears and the ea reverts back to calculating the lot size from an ATR based stoploss again. I can't see how I would ever trade manually without this panel again. Remember that autotrading needs to be turned on to place orders with the buttons.
フィルタ:
レビューなし
レビューに返信