Market Structures Pro MT4
- インディケータ
-
Andrei Novichkov
 Development: MT 4 & 5, NinjaTrader 7 & 8.
Translations from Pine.
Telegram: https://t.me/fxstill (Literature on cryptocurrencies, development and code) - バージョン: 1.10
- アップデート済み: 6 12月 2023
- アクティベーション: 5
The Market Structures Pro indicator finds and displays 5 (five) patterns of the Smart Money Concepts (SMC) system on the chart, namely:
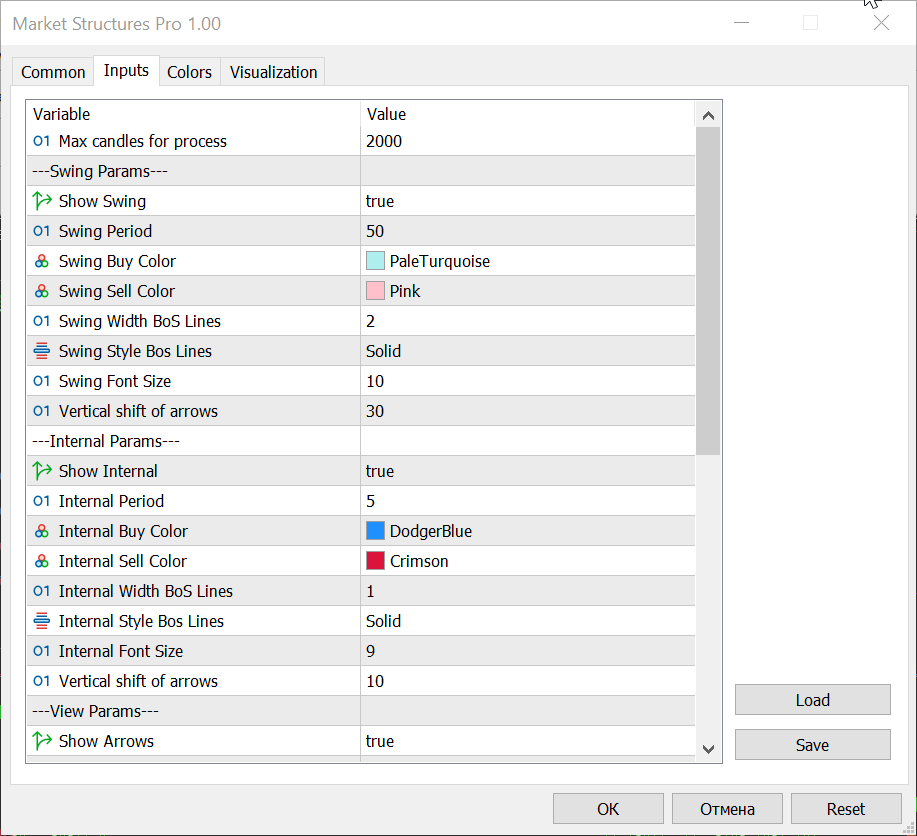
Patterns are displayed for two modes - Swing and Internal and are easily distinguished by color on the chart. Internal mode features higher contrast colors, finer lines, and smaller character sizes. For Swing mode, colors are less vibrant, lines are thicker, and symbols are larger. In the indicator you can enable/disable the display of each mode.
In addition, the indicator separately turns on/off the display of High-high, Low-low, High-low and Low-high extremes, Premium, Equilibrium and Discount zones and “Legends” - tables with hints to the user.
For Premium, Equilibrium and Discount zones, it is possible to display Fibo with customizable levels.
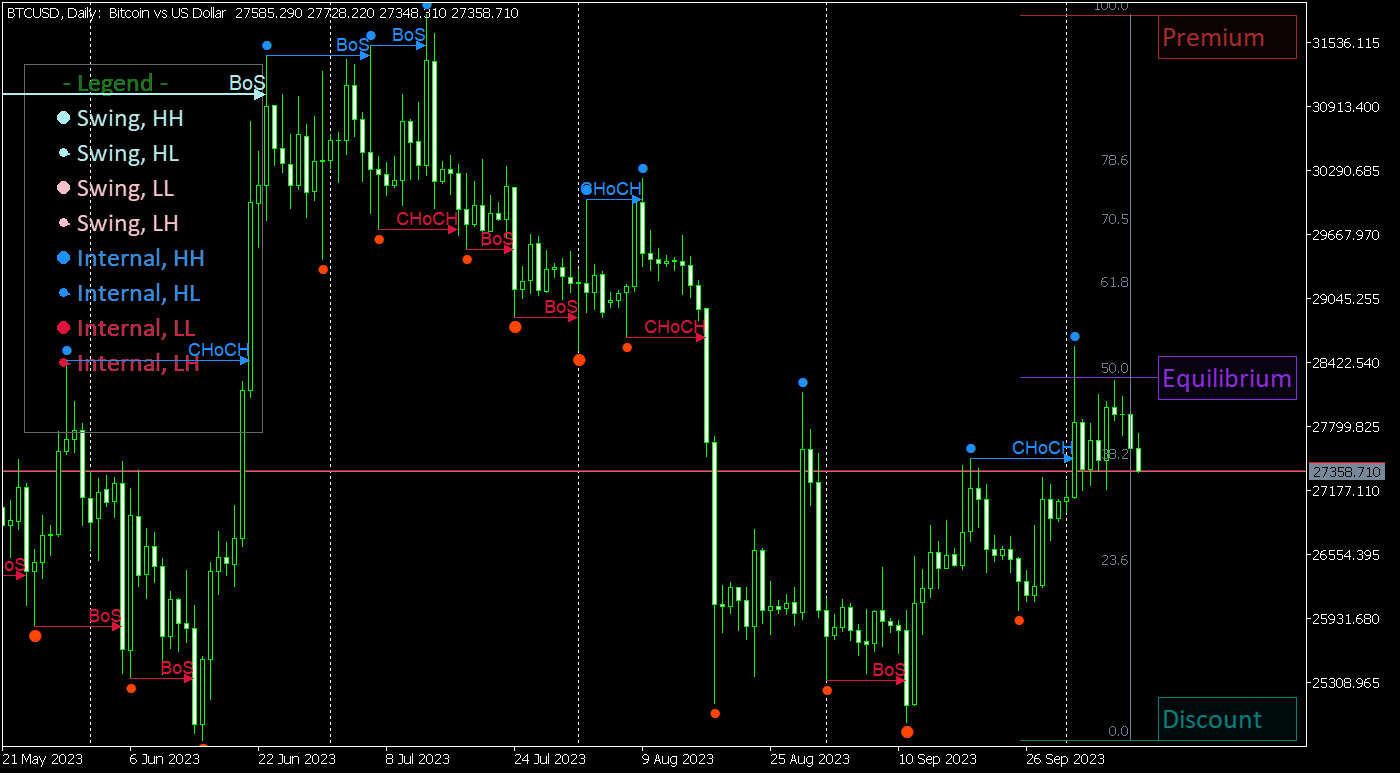
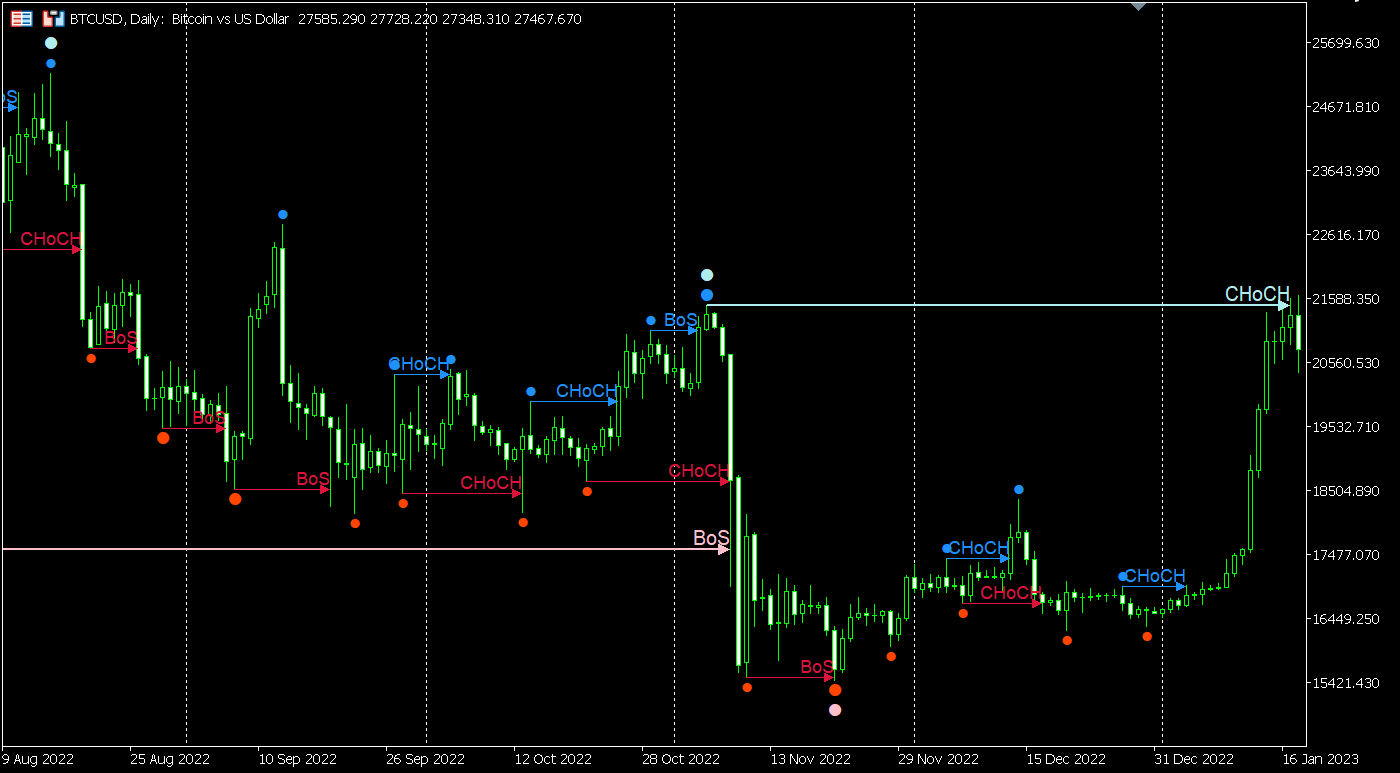
Two screenshots demonstrate two options (out of several) for displaying the indicator:
There is a completely free “demo” version for this indicator here. Work with it, read the reviews and make the right decision about the need to purchase this indicator.
I wish everyone successful trading and big profits)
- Break Of Structures (BoS)
- Change of character (CHoCH)
- Equal Highs & Lows
- Premium, Equilibrium and Discount zones with Fibo grid
- High-high, Low-low, High-low and Low-high extremes
Patterns are displayed for two modes - Swing and Internal and are easily distinguished by color on the chart. Internal mode features higher contrast colors, finer lines, and smaller character sizes. For Swing mode, colors are less vibrant, lines are thicker, and symbols are larger. In the indicator you can enable/disable the display of each mode.
In addition, the indicator separately turns on/off the display of High-high, Low-low, High-low and Low-high extremes, Premium, Equilibrium and Discount zones and “Legends” - tables with hints to the user.
For Premium, Equilibrium and Discount zones, it is possible to display Fibo with customizable levels.
Two screenshots demonstrate two options (out of several) for displaying the indicator:
- Full output of all available options
- "Zones" and "Legends" are not output
There is a completely free “demo” version for this indicator here. Work with it, read the reviews and make the right decision about the need to purchase this indicator.
I wish everyone successful trading and big profits)

This is a must have indicator if you want to boost your trading profit this indicator was exactly want I having been looking for it finds the swing points so you can catch as much as 100 pips on reversal and also developer has been very helpful and it’s worth renting for $60 for a year you can easily make your money back in a day if you go for H4 time frame very reversal pulls back as much as over 100 pips