QuantView AnalyticsPro
- ユーティリティ
- バージョン: 2.0
- アクティベーション: 5

QuantView Analytics Pro
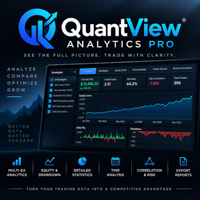
A dashboard that analyses performance across several strategies in MetaTrader 5. It tracks every EA and magic number in your terminal and shows equity curves, drawdown, risk ratios, time-of-day heatmaps, correlation between strategies and exportable reports. It is read-only and never places, changes or closes a trade.
Overview
When you run several Expert Advisors, or several copies of the same EA with different presets and timeframes, MetaTrader 5's built-in history shows only one combined account result. You can't easily see which strategy is making money, which one is losing it, or whether your "diversified" EAs are actually taking on the same risk.
QuantView Analytics Pro solves this. It reads your full account history, rebuilds every position from its entry and exit deals, and groups the results by strategy (magic number + symbol), by magic number or by symbol. You then get a full analytics dashboard for any combination of strategies over any date range, on a single chart that resizes to fit your screen.
It is a read-only analytics tool. It does not trade, does not change orders and does not affect your running EAs.
Who it's for
- Traders running several EAs who need to see results for each strategy separately.
- Strategy developers forward-testing several presets or timeframes side by side on demo accounts.
- Portfolio-minded traders who want to know whether their strategies diversify or just add to the same risk.
- Signal providers and account managers who need clean reports in CSV, Excel, HTML/PDF or Word.
Key features
1. Analysis by strategy
- Automatically finds every magic number and symbol in your history.
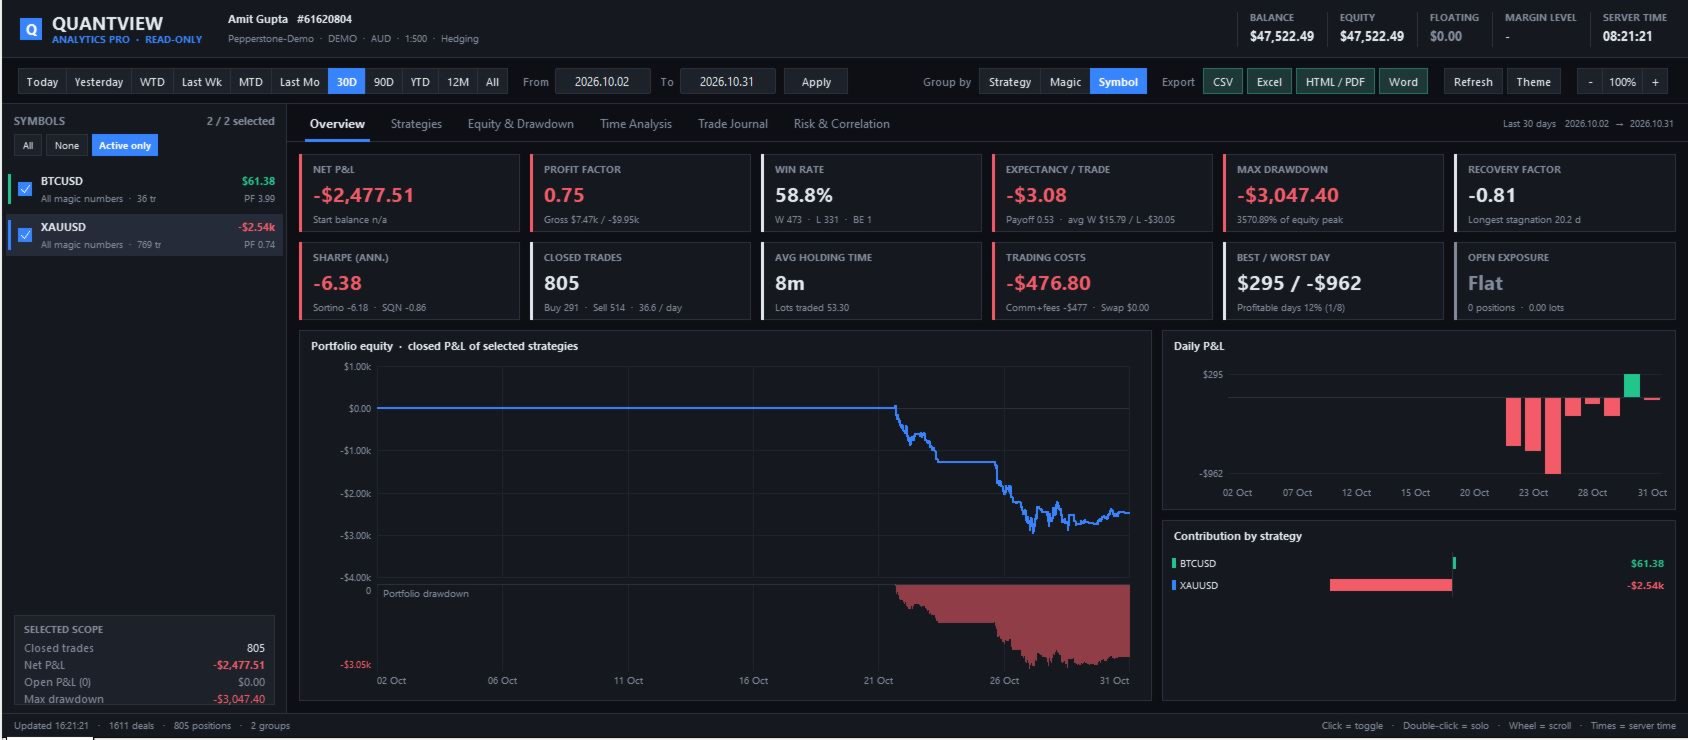
- Three ways to group results: Strategy (Magic + Symbol), Magic number or Symbol.
- Custom names for magic numbers, e.g. 704111=XAU HF M1;704112=XAU Quality M5 , so you see readable names instead of numbers.
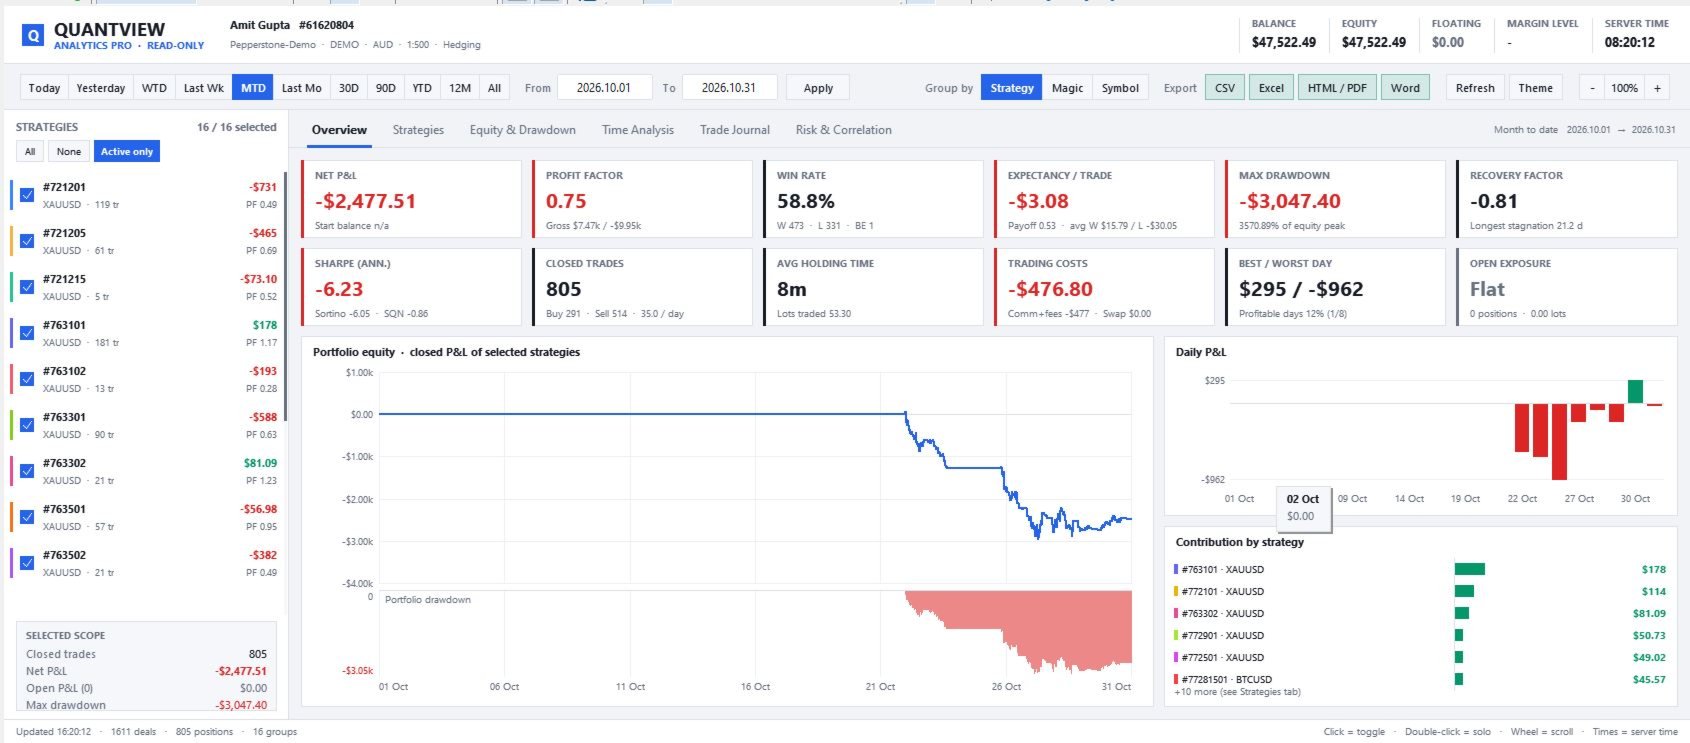
- A sidebar of strategies with net P&L and profit factor at a glance. Click a strategy to include or exclude it, or double-click to view it on its own.
- Every chart, table and figure updates to reflect the strategies you've selected.
2. Accurate trade accounting
- Trades are counted per position, not per deal. Partial closes don't inflate the trade count or the win rate.
- Net P&L includes commission on entry and exit, swap and fees, so you see the real cost of trading.
- Breakeven trades are counted separately so they don't inflate the win rate.
- Works on both hedging and netting accounts, including position reversals.
3. Date range presets and custom ranges
- One-click presets: Today, Yesterday, Week to date, Last week, Month to date, Last month, 30 days, 90 days, Year to date, 12 months, All history.
- A custom From/To date range for any period you choose.
4. Six analysis tabs
Overview
- 12 headline figures: Net P&L and return %, Profit Factor, Win Rate, Expectancy and payoff ratio, Max Drawdown in money and %, Recovery Factor, Sharpe, Sortino, SQN, trade count and trades per day, average holding time, trading costs, best and worst day, and open exposure.
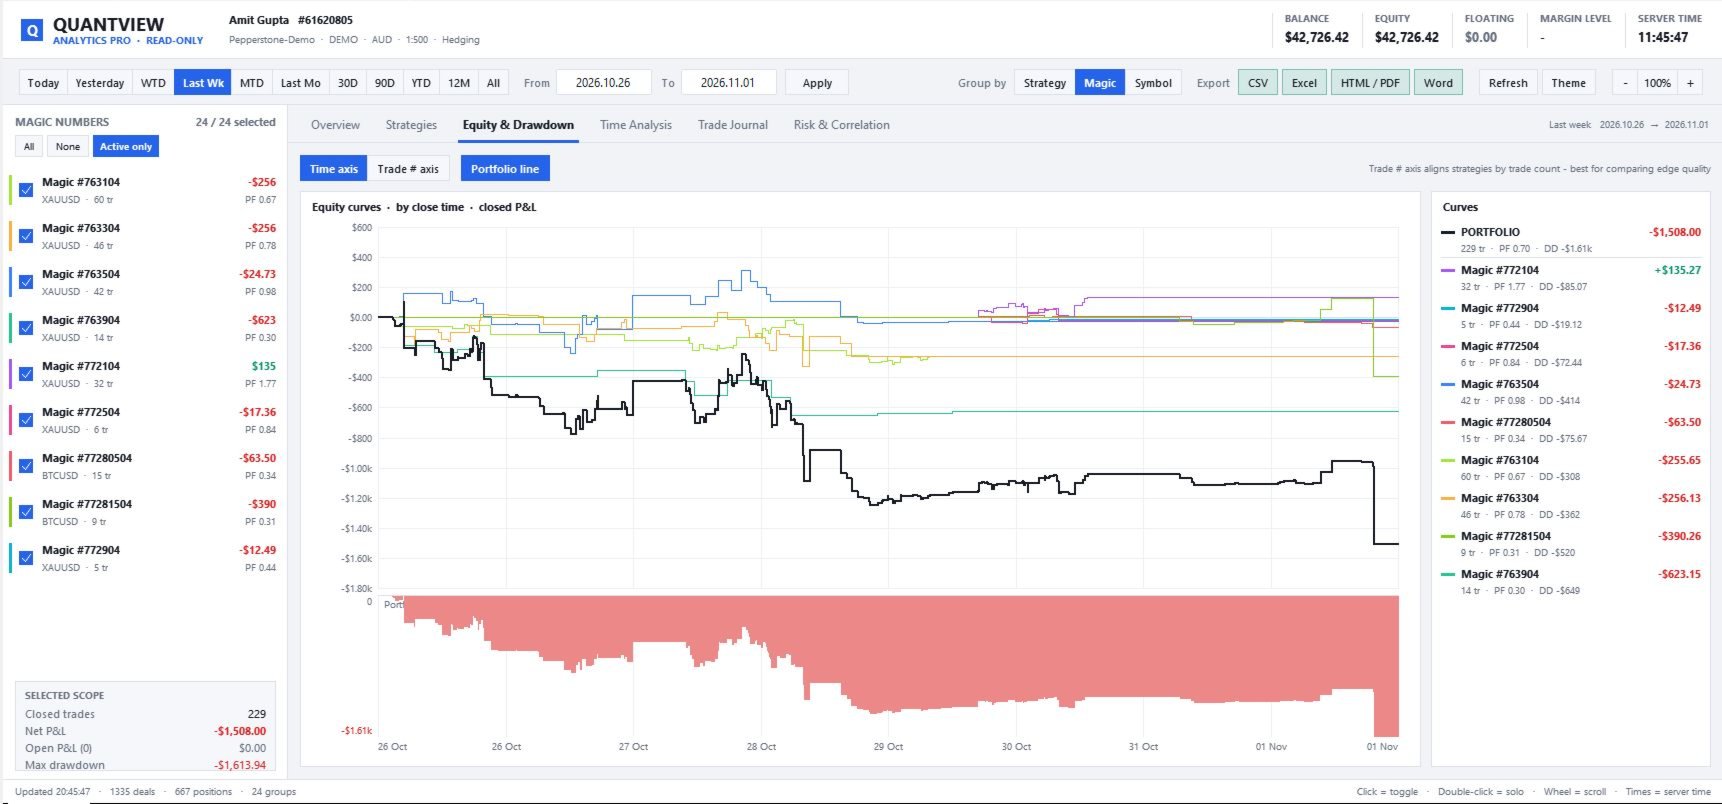
- Portfolio equity curve with a drawdown chart underneath.
- Daily P&L bars and a chart of each strategy's contribution.
Strategies
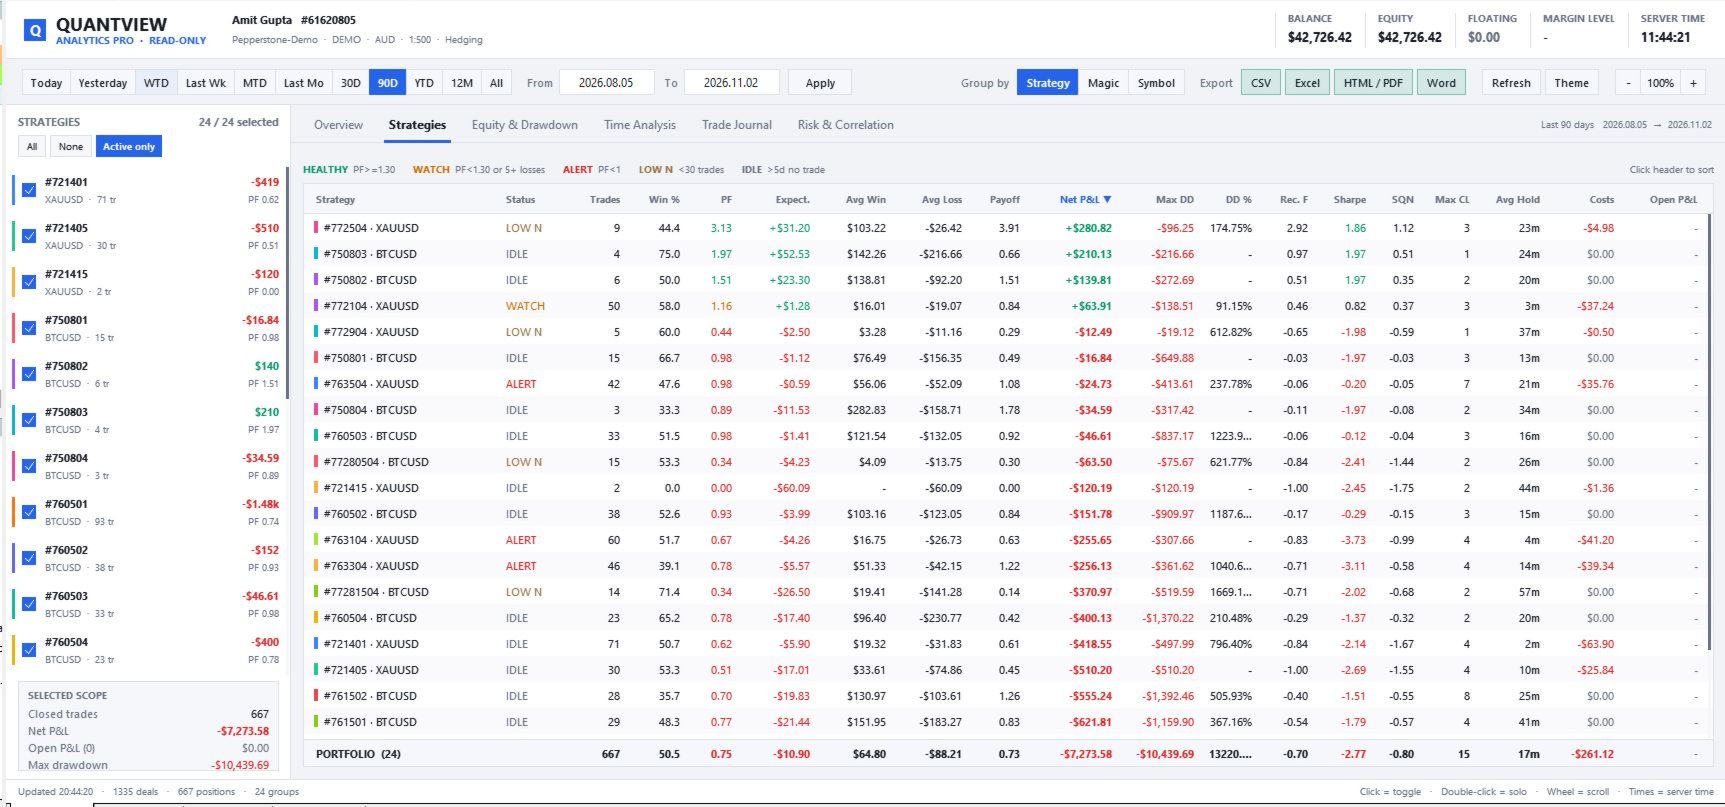
- A comparison table with 21 columns, sortable by any of them: trades, win %, PF, expectancy, average win and loss, payoff, net P&L, max DD and DD %, recovery factor, Sharpe, SQN, maximum consecutive losses, average holding time, lots, costs, open P&L and last trade time.
- A health status for each strategy:
- HEALTHY: profit factor at or above your threshold.
- WATCH: profit factor below your threshold, or a run of consecutive losses.
- ALERT: losing money (profit factor below 1).
- LOW N: too few trades for the results to be reliable.
- IDLE: no trades for a set number of days.
- A portfolio totals row.
Equity & Drawdown
- Equity curves for every selected strategy, plus the combined portfolio curve.
- Time axis for comparing strategies by date, or trade-number axis for comparing how good each strategy's results are trade for trade, whatever its trading frequency.
- A crosshair tooltip showing the value and drawdown of each strategy at any point.
Time Analysis
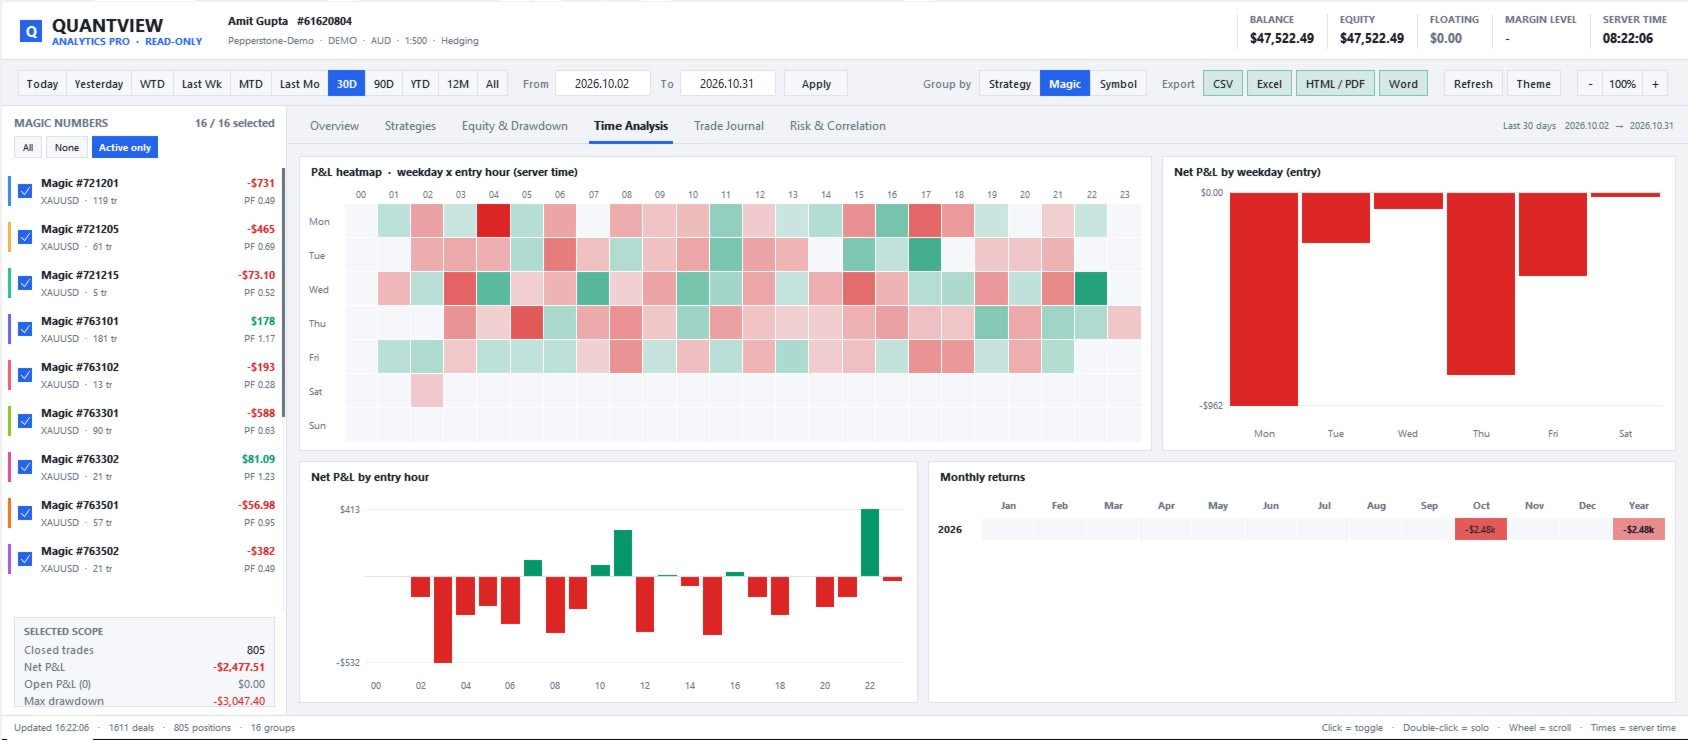
- A heatmap of P&L by weekday and entry hour (in server time), to spot your best and worst trading windows.
- P&L by weekday and by entry hour.
- A grid of monthly returns by year.
Trade Journal
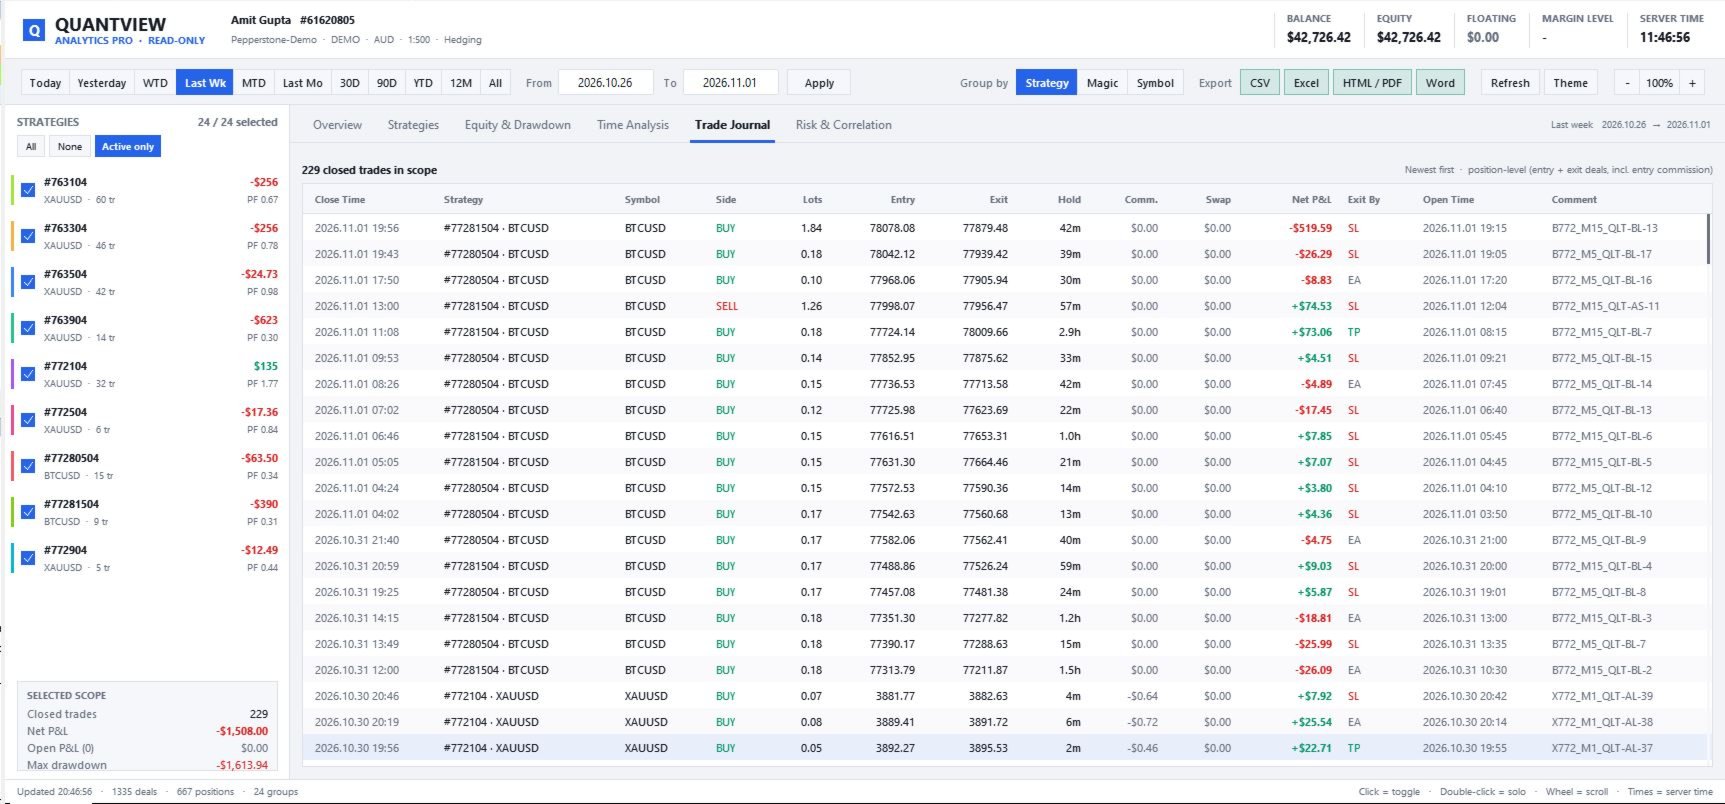
- Every closed position: entry and exit prices, lots, holding time, commission, swap, net P&L, how it was closed (SL, TP, EA, manual, stop-out) and the order comment.
Risk & Correlation
- Trade P&L distribution histogram with mean, median, standard deviation and skew.
- A correlation matrix of daily P&L between strategies, showing which EAs lose on the same days (concentrated risk) and which ones offset each other (real diversification).
- A risk table for each strategy: current streak, maximum winning and losing streaks, best and worst trade, best and worst day, daily VaR95, daily standard deviation, % of winning days, longest stagnation, long vs short P&L, and open positions.
5. Professional, resizable interface
- Fills the chart window and adjusts automatically when you resize it.
- UI scale buttons (– / 100% / +) on the dashboard, from 70% to 160%, with support for high-resolution screens.
- Dark and light themes.
- Hover tooltips on charts, heatmaps and the correlation matrix.
- Scrollable tables and strategy list.
- Remembers your tab, period, grouping, sort order and scale for each chart.
6. Export your analysis
All reports are saved to MQL5\Files\QuantView\Reports :
- CSV: strategies, trades, daily P&L and monthly returns.
- Excel workbook: five sheets (Summary, Strategies, Trades, Daily, Monthly) that open directly in Excel and can be saved as .xlsx.
- HTML report: includes equity curves. Open it in a browser and use Print → Save as PDF to get a PDF.
- Word report (.doc): ready to edit and share.
7. Lightweight and safe
- Never sends, changes or closes orders.
- No DLLs and no internet connection needed.
- History updates automatically when new trades close.
How pro traders benefit
- Stop guessing which EA pays the bills. See each strategy's net P&L, profit factor and expectancy for any period.
- Find failing strategies early. The WATCH and ALERT statuses flag declining performance and long losing runs before they cost you much.
- Avoid hidden concentration risk. The correlation matrix shows when several "different" EAs are really making the same bet.
- Make sure results are statistically meaningful. The LOW N status and SQN keep you from scaling up a strategy on too few trades.
- Choose when to trade using data. The heatmap shows which sessions, hours and weekdays add to your P&L and which take away from it.
- See the real cost of trading. Commission and swap are shown for every strategy, which matters for scalping and high-frequency systems.
- Compare presets fairly. The trade-number axis lines up strategies with very different trading frequencies on the same scale.
- Report professionally. Export clean reports for investors, followers, or your own trading journal.
How to use
- Attach QuantView Analytics Pro to any empty chart in the terminal where your EAs run. A separate chart is recommended.
- Optional: give your magic numbers names in Strategy names.
- Pick a period, a grouping and the strategies you want to analyse in the sidebar.
- Switch between tabs to analyse, and use Export to save reports.
Input parameters
| Group | Parameter | Description |
|---|---|---|
| Scope | Only these magics | Comma-separated magic numbers to include (empty = all) |
| Scope | Only these symbols | Comma-separated symbols to include (empty = all) |
| Scope | Include manual trades | Include trades with magic number 0 |
| Strategy names | Aliases | e.g. 1001=Gold Trend;1002=Gold MeanRev |
| Display | Theme | Dark or Light |
| Display | Default period / grouping | Starting date range and grouping |
| Display | Initial UI scale | 0.7–1.6 (can be adjusted on the dashboard) |
| Display | Font, hide price chart, refresh interval | Display preferences |
| Analytics | Min trades for confidence | Threshold for the LOW N status |
| Analytics | Idle days | Threshold for the IDLE status |
| Analytics | Losing streak warning | Number of consecutive losses that triggers WATCH |
| Analytics | Profit factor for WATCH | Profit factor below which WATCH is shown |
| Analytics | Weekends in daily stats | Include zero-P&L Saturdays and Sundays in daily statistics |
FAQ
Does it trade? No. It is purely an analytics tool.
Does it work with any EA? Yes. It works with any EA that uses a magic number, and with manual trades.
Is drawdown calculated on equity or on closed trades? Drawdown is based on closed-trade P&L. Floating P&L from open positions is shown separately.
Why is the correlation matrix empty? You need at least 2 selected strategies, each with 5 or more trading days in the chosen period.
Can I export to PDF? Yes. Export the HTML report, open it in a browser, and use Print → Save as PDF.