
AutoTrianglePatterns

  • インディケータ
  • Shi Yuan Wang
    Shi Yuan Wang
    MetaTrader 4およびMetaTrader 5用のカスタムインジケーター、エキスパートアドバイザー(EA)、スクリプト、トレーディングツール、そしてTradingView(Pine Script)用のインジケーターを作成しています。
    私が提供できるサービス:
    - 明確に記述された取引ルールをバックテスト可能なMQL4/MQL5 EAに変換します
    - アラートとマルチタイムフレーム対応のリペイントしないカスタムインジケーターを作成します
    - 既存のMT4 EA/インジケーターをMT5に移行します(またはMT5からMT4に移行します)
  • バージョン: 1.10
Auto Triangle Patterns
Overview
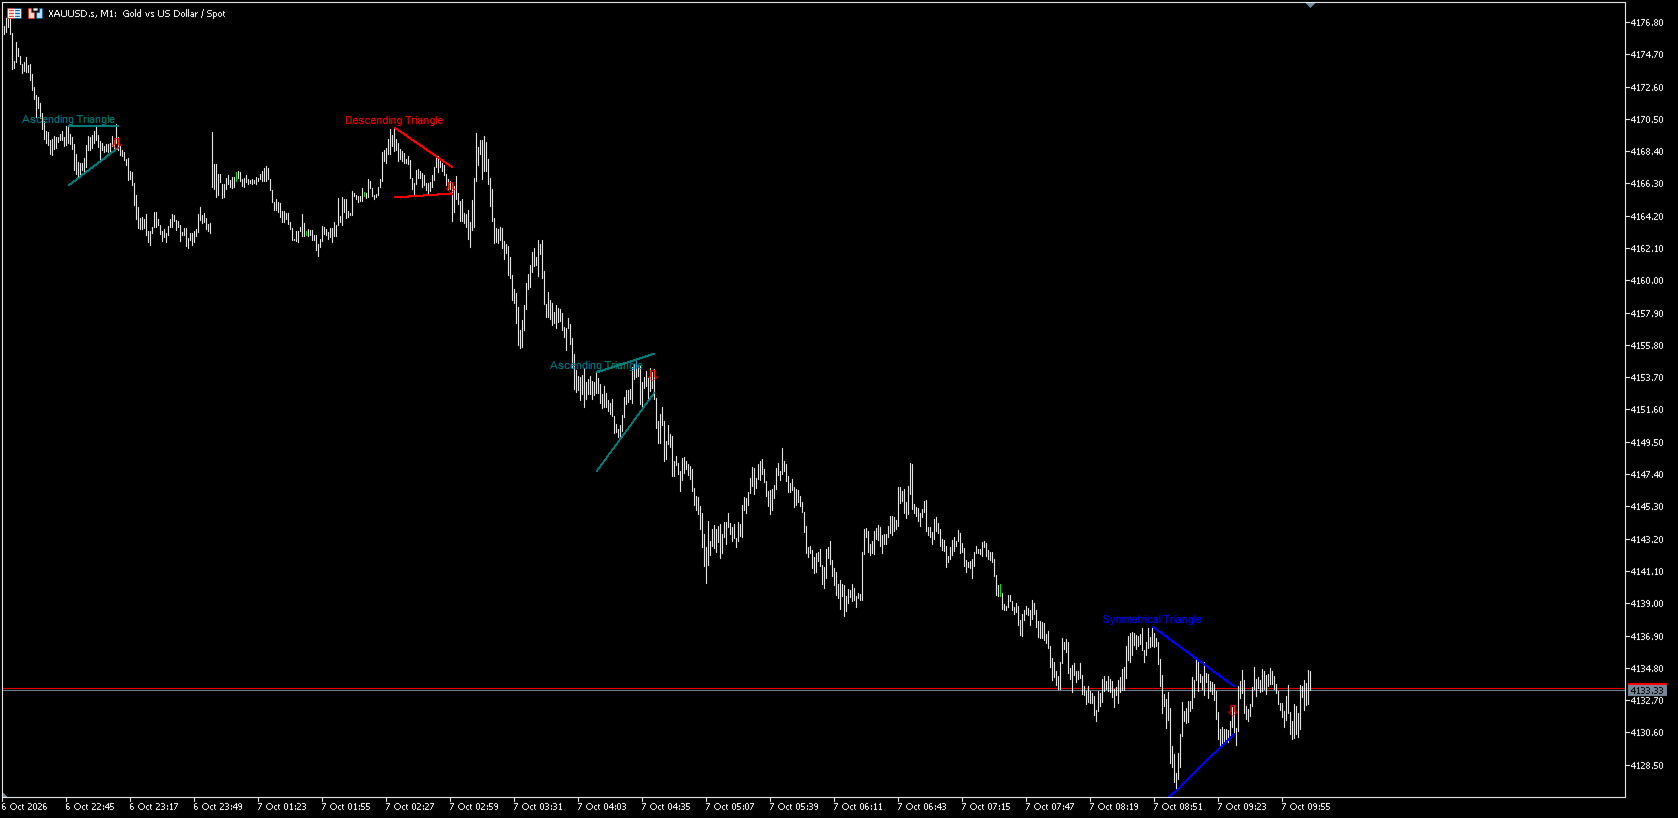
Auto Triangle Patterns is a chart indicator for MetaTrader 5. It scans the price history of the current chart and looks for three classical triangle formations: ascending, descending and symmetrical. When a formation is found, the indicator draws its two boundary lines, fills the area between them and adds a text label with the name of the formation. The pattern stays on the chart and is extended to the right with every new bar.
When price leaves the formation in either direction, or when the formation reaches its apex without a breakout, the indicator marks the result and stops updating that pattern. Resolved patterns remain on the chart so that past formations can be reviewed.
The indicator does not open or manage positions, does not place orders and does not generate trading signals. It is a technical analysis and chart visualization tool. All markings are interpretations of past price data.
How it works
The search is performed in several steps.
Swing points. The indicator finds swing highs and swing lows. A swing high is a bar whose high is not exceeded by the highs of the bars to its left and to its right; a swing low is found in the same way. The number of bars checked on each side is set by InpPivotLeft and InpPivotRight. Because the bars on the right side have to close first, a swing point is confirmed only after InpPivotRight bars have appeared after it.
Boundary lines. The upper line is drawn through the most recent InpTouches swing highs, and the lower line through the most recent InpTouches swing lows. Every swing point used for a line has to stay within a distance of InpFitTol multiplied by the Average True Range of the chart, where the ATR period is set by InpAtrLen. This tolerance is what makes the lines follow real price touches instead of an exact mathematical fit.
Classification. The two slopes decide the name of the formation. A line is treated as horizontal when the total change of its value over the length of the pattern is not more than InpFlatPct percent of the height of the pattern. An upper horizontal line with a rising lower line is an ascending triangle. A falling upper line with a horizontal lower line is a descending triangle. When both lines converge and the ratio between the faster and the slower slope is not more than InpSymRatio, the formation is symmetrical.
Validation. A candidate is accepted only when several conditions are met at the same time. The swing points of the two lines have to overlap in time. The length of the pattern has to be between InpMinBars and InpMaxBars. The point where the two lines meet has to be located to the right of the current bar. The upper line has to stay above the lower line. Finally, every bar between the start of the pattern and the current bar has to stay inside the channel, with the same ATR based tolerance that is used for the lines.
Drawing and updating. An accepted formation is drawn from its starting bar to the current bar. The lines of the active formation are extended to the right with every new bar, so the formation always reflects the latest price.
Result of a pattern. There are three possible outcomes. A breakout above the upper line marks a bullish breakout; a break below the lower line marks a bearish breakdown. In both cases an arrow is placed on the bar and the lines keep their solid style. If the price reaches the apex of the formation, or if the formation becomes longer than InpMaxBars, the pattern is closed without a breakout and is drawn with dashed lines and the note "expired". If a new formation starts while the previous one is still active, the previous one is closed in the same dashed style with the note "no breakout".
Only one formation is kept active at a time. Formations that are already resolved remain on the chart as static objects and are no longer changed.
How to use
Attach the indicator to any chart. It works on any symbol and any timeframe, and the default settings are a reasonable starting point for most charts.
Adjust the swing strength first. The pair InpPivotLeft and InpPivotRight defines how large a swing has to be before it is counted. Smaller values produce more swing points and more patterns; larger values produce fewer, larger patterns. Suitable values depend on the symbol and on personal chart reading habits.
Recommended starting values for the swing strength:
M5 to M15: InpPivotLeft 3, InpPivotRight 3
M30 to H1: InpPivotLeft 5, InpPivotRight 5
H4 to D1: InpPivotLeft 7, InpPivotRight 7
The number of touches per side is the second main control. InpTouches set to 2 finds patterns earlier and more often. Values of 3 or 4 require more confirmed touches on each line, so fewer patterns are found, and those that are found are based on more price evidence.
The tolerance InpFitTol is measured in ATR units and defines how strictly the swing points and the price inside the pattern have to follow the two lines. A value between 0.3 and 0.8 suits most charts. Lower values give tighter, more selective patterns; higher values accept looser ones.
The breakout mode is controlled by InpUseClose. With the default value of true, a breakout is counted only when a bar closes beyond a boundary line, so a wick that pierces a line without closing beyond it is not marked. With the value of false, the high and the low of the bar are used instead.
Alerts are shown by the terminal when a new formation is detected and when a breakout or a breakdown occurs. Alerts are produced on closed bars only. No alert is produced while the indicator scans past history during its first calculation.
Load enough chart history before drawing conclusions. The indicator scans up to InpHistoryBars bars of history on load; a chart with more bars loaded gives a more complete picture.
Input parameters
Pattern detection
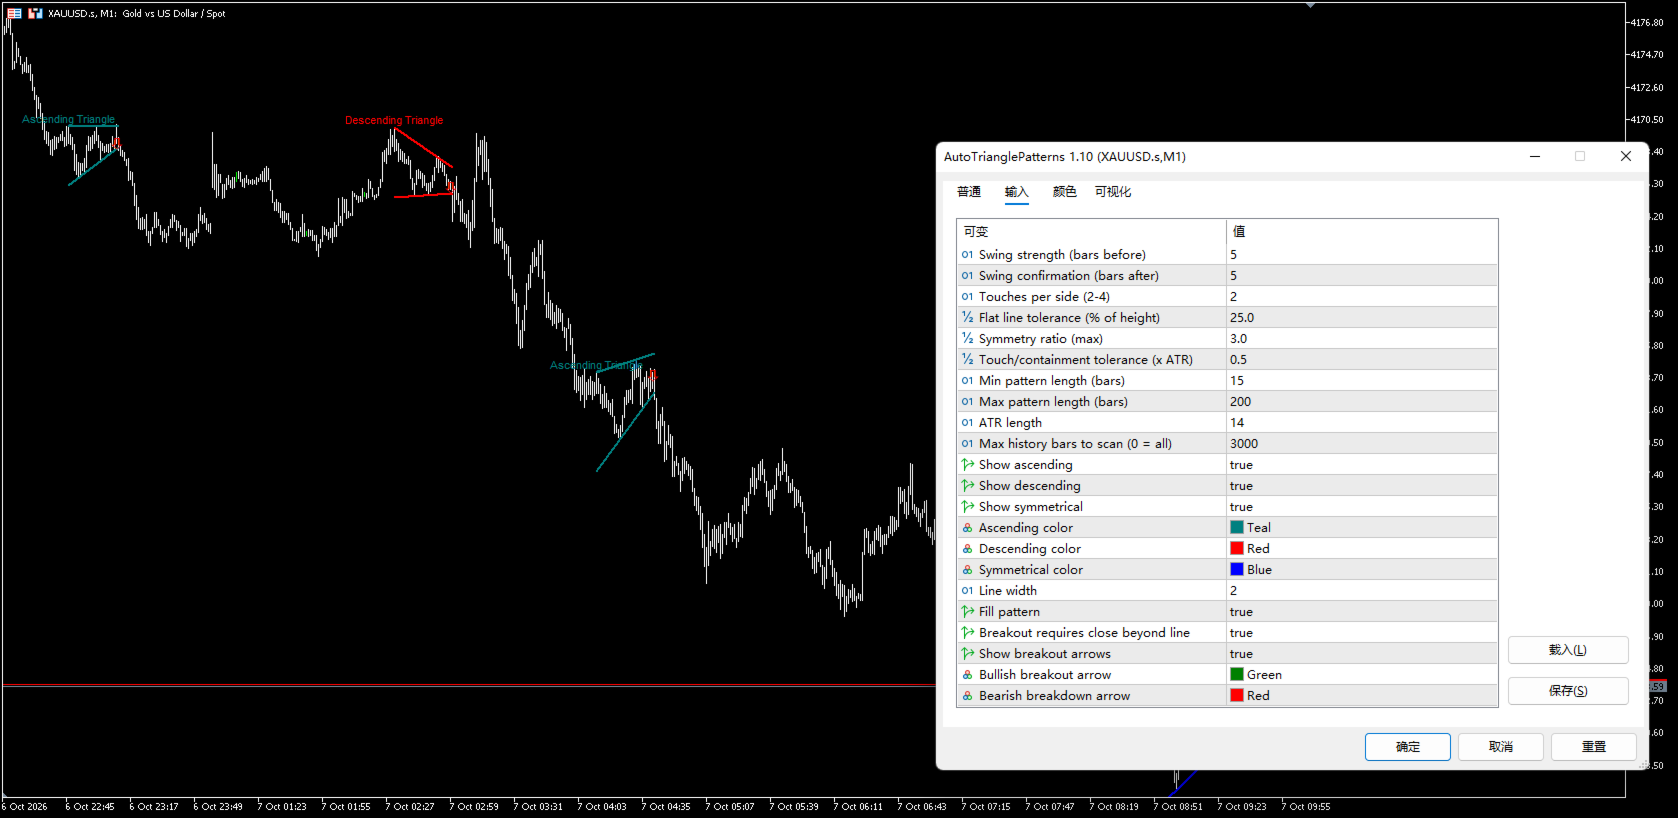
InpPivotLeft. Number of bars to the left of a swing point that must not exceed it. Default 5.
InpPivotRight. Number of bars to the right of a swing point that must not exceed it. Default 5.
InpTouches. Number of swing points required on each boundary line. Values from 2 to 4. Default 2.
InpFlatPct. Maximum change of a boundary line over the length of the pattern, expressed as a percentage of the pattern height, for the line to be treated as horizontal. Default 25.0.
InpSymRatio. Maximum ratio between the two slopes for a symmetrical triangle. Default 3.0.
InpFitTol. Tolerance for the swing points and for the price inside the pattern, in ATR units. Default 0.5.
InpAtrLen. Period of the Average True Range used to convert the tolerance into price units. Default 14.
Pattern size and history
InpMinBars. Minimum length of a pattern in bars. Default 15.
InpMaxBars. Maximum length of a pattern in bars, counted from the start of the pattern to its apex. Default 200.
InpHistoryBars. Number of historical bars scanned when the indicator is loaded. The value 0 scans all available history. Default 3000.
Pattern types
InpShowAsc. Enable the search for ascending triangles. Default true.
InpShowDesc. Enable the search for descending triangles. Default true.
InpShowSym. Enable the search for symmetrical triangles. Default true.
Appearance
InpColAsc. Line color for ascending triangles. Default clrTeal.
InpColDesc. Line color for descending triangles. Default clrRed.
InpColSym. Line color for symmetrical triangles. Default clrBlue.
InpLineWidth. Width of the boundary lines. Default 2.
InpShowFill. Fill the area between the two boundary lines. Default true.
Breakout and alerts
InpUseClose. Require a bar to close beyond a boundary line before a breakout is counted. With the value false, the high and the low of the bar are used. Default true.
InpShowBreakout. Draw an arrow on the bar of a breakout or a breakdown. Default true.
InpColBull. Color of the arrow for a breakout above the upper line. Default clrGreen.
InpColBear. Color of the arrow for a break below the lower line. Default clrRed.
Notes and limitations
Swing points are confirmed only after InpPivotRight bars have closed on the right side of a swing. This delay is part of swing detection and is not a defect. Confirmed swing points do not move or disappear afterwards.
The active formation is refitted while new swing points appear, so its lines, its length and its label can change until the formation is resolved. Resolved formations are not changed afterwards.
Breakouts are evaluated on closed bars. With InpUseClose enabled, a wick that pierces a boundary line without closing beyond it is not marked as a breakout.
The lines of the active formation are drawn up to the current bar, including the bar that is still forming. The breakout evaluation itself uses closed bars only.
Only one formation is active at a time. Earlier formations stay on the chart as static objects.
All markings are chart objects. They belong to the chart window and are removed together with the indicator.
The indicator does not use indicator buffers. It displays nothing in the Data Window, and its values cannot be read by other programs.
The indicator needs a sufficient amount of history on the chart and a filled ATR buffer before it starts drawing.
Availability
The indicator is currently distributed free of charge through the MQL5 Market. After the number of downloads exceeds 100, it will be converted to a paid subscription product. Users who obtained the free version before the conversion can continue to use the copy they received, in accordance with the MQL5 Market rules.
Demo version
In accordance with the MQL5 Market rules, the demo version of an indicator cannot be run on a live chart. Its behaviour can be observed in the visual testing mode of the Strategy Tester built into the client terminal.
Risk disclaimer
This indicator is a technical analysis and chart visualization tool. It does not provide trading signals, does not open or manage positions, and does not guarantee or promise any profit. Triangle formations and breakout markings are interpretations of past price data only. Trading in financial markets involves substantial risk. Any use of this indicator, and any trading decision taken with or without it, remains the sole responsibility of the user.
Support
Support is provided through the comments section of the product page and through the MQL5.com messaging system.
おすすめのプロダクト
Main purpose:   "Pin Bars"   is designed to automatically detect pin bars on financial market charts. A pin bar is a candle with a characteristic body and a long tail, which can signal a trend reversal or correction. How it works:   The indicator analyzes each candle on the chart, determining the size of the body, tail and nose of the candle. When a pin bar corresponding to predefined parameters is detected, the indicator marks it on the chart with an up or down arrow, depending on the directi
FREE
概要 このインジケーターは、クラシックな ドンチャンチャネル を強化したバージョンで、実践的なトレード機能を追加しています。 標準の3本線(上限、下限、中央線)に加え、 ブレイクアウト を検出し、チャート上に矢印で視覚的に表示します。また、チャートを見やすくするために、 現在のトレンド方向と逆側のラインのみを表示 します。 インジケーターの機能: 視覚的シグナル :ブレイクアウト時にカラフルな矢印を表示 自動通知 :ポップアップ、プッシュ通知、Eメール RSIフィルター :市場の相対的な強弱に基づいてシグナルを検証 カスタマイズ可能 :色、ラインの太さ、矢印コード、RSI閾値など 動作原理 ドンチャンチャネルは次のように計算します: 上限線 :直近N本のクローズ済みローソク足の最高値 下限線 :直近N本のクローズ済みローソク足の最安値 中央線 :最高値と最安値の平均値 上方ブレイクアウト は終値が上限線を超えたときに発生し、 下方ブレイクアウト は終値が下限線を下回ったときに発生します。 インジケーターは以下を行います: 3本のドンチャンラインを描画 方向転換後の最初のブレイクアウト
FREE
Trade Behavior Mirror は、自分の口座の確定した取引履歴だけを読み、「損失が確定した直後に、自分のふだんの水準より大きいロットで新規ポジションを開いた」というパターンを1つだけ数えるツールです。予測も助言もしません。パネルに出るのは、すでにこの口座で起きたことの実測値だけです。 数字の作り方: 全銘柄・全マジック番号を対象に、最大31日分の確定した約定を読み込みます(チャートの銘柄に限らない、口座全体の集計です)。当日より前の30日間から、1日あたりの新規エントリー件数の中央値と、そのエントリーのロットの中央値を求めます。平均ではなく中央値を使うのは、1件だけ大きな取引があっても基準値全体が引きずられないようにするためです。その30日間のエントリーが5件に満たない場合は、十分な標本が無いということなので、無理に数字を出さず「Collecting history」と表示します。 核となる集計(画面では Entries within 10min of a loss, at above-median lot: の行): 新しいエントリーのたびに、その直前10分以内に損
FREE
Northstar Flow Candles MT5 is a free chart indicator for traders who use Heikin Ashi candles to review trend context. Its purpose is visual analysis, with candle states and optional markers on the MetaTrader 5 chart. This is a visual tool. It does not place trades or provide popup, push or email notifications. Chart context Five candle states: strong bullish, bullish, balanced, bearish and strong bearish. Context settings based on fast and slow exponential moving averages, ADX and ATR-normalize
FREE
MACD Enhanced
Nikita Berdnikov
4 (4)
Introducing the MACD  Enhanced – an advanced MACD (Moving Average Convergence Divergence) indicator that provides traders with extended capabilities for trend and momentum analysis in financial markets. The indicator uses the difference between the fast and slow exponential moving averages to determine momentum, direction, and strength of the trend, creating clear visual signals for potential entry and exit points. Attention! To achieve the best results, it is recommended to adapt the indicator
FREE
Are you tired of drawing trendlines every time you're analyzing charts? Or perhaps you would like more consistency in your technical analysis. Then this is for you. This indicator will draw trend lines automatically when dropped on a chart. How it works Works similar to standard deviation channel found on mt4 and mt5. It has 2 parameters: 1. Starting Bar 2. Number of bars for calculation The   starting bar   is the bar which drawing of the trend lines will begin, while the   number of bars for c
FREE
The idea of the system is to indentify the reversal patterns using the calculation of the composite candle. The reversal patterns is similar to the "Hammer" and "Hanging Man" patterns in Japanese candlestick analysis. But it uses the composite candle instead the single candle and doesn't need the small body of the composite candle to confirm the reversal. Input parameters: Range - maximal number of bars, used in the calculation of the composite candle. Minimum - minimal size of the composite can
FREE
Description : Rainbow MT5 is a technical indicator based on Moving Average with period 34 and very easy to use. When price crosses above MA and MA changes color to green, then this is a signal to buy. When price crosses below MA and MA changes color to red, then this is a signal to sell. The Expert advisor ( Rainbow EA MT5 ) based on Rainbow MT5 indicator is now available here . MT4 version is available here .
FREE
Daily Entry M1 – MT5インジケーター Daily Entry M1は、M1時間足で短期のデイトレード機会に注目するトレーダー向けに開発されたMetaTrader 5インジケーターです。 このインジケーターは市場状況を分析し、内部のエントリー条件が確認されたときに、チャート上へ明確なBUYおよびSELLの矢印を直接表示します。 このインジケーターは、潜在的な市場の転換エリアを探し、日中の高値または安値に近いエントリーを特定することを目的としており、ランダムな価格位置ではなく、反転の可能性がある機会に集中できるよう支援します。 各トレード矢印には、それぞれ事前定義された独自のターゲットレベルが付属しており、その特定のシグナルに対応するターゲットをすぐに確認できます。 Daily Entry M1の主な目的は、不必要にチャートを複雑化することなく、エントリーシグナルとそれに対応するターゲットを素早く識別できる、シンプルで実用的なトレード環境を提供することです。 free expert Group: https://www.mql5.com/en/messages/01d5
FREE
Girassol Sunflower MT5 Indicator
Saullo De Oliveira Pacheco
3.86 (7)
This is the famous Sunflower indicator for Metatrader5. This indicator marks possible tops and bottoms on price charts. The indicator identifies tops and bottoms in the asset's price history, keep in mind that the current sunflower of the last candle repaints, as it is not possible to identify a top until the market reverses and it is also not possible to identify a bottom without the market stop falling and start rising. If you are looking for a professional programmer for Metatrader5, please
FREE
インディケータはチャート上にトレンドラインを描画します。このインジケーターには6つの入力があります。ユーザーは両方の行に代替ラベルを指定できます。インジケーターの複数のインスタンスが使用される場合、ラベルは異なっている必要があります。ユーザーは、線の幅と色、および使用する重要なピークを指定する深さを設定できます。たとえば、Depth = 10は、現在の山と谷を使用してトレンドラインを設定します。この山と谷は、左右に少なくとも10本のバーがあり、高/低がピークの高/低よりも小さい/大きいです。インジケーターは、以前の山と谷もペイントします。インジケーターには、価格がサポート/レジスタンスラインから事前に設定された距離にあるときにユーザーに通知するために使用できるアラート機能が追加されています。アラート距離はピップで設定されます。
FREE
Follow The Line MT5
Oliver Gideon Amofa Appiah
4.6 (35)
This indicator obeys the popular maxim that: "THE TREND IS YOUR FRIEND" It paints a GREEN line for BUY and also paints a RED line for SELL. (you can change the colors). It gives alarms and alerts of all kinds. IT DOES NOT REPAINT and can be used for all currency pairs and timeframes. Yes, as easy and simple as that. Even a newbie can use it to make great and reliable trades. NB: For best results, get my other premium indicators for more powerful and reliable signals. Get them here: https://www.m
FREE
Free automatic Fibonacci is an indicator that automatically plots a Fibonacci retracement based on the number of bars you select on the BarsToScan setting in the indicator. The Fibonacci is automatically updated in real time as new highest and lowest values appears amongst the selected bars. You can select which level values to be displayed in the indicator settings. You can also select the color of the levels thus enabling the trader to be able to attach the indicator several times with differe
FREE
VolumeBasedColorsBars — Free Powerful Volume Analysis for All Traders Unlock the hidden story behind every price bar! VolumeBasedColorsBars is a professional-grade, 100% FREE indicator that colorizes your chart candles based on real, adaptive volume analysis. Instantly spot surges in market activity, identify exhaustion, and catch the moves that matter. This indicator gives you:    • Dynamic color-coded bars for instant volume context    • Adaptive thresholds based on historical, session-awar
FREE
Apex Point is a trend-following indicator for MetaTrader 5, transforming complex market data into signals for traders. It displays blue dots for uptrends, red dots for downtrends, and yellow crosses at potential reversals, helping users identify momentum shifts quickly. Key features include a confirmation system requiring multiple bars (default: 3) to validate changes, reducing false signals; dynamic ATR-based offsets for adaptive trailing, with instant ratcheting in the trend direction and smo
FREE
Friend of the Trend: Your Trend Tracker Master the market with Friend of the Trend , the indicator that simplifies trend analysis and helps you identify the best moments to buy, sell, or wait. With an intuitive and visually striking design, Friend of the Trend analyzes price movements and delivers signals through a colorful histogram: Green Bars : Signal an uptrend, indicating buying opportunities. Red Bars : Alert to a downtrend, suggesting potential selling points. Orange Bars : Represent cons
FREE
Fimathe PCM Indicador
Cristiano Rodrigo Olegini
5 (1)
Velas Forex FIMATHE PCM Indicator(無料) Velas Forex FIMATHE PCM Indicator は、市場をシンプルかつ迅速、そして分かりやすく分析できるように設計された無料のインジケーターです。 明確な視覚シグナルによって市場状況を把握しやすくし、トレーダーがより自信を持って取引判断を行えるようサポートします。 XAUUSD の最良結果: 時間足: 5分足(5M) MT5サーバー時間: 02:00 リスク管理: Take Profitを1回達成したら: 取引を停止し、翌日まで待機します。 Stop Lossを2回達成したら: 取引を停止し、翌日まで待機します。 主な特徴 シンプルで直感的なインターフェース インストールと設定が簡単 MetaTrader 5で利用可能なすべての金融商品に対応 複数の時間足で使用可能 初心者から上級者まで幅広いトレーダーに最適 プラットフォームのリソース消費を最小限に抑えた軽量設計 無料 本インジケーターは、MQL5コミュニティ向けに 100%無料 で提供されています。 お役に立ちましたら、ぜひ評価とレビュ
FREE
平均足(ヘイキンアシ)MT5インジケーター 平均足(ヘイキンアシ)MT5インジケーターは、標準的な価格データをより滑らかでトレンドに沿ったローソク足に変換し、市場トレンドや潜在的な反転ポイントをより簡単に識別できるようにする強力なツールです。 主な特徴: 明確なトレンド識別: 異なるローソク足の色で上昇トレンドと下降トレンドを視覚的に区別します。 ノイズの低減: 価格変動をフィルタリングし、 市場の主要な動きをより明確に表示します。 早期トレンド検出: 標準チャートでトレンドの変化が明らかになる前に、 潜在的なトレンド変化を予測します。 汎用性: 単独で使用することも、 他のテクニカル指標と組み合わせて総合的な分析を行うこともできます。 カスタマイズ可能な設定: インジケーターを特定の取引設定や戦略に合わせて調整できます。 メリット: トレンドを特定し、 潜在的なエントリーポイントと出口ポイントを識別する能力を向上させます。 市場ノイズの影響を減らし、 重要な価格変動に集中します。 市場ダイナミクスをより明確に理解することで、 より情報に基づいた取引決定を行うことができます。 検証済
FREE
RenkoExpert
Andrey Goida
3.67 (6)
Renko Expert Advisor based on Renko bar simulation.    The EA has two options for building Renko bars. Classic and ATR. In the classic version, renko bars are marked with areas on the main chart; in the ATR version, renko bars are modeled and drawn in the indicator window. Modeling renko bars inside the EA allows you to optimize the robot better than drawing renko bars offline. Renko EDGE EA   Set file Golden Delta | Algo Trading Research Updates, research and new developments: https://www.mql5
FREE
Coral trend is   a trend-following indicator that is widely popular among FOREX traders . It is usually used as a confluence with other indicators. It uses combinations of moving averages with complex smoothing formulas! It has two configurable parameters: Coefficient   - smoothing ratio (*) Applied price Calculation: Coral = (-0.064) * B6 + 0.672 * B5 - 2.352 * B4 + 2.744 * B3
FREE
Donchian Channel is an indicator created by Richard Donchian. It is formed by taking the highest high and the lowest low of the last specified period in candles. The area between high and low is the channel for the chosen period. Its configuration is simple. It is possible to have the average between the upper and lower lines, plus you have alerts when price hits one side. If you have any questions or find any bugs, please contact me. Enjoy!
FREE
MSX Hybrid Heiken Scalper Overview MSX Hybrid Heiken Scalper is a MetaTrader 5 indicator based on a modified Heiken Ashi methodology with closed-bar smoothing. The indicator is designed to display trend direction through color-coded candles while reducing sensitivity to short-term market fluctuations. All calculations are performed using completed candles, allowing historical values to remain fixed after bar close. Features • Modified Heiken Ashi calculation • Closed-bar processing • Color-code
FREE
High Low Open Close
Alexandre Borela
4.98 (45)
このプロジェクトが好きなら、5つ星レビューを残してください。 このインジケータは、指定されたためのオープン、ハイ、ロー、クローズ価格を描画します 特定のタイムゾーンの期間と調整が可能です。 これらは、多くの機関や専門家によって見られた重要なレベルです トレーダーは、彼らがより多くのかもしれない場所を知るために有用であり、 アクティブ。 利用可能な期間は次のとおりです。 前の日。 前週。 前の月。 前の四半期。 前年。 または: 現在の日。 現在の週。 現在の月。 現在の四半期。 現年。
FREE
Shadow Flare インジケーターは、MetaTrader 5 向けの 非リペイント型トレンド & 流動性ツール です。設定可能な移動平均ベースライン(HMA / EMA / SMA / RMA から選択)を計算し、その上下に ATR(Average True Range)ベースのバンドを巻き付けることで「粘着性」のあるトレンド状態を生成します。トレンド状態は、価格の終値が上側バンドまたは下側バンドを明確にブレイクしてクローズしたときにだけ反転します。同じトレンドエンジンが自動サプライ・デマンドゾーンモジュールも駆動し、スイングハイ/スイングローを検出してその周囲に色付きボックスを描画し、価格がクローズでゾーンを抜けた瞬間にそのゾーンを無効化(ミティゲート)します。 トレンド状態が反転したバーで買い・売りシグナルが発生し、オプションの出来高フィルターと RSI フィルターにより、弱いエントリーやモメンタムに逆行するエントリーをブロックできます。内蔵ダッシュボードはリアルタイムでトレンドバイアス、モメンタム(RSI ベース)、出来高ステータスを表示します。ポップアップ、サウンド、モ
FREE
PROMETHEUS TECHNICAN VERSION Free | By THE SONS A gift from The Sons — no strings, no trial, no expiry. Every trader deserves access to professional-grade market intelligence. That belief is why Prometheus Technical Version exists, and why it costs nothing. Consider it our handshake to the trading community. What You're Getting This is not a simplified tool dressed up as a gift. Prometheus Technican Version is a fully built, institutional-quality technical analysis indicator running a dual-model
FREE
QuantMatrix Candle Patterns is a free MetaTrader 5 indicator designed to identify classic candlestick formations directly on the chart. The indicator analyzes completed candles and detects recognized bullish, bearish and neutral price-action patterns. When a valid bullish or bearish formation is confirmed, the corresponding BUY or SELL signal is displayed on the following candle . This means the signal is only generated after the source pattern has been completed. The indicator also displays a c
FREE
The Horizontal Ray Tool is a lightweight, professional charting utility designed to streamline support and resistance mapping on MetaTrader 5. It brings rapid, one-click horizontal level placement directly to your live chart, eliminating the workspace clutter associated with infinite horizontal lines or manually drawn trendlines. Key Features: Interactive On-Screen Button: Spawns a clean, responsive "DRAW RAY" button docked directly on your chart canvas. A single click drops an independent hor
FREE
The indicator identifies when a divergence occurs between price and an indicator or oscillator. It identifies both regular and hidden divergences. Combined with your own rules and techniques, this indicator will allow you to create (or enhance) your own powerful system. For higher probability setups I can recommend you to use my Supply Demand indicator and trade only if the divergence occurs inside a zone. Supply zone for bearish div and demand zone for bullish div. The optimal scenario is if it
FREE
IMPORTANT NOTE: This is a professional Trade Management Utility and on-chart assistant. It is NOT an automated trading robot. It does not open trades on its own. The UltraFast Trade Manager MT5 is the ultimate execution and risk-management suite designed to give you absolute control over your manual and algorithmic trades. When managing multiple positions, calculating complex net break-even points, or constantly monitoring the economic calendar, hesitation can lead to costly mistakes. This utili
FREE
The Penta-O is a 6-point retracement harmonacci pattern which usually precedes big market movements. Penta-O patterns can expand and repaint quite a bit. To make things easier this indicator implements a twist: it waits for a donchian breakout in the right direction before signaling the trade. The end result is an otherwise repainting indicator with a very reliable trading signal. The donchian breakout period is entered as an input. [ Installation Guide | Update Guide | Troubleshooting | FAQ | A
FREE
このプロダクトを購入した人は以下も購入しています
Trend Sniper X
Sarvarbek Abduvoxobov
4.9 (40)
Trend Sniper X は、トレードの方向性と潜在的な反転ポイントを明確かつ正確に特定するのに役立つ、MetaTrader 5 用のマルチタイムフレーム・トレンドフォロー指標です。 MT4用: https://www.mql5.com/en/market/product/193245 価格情報: 現在の価格はプロモーション価格であり、今後のアップデートや新機能のリリースに伴い変更される場合があります。 ボーナス特典: このインジケーター用の無料自動売買アシスタントEAを入手するには、購入後に an 著者(開発者)へメッセージをお送りください。 Code2Profit チャンネル マルチタイムフレーム分析で相場をマスターしよう! Trend Sniper X で勝率を最大化する方法:重要なルールとセッションのコツ 技術仕様 プラットフォーム MetaTrader 5 インジケータータイプ マルチタイムフレーム・トレンドインジケーター 操作タイムフレーム あらゆるチャートタイムフレームに対応。個別に選択可能な上位タイムフレーム (M1–MN1) を搭載 主要銘柄 FX、ゴールド (X
Smart Trend Trading System — MetaTrader 5 ご購入後、MQL5で私にメッセージをお送りいただくと、Smart Universal Expert Advisorを無料で受け取れるほか、オンライン講座、PDFマニュアル、非公開グループへのアクセスもご利用いただけます。 STTSは、トレンドの方向、エントリー・決済シグナル、反転ゾーン、重要な価格水準をチャート上にまとめて表示します。システムを参考に手動で取引することも、別の対応EAを接続し、ご自身で選んだ設定に基づいて自動売買することもできます。 ひとつのシステム、4つのトレードアプローチ STTSのトレードアプローチは、大きく4つのカテゴリーに分かれています。 • スキャルピング — 短期的なシグナルや相場の動きを捉えます。 • トレンドトレード — 方向性を評価し、トレンド内の機会を探します。 • 反転トレード — 反転の可能性があるゾーンや方向の変化を見つけます。 • 出来高トレード — 出来高に基づく情報を使い、市場の活発さを評価します。 エントリー・決済の矢印、トレンド情報、サポート・
Zoryk Gold
Reda El Koutbane
5 (15)
割引は 24 時間後に終了します — 次の価格は$ 69 ZORYK — MetaTrader 5専用 XAUUSDシグナル・トレードプランニングシステム このような経験はありませんか。 ゴールドを分析し、エントリーを待ち、ようやくポジションを持った直後に価格が逆方向へ動く。 早すぎる決済をしてしまったり、Stop Lossを動かしたり、数秒迷っている間にチャンスを逃したりする。 その後、相場は自分が最初に予想していた方向へ進み、目標へ到達する。 問題は常に方向判断ではありません。 本当の問題は、明確な計画がなかったことです。 どこでエントリーすべきか。 どこでトレードの前提が無効になるのか。 近い利益を確保すべきか、より大きな値動きを待つべきか。 現在のsetupが本当に強いのか、それとも無理にトレードを探しているだけなのか。 ゴールドは非常に速く動きます。 正しい分析でも、明確なプランがなければ数秒で悪い判断に変わることがあります。 ZORYKは、その問題を解決するために開発されました。 ZORYKとは ZORYKは、MetaTrader 5とXAU
SuperScalp Pro
Van Minh Nguyen
4.66 (35)
SuperScalp Pro - Professional Multi-Layer Confluence Scalping System SuperScalp Proは、クラシックなSupertrendに複数のインテリジェントな確認フィルターを追加した、高度なスキャルピングインジケーターです。より高い確率が期待できるBuy/Sellの取引機会を特定し、ダマシのシグナルを大幅に減らすことをサポートします。 明確なBuyとSellの矢印がチャート上に直接表示され、ATRに基づくStop LossとTake Profitのレベルがリアルタイムで自動計算されます。 購入後、設定方法や推奨設定についてのサポートが必要な場合は、私にご連絡ください。 SuperScalp Pro Auto Traderを使用して、シグナルを簡単に自動化できます: [Auto Trader] 推奨設定ファイルをダウンロード: [Set File] 完全なドキュメントは製品ブログでご覧いただけます: [User Guide] 最新情報を受け取るには公式チャンネルに参加してください: [Official Channel]
SMC Intraday Formula
VividMind Digital Solutions
5 (26)
まず正直に言いましょう。 どんなインジケーターも、それ単体であなたを利益化させることはできません。もしそう言う人がいるなら、それは夢を売っているだけです。完璧な売買シグナル(矢印)を表示するインジケーターは、いくらでも“完璧に見せる”ことができます。正しい過去の区間を拡大して、勝ちトレードだけを切り取ればいいだけです。私たちはそれをしません。 SMC Intraday Formula はツールです。 市場構造を読み取り、最も高い確率の価格ゾーンを特定し、今この瞬間のスマートマネーの痕跡をシンプルな言葉で正確に示します。最終判断はあなたが行います。トレードを実行するのもあなたです。しかし今は「希望」ではなく「精度」でエントリーできます。 私たちはこのインジケーターを、ゴールド(XAUUSD)および主要FX通貨ペアで約3年間、日々のスキャルピングに使用してきました。M1、M5、M15、M30の主要ツールです。これは未来を予測しようとするのではなく、今まさに形成されている高確率セットアップを示し、その理由を説明します。 他のすべてのインジケーターと何が違うのか? ほとんどのトレーディングイ
Gann Made Easy   は、ミスター・ギャンの理論を使用した取引の最良の原則に基づいた、プロフェッショナルで使いやすい外国為替取引システムです。 W・D・ガン。このインジケーターは、ストップロスとテイクプロフィットレベルを含む正確な買いと売りのシグナルを提供します。 PUSH通知を利用して外出先でも取引可能です。 ご購入後、取引方法の説明と優れた追加インジケーターを無料で入手するには、私にご連絡ください! おそらく、ギャンの取引手法についてはすでに何度も聞いたことがあるでしょう。通常、ギャンの理論は初心者のトレーダーだけでなく、すでにある程度の取引経験がある人にとっても非常に複雑なものです。なぜなら、ギャンの取引手法は理論的にはそれほど簡単に適用できるものではないからです。私はその知識を磨き、最良の原則を私の外国為替インジケーターに組み込むために数年を費やしました。 このインジケーターは非常に簡単に適用できます。必要なのは、それをチャートに添付し、簡単な取引推奨事項に従うだけです。このインジケーターは常に市場分析の仕事を行い、取引の機会を探します。適切なエントリーポイントを検
新たな王者が登場 - インジケーター + 注文管理表示(TP1 + TP2 + TP3)+ オプションのTelegramシグナル送信機能付き(無料) (完全なトレード&シグナルシステム) ゴールド向け最高のEA: Gold Slayer このインジケーターには、高度な戦略、カスタマイズ可能な注文管理システム、そしてエンベロープ拡張を組み合わせた平均回帰システムが搭載されています。さらに、RSIなど複数のインテリジェントな確認フィルターによって、高確率の反転エントリーをBUY・SELLシグナルとして検出します。 単にトレードを学ぶだけでなく、複数ポジションを効果的に管理し、過去に利益を出しているオープンポジションで損失トレードをカバーする方法も学べます。 M5向けに構築・最適化されており、流動性が高くシグナルの精度が安定しているBTCUSDとXAUUSDで優れたパフォーマンスを発揮します。 このインジケーターは、ATRを基に自動計算されたエントリー、ストップロス、テイクプロフィットレベルを備えた明確なLong・Shortシグナルを提供するため、リスク管理が最初から組み込まれています。 マ
GoldenX Entry MT5
VividMind Digital Solutions
5 (16)
GoldenX Entryは、MT5向けのインジケーターであり、適応型Smart Entry Trendアルゴリズム、シグナルスコアリングシステム、マーケットレジーム検出機能、およびボラティリティフィルターを備えています。各シグナルには、計算されたエントリーレベル、3つのテイクプロフィット(TP1、TP2、TP3)、およびストップロスレベルが含まれます。本インジケーターは、異なる市場環境に適応するために設計された複数の分析レイヤー上に構築されており、マルチレイヤー分析システムと内蔵オプティマイザーおよび統計トラッキングシステムを組み合わせています。リスク・リワード(RR)指標および過去のトレード履歴に基づく定量分析を提供します。 使い始めは簡単です — 選択した時間足でオプティマイザーを実行し、そのままチャート上でインジケーターを使用します。 コア機能 GoldenX Entryは、シグナルエンジンとトレード管理機能、そして過去統計トラッキングを1つのチャートに統合しています: - 内蔵オプティマイザー: オプティマイザーはチャート上でワンクリックで実行できます。200通りのパラメー
ARIPoint
Temirlan Kdyrkhan
1 (4)
ARIPoint is a powerful trading companion designed to generate high-probability entry signals with dynamic TP/SL/DP levels based on volatility. Built-in performance tracking shows win/loss stats, PP1/PP2 hits, and success rates all updated live. Key Features: Buy/Sell signals with adaptive volatility bands Real-time TP/SL/DP levels based on ATR Built-in MA Filter with optional ATR/StdDev volatility Performance stats panel (Success, Profit/Loss, PP1/PP2) Alerts via popup, sound, push, or email Cu
Auto Optimized SpeedAngle は、継続的なウォークフォワード最適化(WFO:Walk-Forward Optimization)によりカーブフィッティング(過剰最適化)を排除した、機関投資家レベルのモメンタムベクトルシステムです。市場レジームの変化時に効果が低下する静的な入力に依存せず、アウトオブサンプル(OOS)検証を用いてパラメーターを動的に再キャリブレーションすることで、表示されるシグナルが単なる過去の偶然ではなく、確実な統計的優位性に基づいていることを保証します。 主な機関投資家向けフレームワーク ウォークフォワード最適化エンジン: ルックバック期間やしきい値の数千に及ぶ組み合わせを継続的にスキャンし、データをインサンプルとアウトオブサンプルに厳格に分離します。未検証のデータ環境において数学的優位性が証明された場合にのみ、新しいパラメーター設定を採用します。 定量的目的関数: 単なる純利益の追求ではなく、機関投資家レベルの安定性指標をターゲットとします。システム品質ナンバー(SQN)、期待値(1トレードあたりの平均Rマルチプル)、またはネットRの最適化を選
Neuro Poseidon is a new indicator by Daria Rezueva. It combines precise trading signals with adaptive TP/SL levels - creating best possible trades as a result! Message me and get  Neuro Poseidon Assistant  as a gift to automize your trading process! What makes it stand out? 1. Proven profitability on all assets and timeframes 2. Only confirmed BUY and SELL signals present on the chart 3. Adaptive TP & SL levels generated by the software for each trade 4. Easy to understand - suitable for al
伝説が帰ってきました:Entry Points Pro 10。 MQL5 Marketのトップ3に3年間入り続けた伝説的インジケーターの再始動です。 2つのバージョンで合計589件の高評価レビュー、毎日数千人のトレーダーが実際のトレードに使用し、デモのダウンロードは31,000件以上   MT4+MT5 。 私はこの5年間に寄せられたレビューをすべて読み、約束を並べる代わりに、その答えをバージョン10に組み込みました。1999年から相場に携わり、 誠実さ、自らの評判、そして顧客を大切にする 作者による製品です。 Entry Points Proのエントリーシグナルは、リペイント(再描画)を一切行いません。 そして今回初めて、これは作者の言葉ではなく検証可能な事実になりました。確定シグナルはローソク足の終値確定後にのみ表示され、自動テストで リペイントはゼロ と確認されています(EURUSD、XAUUSD、BTCUSDで2,486,568回の不変条件チェック、違反0件)。検証方法は公開されており、ストラテジーテスターでご自身で再現できます。 ご購入後は、必ずすぐにダイレクトメッセージでご
FiboSniper Pro – Multi-Filter Fibonacci System with Auto SL/TP and Control Panel FiboSniper Proは、動的なFibonacci Envelopesと複数の確認フィルターを組み合わせ、選別されたBuyおよびSellシグナルを生成するテクニカルインジケーターです。FibonacciレベルはMoving AverageとATRを基に計算され、その後ADX、EMA、RSI、ATR、Volume、Time、Candle構造によってフィルタリングされます。インジケーターは、ATRに基づく自動Stop LossおよびTake Profitレベルをチャート上に直接表示し、さらに迅速な調整が可能なインタラクティブControl Panelを提供します。 購入後、推奨設定ファイルと詳細な使用方法については、私にご連絡ください。 Auto Trader Xを使用してFiboSniper Proのシグナルを自動化できます: [Auto Trader X] User GuideとSet Files: [Click her
Welcome to ENTRY IN THE ZONE AND SMC MULTI TIMEFRAME  SPECIAL BENEFIT / FOR OUR MQL5 CUSTOMERS FREE ACCESS TO THE NEW TOOL  — COMING SOON — Learn more on our official website  : https://www.fableedge.net Entry In The Zone and SMC Multi Timeframe is a real-time market analysis tool based on Smart Money Concepts (SMC) , designed to analyze market structure, price direction, and key trading zones. It supports both Single-Timeframe and Multi-Timeframe Analysis , providing a clearer view of overall m
Unix Scalper — MetaTrader 5 ご購入後、MQL5で私にメッセージをお送りいただくと、Smart Universal Expert Advisorを無料で受け取れるほか、オンライン講座、PDFマニュアル、非公開グループへのアクセスもご利用いただけます。 セットアップを見つけ、取引プランを確認し、取引方法を選ぶ。 UNIX Scalperは、市場分析、BUY/SELL/WAITの判断、Entry、Stop Loss、TP1、TP2の水準を、見やすいパネルにまとめています。 シグナルと取引プランを確認 • 明確な判断:BUY、SELL、WAIT。 • 明示された水準:Entry、Stop Loss、TP1、TP2。 • 複数時間足の一覧:パネル上で各時間足のシグナルを比較。 • 判断を支える分析:トレンド、モメンタム、出来高、ボラティリティ、サポートとレジスタンス、市場の質。 • 選べるレイアウト:Minimized、Compact、Standard、Full。 シグナルと各水準を確認し、そのセットアップがご自身の取引ルールに合うか判断してください。 ゴール
M1 SNIPER は使いやすいトレーディングインジケーターシステムです。M1時間足向けに設計された矢印インジケーターです。M1時間足でのスキャルピングのためのスタンドアロンシステムとして、また既存のトレーディングシステムの一部としても使用できます。このトレーディングシステムはM1時間足での取引に特化して設計されていますが、他の時間足でも使用できます。元々、この手法はXAUUSDとBTCUSDの取引用に設計しましたが、他の市場においても役立つと考えています。 インジケーターのシグナルは、トレンドの方向と逆方向に取引できます。インジケーターのシグナルを利用して両方向に取引するのに役立つ特別な取引テクニックをご紹介します。この手法は、特別な動的なサポートとレジスタンスの価格帯を利用することに基づいています。 ご購入後、M1 SNIPER矢印インジケーターをすぐにダウンロードできます。さらに、M1 SNIPERツールのすべてのユーザーに、以下のスクリーンショットに表示されているApollo Dynamic SRインジケーターを無料で提供しています。この2つのインジケーターを組み合わせることで
Tokyo Indicatorは、トレンドの方向性、潜在的な取引シグナル、および市場状況を視覚的に分かりやすく表示します。 色分けされた階段状のトレンドラインにより、強気局面(青色)と弱気局面(マゼンタ色)が明確に区別されます。トレンドの変化に合わせて表示される方向矢印は、売買の好機を強調します。 統合されたダッシュボードには、現在のシグナル、市場のバイアス(傾向)、モメンタム、ボラティリティ、シグナルの品質がひと目で分かるようにまとめられています。これにより、トレーダーはパネルを切り替えることなく、価格変動(プライスアクション)とインジケーターの数値を照らし合わせて分析を行うことができます。 すっきりとしたチャート表示と簡潔な市場概要により、Tokyo Indicatorはトレンド分析や取引判断における体系的なアプローチをサポートします。 あらゆる時間足や銘柄に対応しており、特に金(ゴールド)の取引に適しています。 トレンド スキャナーの強力なサポートを利用して、無料のインジケーターを入手し、プライバシーを守ります。あーみー!     設定 ShowHUD - チャート上のパネ
Gold Entry Sniper – ゴールドスキャルピング&スイングトレード用プロフェッショナル多時間足ATRダッシュボード Gold Entry Sniper は、XAUUSDや他の銘柄向けに正確な 売買シグナル を提供する、MetaTrader 5用の高度なインジケーターです。 ATRトレーリングストップロジック と 多時間足分析ダッシュボード を搭載し、スキャルピングからスイングトレードまで対応します。 主な特徴と利点 多時間足シグナル分析 – M1、M5、M15 のトレンドを同時表示。 ATRベースのトレーリングストップ – ボラティリティに応じて動的に調整。 プロ仕様のチャートダッシュボード – シグナル状況、ATRレベル、回帰線、売買方向を表示。 明確な売買マーカー – 自動矢印とテキストラベル。 エグジットアラートとトレード管理 – 利益確定のための自動検出。 完全カスタマイズ可能 – パネル位置、色、フォント、ATR/回帰設定を調整可能。 ゴールド(XAUUSD)に最適化 – M1〜M15のスキャルピングに最適、FXや指数、暗号資産にも対応。 Gold Entry
FX Trend NG:次世代マルチマーケット・トレンドインテリジェンス 概要 FX Trend NG は、複数の時間足に対応したプロフェッショナル向けトレンド分析およびマーケット監視ツールです。 市場全体の構造を数秒で把握することができます。 複数のチャートを切り替える必要はありません。どの銘柄がトレンド中なのか、どこでモメンタムが弱まっているのか、そしてどの時間足で強い整合性があるのかを瞬時に確認できます。 ローンチ特別オファー – FX Trend NG を $30(6ヶ月) または $80 永久ライセンス でご利用いただけます。 すでに Stein Investments のユーザーですか? -> メッセージを送信 して、プライベートグループへアクセスしてください。 セットアップや詳細情報が必要ですか? -> Stein Investments 公式ページ をご覧ください。 1. FX Trend NG が他と異なる理由 3ステート・トレンドロジック ― Buy と Sell だけではない • 多くのインジケーターは Buy または Sell の2状態のみを表示します。
Adaptive Price Action Engine インジケーターを購入すると、EAが無料に マルチタイムフレーム対応・自己最適化トレンド&ローソク足パターン分析 市場環境は常に変化しており、すべてのPrice Actionパターンが、あらゆる市場環境で同じ価値を持つわけではありません。 Adaptive Price Action Engine は、変化する市場環境への適応を目的として、 トレンド構造、マルチタイムフレーム分析、ローソク足パターン、統計的最適化 を1つの分析フレームワークに統合しています。 2つのアダプティブモード Dual Alpha Trend Mode 低い時間足と高い時間足のAlpha Trendパラメータを自動的に探索し、直近の市場動向に合わせてトレンド判定を適応させます。 Candlestick + Alpha Mode Alpha Trendによる市場レジーム判定と、 22種類の強気・弱気ローソク足パターン を組み合わせます。すべてのパターンを同じように扱うのではなく、さまざまなパターンの組み合わせを統計的に評価し、選択された市場環境において過去
Smart Price Action Concepts — MetaTrader 5 ご購入後、MQL5で私にメッセージをお送りいただくと、Smart Universal Expert Advisorを無料で受け取れるほか、オンライン講座、PDFマニュアル、非公開グループへのアクセスもご利用いただけます。 構造を確認し、ゾーンを見つけ、取引プランを立てる。 Smart Money Concepts(SMC)、ICTスタイルの分析、プライスアクションを、見やすいチャートにまとめます。市場構造、オーダーブロック、流動性の参考水準、インバランスを確認し、Smart Panelで表示する要素を選択できます。 市場をより体系的に分析 • 市場構造:内部構造とスイング構造、HH/HL/LL/LH、BOSとCHoCH、上位時間足分析、複数時間足ダッシュボード。 • 主要ゾーン:内部およびスイングのオーダーブロック、需給ゾーン、Fair Value Gaps、プレミアム・均衡・ディスカウントゾーン。 • 流動性の参考水準:同値高値・安値、強い・弱いスイングポイント、前日・前週・前月の高値と安値。
Power Candles V3 - 自己最適化型強弱インジケーター Power Candles V3は 、通貨や銘柄の強さを、適用されたすべてのチャート上で実行可能なトレードプランに変換します。単にローソク足を色分けするだけでなく、バックグラウンドでリアルタイムの自動最適化を実行し、目の前の銘柄に対して最適なストップロス、テイクプロフィット、およびシグナルの閾値を提示します。ワンクリックで実取引に適用でき、エントリーポイント、ストップロス、テイクプロフィットのラインが正確な価格位置にチャート上に表示され、方向性を示すアラートがリアルタイムで発動します。 このツールは、Stein Investmentsのエコシステムの一部です。  18種類以上のツールをすべて閲覧し、AIを活用したセットアップの推奨事項を入手し、  https://stein.investments でコミュニティに参加しましょう クローズしたバーごとに3,000回以上のトレードシミュレーション。9つの強さの状態。2つの戦略を並行してテスト。勝率の高い設定をワンクリックで適用。 なぜこれが必要なのか ほとんどの強
Market Structure Order Block Dashboard MT5 は、市場構造と主要な価格反応ゾーンをチャート上で直接読み取りたいトレーダー向けに設計された MT5 インジケーターです。BOS、ChoCH、オーダーブロック、Fair Value Gap (FVG)、流動性、Kill Zones、Volume Profile、そして素早い分析のためのコンパクトなダッシュボードを組み合わせています。 本インジケーターは、市場構造、ICT、Smart Money の概念を意思決定の枠組みとして使用するトレーダーを対象としています。トレンド継続、反転の可能性、価格の不均衡、流動性ターゲット、注目ゾーンをより構造的に特定する助けとなります。 購入者向けの付属リソース 購入後、MQL5 のプライベートメッセージにてご依頼いただくと、完全な PDF ユーザーガイドとパラメータ設定のヒントを提供いたします。MQL5 のプライベートメッセージによる直接的な技術サポート。 バージョン 1.20 では 2 つの重要な追加機能があります: Pending BOS / Pending Cho
Scalper Vault は、スキャルピングを成功させるために必要なすべてを提供するプロフェッショナルなスキャルピング システムです。このインジケーターは、外国為替およびバイナリー オプションのトレーダーが使用できる完全な取引システムです。推奨される時間枠は M5 です。 システムは、トレンドの方向に正確な矢印シグナルを提供します。また、トップとボトムのシグナルとギャン マーケット レベルも提供します。 インジケーターは、プッシュ通知を含むすべてのタイプのアラートを提供します。 インジケータの購入後にご連絡ください。私の個人的な取引の推奨事項と素晴らしいボーナス指標を無料で共有します! 幸せで有益な取引をお祈りします!
Atomic Analyst — MetaTrader 5 ご購入後、MQL5で私にメッセージをお送りいただくと、Smart Universal Expert Advisorを無料で受け取れるほか、オンライン講座、PDFマニュアル、非公開グループへのアクセスもご利用いただけます。 Atomic Analystは、プライスアクション、トレンドの方向、エントリー・決済シグナル、損切り水準、複数の利確水準をチャート上にまとめて表示します。 シグナルを確認し、取引の状況を理解する Atomic Analystは、分析結果をわかりやすい視覚情報として表示します。 • エントリーの候補を見つけるための買い・売りの矢印。 • 取引計画に役立つ損切り水準と複数の利確水準。 • 市場の方向性を評価するトレンド、強さ、モメンタムの指標。 • より広い市場背景を比較する複数時間足の分析。 • 変化する状況を追うための色分けされたローソク足とアラート。 シグナルと補助分析を併せて確認し、その取引機会がご自身のルールに合うかを判断してください。 短期の取引機会から、より大きな値動きまで Atomic A
FX Power: 通貨の強弱を分析して、より賢い取引を実現 概要 FX Power は主要通貨と金の実際の強弱をあらゆる市場状況で理解するための必須ツールです。強い通貨を買い、弱い通貨を売ることで、 FX Power は取引の意思決定を簡素化し、高い確率の取引機会を見出します。トレンドを追従する場合でも、極端なデルタ値を使用して反転を予測する場合でも、このツールはあなたの取引スタイルに完全に適応します。ただ取引するだけではなく、 FX Power で賢く取引をしましょう。 1. なぜ FX Power がトレーダーにとって非常に有益なのか 通貨と金のリアルタイム強弱分析 • FX Power は主要通貨と金の相対的な強弱を計算し、マーケットダイナミクスに関する明確な洞察を提供します。 • どの資産がリードしているか、または後れを取っているかを監視して、取引するペアを賢く選びましょう。 マルチタイムフレームの包括的なビュー • 短期、中期、長期のタイムフレームで通貨と金の強弱を追跡し、マーケットトレンドに基づいて取引戦略を調整できます。 • スキャルピングからスイングトレード
このインジケーターを購入された方には、以下の特典を 無料 で提供しています: 各トレードを自動で管理し、ストップロスとテイクプロフィットを設定し、戦略ルールに基づいてポジションを決済する補助ツール 「Bomber Utility」 様々な銘柄に合わせたインジケーターの設定ファイル(セットファイル) 「最小リスク」、「バランスリスク」、「待機戦略」 の3つのモードで使用できる Bomber Utility 用の設定ファイル このトレーディング戦略をすぐに導入・設定・開始できる ステップバイステップのビデオマニュアル ご注意: 上記の特典を受け取るには、MQL5のプライベートメッセージシステムを通じて販売者にご連絡ください。 オリジナルのカスタムインジケーター 「Divergence Bomber(ダイバージェンス・ボンバー)」 をご紹介します。これは、MACDのダイバージェンス(乖離)戦略に基づいた 「オールインワン」型のトレーディングシステム です。 このテクニカルインジケーターの主な目的は、価格とMACDインジケーターの間に発生するダイバージェンスを検出 し、将来の価格の動きを示
Crystal Heikin Ashi Signals—Professional Trend & Signal Detection Indicator Advanced Heikin Ashi Visualization with Intelligent Signal System for Manual & Automated Trading Final Price: $149 ---------> Price goes up $10 after every 10 sales . Limited slots available — act fast . Overview User Guide PDF Crystal Heikin Ashi Signals is a professional-grade MetaTrader 5 indicator that combines pure Heikin Ashi candle visualization with an advanced momentum-shift detection system. Designed for both m
DayTrader PRO DayTrader PROは、ジョン・エリュース(John Ehlers)のラグuerreフィルターと強力な自動最適化エンジンを組み合わせた、高度なトレーディング・インジケーターです。固定されたパラメーターを使用するのではなく、直近の市場状況に基づいて最適な設定を自動的に検索するため、手動による絶え間ない調整をすることなく、変化する市場のボラティリティに適応できます。 本インジケーターは、明確な「買い(BUY)」および「売り(SELL)」シグナルを生成し、現在の市場ボラティリティから算出された適応型のストップロス(Stop Loss)およびテイクプロフィット(Take Profit)レベルを表示します。トレンド、効率レシオ(Efficiency Ratio)、ボラティリティ、およびローソク足フィルターが内蔵されており、精度の低いセットアップを排除し、シグナルの精度を向上させます。 リアルタイム・パフォーマンスパネルには、現在最適化されている設定、プロフィットファクター(Profit Factor)、勝率(Win Rate)、ドローダウン(Drawdown)、
Quant Direction は、3次元の市場分析ツールです。完全に客観的なアルゴリズムベースの市場分析を提供し、様々なパラメータにわたる正確なパーセンテージ偏差を同時に算出します。高度なAI搭載モデリングツールで開発され、厳密なテストを経て開発されたこのアルゴリズムは、かつてない精度で市場を分析するように設計されています。プラットフォーム上では、あらゆる通貨ペアや金融商品を分析できます。 短期取引、デイトレード、スイングトレードなど、どのような取引スタイルに も、Quant Directionは最適な選択肢です。 オペレーターの本当の利点 Quant Directionの真の利点は、感情、眼精疲労、過剰分析を完全に排除できる点にあります。方向性を探るために何十ものチャートを手作業で精査したり、自分の好みを常に疑ったりする必要がなくなります。このシステムは、8つの時間間隔(5ヶ月から月単位まで)をミリ秒単位で処理します。あらゆる瞬間に市場を支配している主体を正確に明らかにし、常に成功確率が最も高い方向で取引できるようにします。 市場分析の3つの側面 このアルゴリズムは市場を3つの
作者のその他のプロダクト
JK-Top Hedge — Two-Sided Hedged Grid EA for MetaTrader 5 Overview JK-Top Hedge is an Expert Advisor for MetaTrader 5. It places a Buy Stop above the current price and a Sell Stop below it at the same time, building two grid lines on either side of the market. When one pending order is filled, the EA places the next one further away, and the cycle repeats. Because long and short positions exist at the same time, a floating loss on one side can partly be offset by the other. The EA closes or reduc
Automatic Support and Resistance Levels with Breakout Tracking Product name note: the file name and the indicator short name in the source are AutomaitcSR . The correct spelling AutomaticSR is recommended before submission. Use one identical name for the file, the short name and the Market product title. Short description (for the Market product card) Automatic support and resistance levels built from confirmed swing pivots, with ATR-based filtering, optional level zones, breakout marking and a
FREE
BBOscillator — Candle Coloring with Andean Oscillator States and ATR Stop Levels Overview BBOscillator is a technical indicator for MetaTrader 5 that is drawn in the main chart window. It combines the Andean Oscillator state logic, candle coloring, dynamic ATR stop levels and state-change marks in a single visual layer, so that four questions can be answered by looking at one chart: whether the direction is defined, which side it leans to, where the direction state started, and where a stop refe
FREE
Trend Reversal Probability Overview Trend Reversal Probability is an analytical indicator for MetaTrader 5. It does not open, close or manage trades. Its purpose is to describe one specific property of the market in numbers: how long the current directional state of a smoothed momentum oscillator has already lasted, and how unusual that duration is compared with the same measurement on previous occasions. The indicator runs in a separate window. On every bar it updates the duration of the curren
FREE
TrendReferenceLine — Adaptive Trend Line with ATR Channel and Auto Trade Levels Short description: ​ An adaptive trend line indicator that switches color with trend direction, marks confirmed reversals with arrows, and automatically plots entry, stop loss and three R-multiple targets on the chart. Type: ​ Trend-following technical analysis indicator (not an automated trading robot). What it does In trend trading, three questions matter most: has the direction changed, where does the stop go, and
FREE
Trendfollowingline (ATR Based Trend Following Indicator) Overview Trendfollowingline is a trend following indicator drawn in the main chart window. It uses the Average True Range (ATR) as a measure of market volatility and plots a band around the price: while the direction is up, the band is placed below the price and moves upwards; when the direction turns down, the band switches above the price and moves downwards. An arrow marker is drawn on the band each time the direction changes. The indic
FREE
Deviation Trend Profile Overview Deviation Trend Profile is a MetaTrader 5 chart indicator that combines three visual layers in a single chart window: a moving average with momentum-based coloring, deviation bands calculated from volatility, and a horizontal distribution profile drawn to the right of the current price. The indicator is an analytical tool. It does not open, modify or close trades, and it is not a complete trading system. It is designed to help the user observe trend direction, mo
FREE
RSI Support Resistance Signals Platform: MetaTrader 5 RSI Support Resistance Signals adds zone coloring and signal labels to the standard RSI. The indicator does not execute trades. Signals: Sell: RSI is in the overbought zone and turns down, or RSI is in the resistance zone and a bearish candle with an upper wick is detected. Buy: RSI is in the oversold zone and turns up, or RSI is in the support zone and a bullish candle with a lower wick is detected. Each signal can show a user-defined Engli
FREE
Overview QuantifiedTrends is a MetaTrader 5 indicator that runs in a separate chart sub-window. It describes momentum conditions through three calculation layers: Primary QQE layer: an RSI-based structure that uses smoothing and the smoothed RSI's own variation to build adaptive upper and lower bands and a primary QQE trend line. Statistical envelope layer: Bollinger Bands applied to the deviation of the primary QQE trend line from the 50 midline, used to determine whether primary momentum readi
FREE
EF Percentage Channel A trend-state indicator that combines volatility-adaptive averaging, an Ehlers nonlinear filter, and statistical percentile bands into a single, self-adjusting channel. Overview The indicator builds an adaptive trend baseline on the chart and wraps it with statistical percentile bands. When price moves above the upper band, the market is flagged as bullish; below the lower band, bearish; inside the channel, the previous state is retained. The trend line, channel bands, cand
FREE
HubDynamicTrendLine This indicator identifies strict pivot highs and lows based on N bars to the left and right (default 15), connecting consecutive pivots of the same type to build a dynamic channel with upper and lower boundaries. Key Features Pivot Connections : Consecutive pivot highs and pivot lows are connected with solid trend lines, forming a visible channel structure. Slope Projection : When the price difference between two consecutive pivots of the same type is at least one 200-period
FREE
Trend Pressure Oscillator Trend Pressure Oscillator is a separate-window analytical indicator for MetaTrader 5. It evaluates buying and selling pressure across multiple timeframes to help identify potential exhaustion points and market regime shifts. This tool does not generate trading signals automatically and does not execute trades. It is designed to be used as part of a broader technical analysis approach. Functionality Multi-range pressure analysis using Williams %R over three periods (Pul
FREE
MA Valuation Fluctuations measures how far the current price stands from its moving average. The deviation is expressed in units of dispersion and then compressed by a hyperbolic tangent into a fixed range from -1.0 to +1.0. The indicator is drawn in a separate window and can be used as a context filter next to a trend following or a mean reversion approach. What the indicator shows For every bar the indicator compares the selected price with a moving average in logarithmic terms. Because the r
FREE
High Time Candlestick Chart Visualize the current higher-timeframe candle directly on your lower-timeframe chart. This indicator projects the OHLC data of a selected higher timeframe ​ (M15, H1, H4, D1, or W1) onto your current chart as a graphical candlestick, offset to the right of the live price area. It helps you keep the bigger-picture candle structure in view without switching timeframes. Features Graphical HTF candle : Body, upper wick, and lower wick drawn as chart objects, colored by bu
FREE
Inverse Probability Distribution — Pivot Density and K-Means Clustering Indicator Platform: MetaTrader 5 Overview This indicator is a technical analysis visualization tool for MetaTrader 5. It identifies confirmed pivot highs and lows on historical bars, groups pivot prices with K-Means clustering, and draws an inverse distribution profile on the right side of the chart. The profile shows the density of historical pivot prices at different price levels. The indicator does not generate trading s
FREE
Dual Period Filter — Adaptive Coppock Curve for MT5 Overview The Coppock Curve is built from the sum of a long and a short rate of change, smoothed afterwards, and is used to observe the direction and strength of medium-term momentum. This indicator extends the classic calculation in two ways. First, the price source passes through an optional adaptive filter before the momentum is calculated. Nine filter types are available: None, SMA, EMA, RMA, Double WMA, Triple VWMA, HMA, LLAMA and Kalman.
FREE
Intraday Spark Chart Overview Intraday Spark Chart is an MT5 indicator for intraday analysis. It converts the current price change of a symbol into a percentage of the daily opening price and plots the result in a separate subwindow. Every trading day starts again from the zero line, so each day is drawn as a separate segment and the intraday move of the current day can be observed directly. The indicator is a data visualization tool. It does not generate trading signals and does not provide inv
FREE
Adaptive MACD - R² Based Adaptive MACD Indicator Overview Adaptive MACD is an innovative MetaTrader 5 indicator that improves upon the traditional MACD. By introducing the Pearson correlation coefficient to calculate the R² value of price trends, this indicator can adapt to market conditions and dynamically adjust its sensitivity. It helps traders capture trends more effectively while filtering out market noise. How It Works Traditional MACD uses a fixed difference between fast and slow EMAs. Ad
FREE
MACandleApprox — Moving-Average Approximate Candle Indicator MACandleApprox is a custom indicator that, on the main price chart, applies a selected type of moving average to the open, high, low, and close price series respectively, and replots them as "approximate candles". It does not modify the original candlesticks; instead, it overlays a smoothed candle view based on moving averages, helping traders observe the smoothed price movement and directional changes more intuitively. The indicator s
FREE
# MASignalPanel — Multi-MA Signal Panel with Trend Filter ## Overview MASignalPanel is an all-in-one moving-average signal indicator designed for MetaTrader 5. It combines up to three moving averages (SMA, EMA, SMMA, LWMA) with four trade signal modes — Cross, Breakout, Pullback and Channel — and adds a higher-timeframe trend filter line (default EMA240) to keep you on the right side of the market. A fully interactive control panel lets you change MA type, MA count, periods, s MA indicator, movi
FREE
ZigZag Trader EA - Intelligent ZigZag Trading Assistant Introduction ZigZag Trader EA is a fully automated trading assistant based on the ZigZag indicator. It intelligently identifies previous highs and lows of the ZigZag indicator, combined with an advanced risk management system, to provide you with precise trading signals and automated trade execution. Whether you are a novice or experienced trader, ZigZag Trader EA can help you simplify trading decisions and achieve stable trading performa
Fibonacci Confluence Suite Short description Fibonacci Confluence Suite is a chart-window indicator for MetaTrader 5. It builds a Fibonacci grid from confirmed swing highs and lows, marks the levels where projections from earlier swings overlap, and adds a Golden Pocket zone, Fibonacci time zones, touch statistics and a compact status panel. All levels are calculated from closed bars only. Overview Drawing retracement levels by hand usually means three separate steps: finding the swing, pulling
MACandleApproxPro — Advanced MA Candle Reconstruction & Multi-Dimensional Market Structure Indicator Overview MACandleApproxPro ​ is a comprehensive technical analysis tool designed for professional traders. It breaks through the limitations of traditional moving averages by reconstructing MA data into "MA Candles" ​ through complex algorithms. This unique visualization filters out market noise, allowing you to examine price trends, momentum shifts, and critical market structures from a more
SweepReversalMap — 流動性スイープ反転ゾーン・マッピング指標 概要 SweepReversalMapは、プライスアクション(Price Action)ベースのカスタム指標で、市場における「Liquidity Sweep(流動性スイープ)」イベントを識別し、価格がreclaimした後に潜在的な反転ゾーンをマッピングします。あらゆる銘柄と時間足に適用できます。 コアロジック スイング点検出:ユーザー設定のSwing Lengthに基づき、直近の有効なスイング高値 / 安値を識別します。 スイープ判定:価格がスイング高値を上抜け(またはスイング安値を下抜け)し、ATRフィルターの最小侵入閾値に達したとき、候補反転パターンを開始します。 Reclaim確認:終値がスイープ水準の内側に戻ったとき、reclaimと見なします。 構造ブレイク確認:終値がさらに局部構造の安値 / 高値を突破し、ローソク足実体がATRフィルターの最小変位要件を満たしたとき、シグナルが確定します。 無効化ルール:最大確認バー数を超えても確定しない場合、候補パターンは自動的に削除されます。 主な機能 チ
JK-Taurus Expert Advisor A grid-based scaling EA driven by trend and signal confirmation. Overview JK-Taurus is a fully automated trading system designed specifically for the MT5 platform. It integrates multi-timeframe trend analysis, signal confirmation, and a dynamic grid-based position-building strategy, aiming to capture sustained profit opportunities during trending market conditions. The EA features an intuitive visual dashboard, allowing users to monitor account status in real-time and in
SR Power Channel — Support & Resistance Power Channel Indicator Overview SR Power Channel is a main-chart visual indicator built on price extremes and ATR. It locates the highest high (resistance) and the lowest low (support) within a configurable lookback window, extends those two levels to the right, and wraps them into ATR-based channel bands. The indicator also counts bullish and bearish bars inside the window and marks the moments when price breaks above or below the channel bands with dia
Adaptive filtering trend Overview Adaptive filtering trend is a multi-layer signal filtering indicator for the MetaTrader 5 platform, built on the Coppock curve. The indicator computes a long-period and a short-period Rate of Change (ROC) of the price, sums them, and smooths the sum with a Weighted Moving Average (WMA) to obtain the Coppock curve. A set of independently switchable filters is then applied to screen the signals, and bullish or bearish crossings are marked on the main chart throug
RSI Cloud — RSI Dual Moving Average Cloud Indicator This indicator calculates RSI in a separate window, applies fast and slow moving averages to the RSI values, and displays the relative position of the two averages as a filling cloud. It also provides an optional raw RSI line, fixed 70/50/30 reference levels, and arrow markers when the fast and slow RSI averages cross. The indicator is for analysis and signal filtering only; it does not place trades. How it works Wilder RSI is calculated from
JKEFAdvancedModel — Volatility-Adaptive Trend Breakout Trading System Overview JKEFAdvancedModel is a fully automated Expert Advisor for MetaTrader 5. On the selected timeframe it adapts to market volatility to follow the trend and trade breakouts. The system evaluates the state of closed bars only, so signals are not revised by an unfinished bar. Once a direction is confirmed, the robot can enter with a market order or place a stop order at a defined distance from the current price and wait for
JKEFtrendMartingale — Volatility-Adaptive Trend-Following Martingale Trading System Overview JKEFtrendMartingale is a fully automated Expert Advisor for MetaTrader 5. On the selected timeframe it adapts to market volatility to follow the trend and trade breakouts. After a losing trade it increases the lot size of the next trade according to the configured rule, and returns to the initial lot size once profits have absorbed the accumulated loss. The system evaluates the state of closed bars only,
フィルタ:
レビューなし
レビューに返信