TrendReferenceLine
- インディケータ
-
Shi Yuan Wang
 MetaTrader 4およびMetaTrader 5用のカスタムインジケーター、エキスパートアドバイザー(EA)、スクリプト、トレーディングツール、そしてTradingView(Pine Script)用のインジケーターを作成しています。
私が提供できるサービス:
- 明確に記述された取引ルールをバックテスト可能なMQL4/MQL5 EAに変換します
- アラートとマルチタイムフレーム対応のリペイントしないカスタムインジケーターを作成します
- 既存のMT4 EA/インジケーターをMT5に移行します(またはMT5からMT4に移行します) - バージョン: 1.31
TrendReferenceLine — Adaptive Trend Line with ATR Channel and Auto Trade Levels
Short description: An adaptive trend line indicator that switches color with trend direction, marks confirmed reversals with arrows, and automatically plots entry, stop loss and three R-multiple targets on the chart.
Type: Trend-following technical analysis indicator (not an automated trading robot).
What it does
In trend trading, three questions matter most: has the direction changed, where does the stop go, and how far is the target. TrendReferenceLine answers all three on a single chart:
- Direction — a self-adjusting line that moves and recolors with the trend
- Reversal — arrows plotted exactly where the trend change is confirmed
- Execution — entry, stop loss and three targets calculated from risk (R) and drawn as horizontal levels
It is not a prediction tool. It is a tool that makes trend structure visible and actionable.
Key Features
1. Adaptive Trend Line
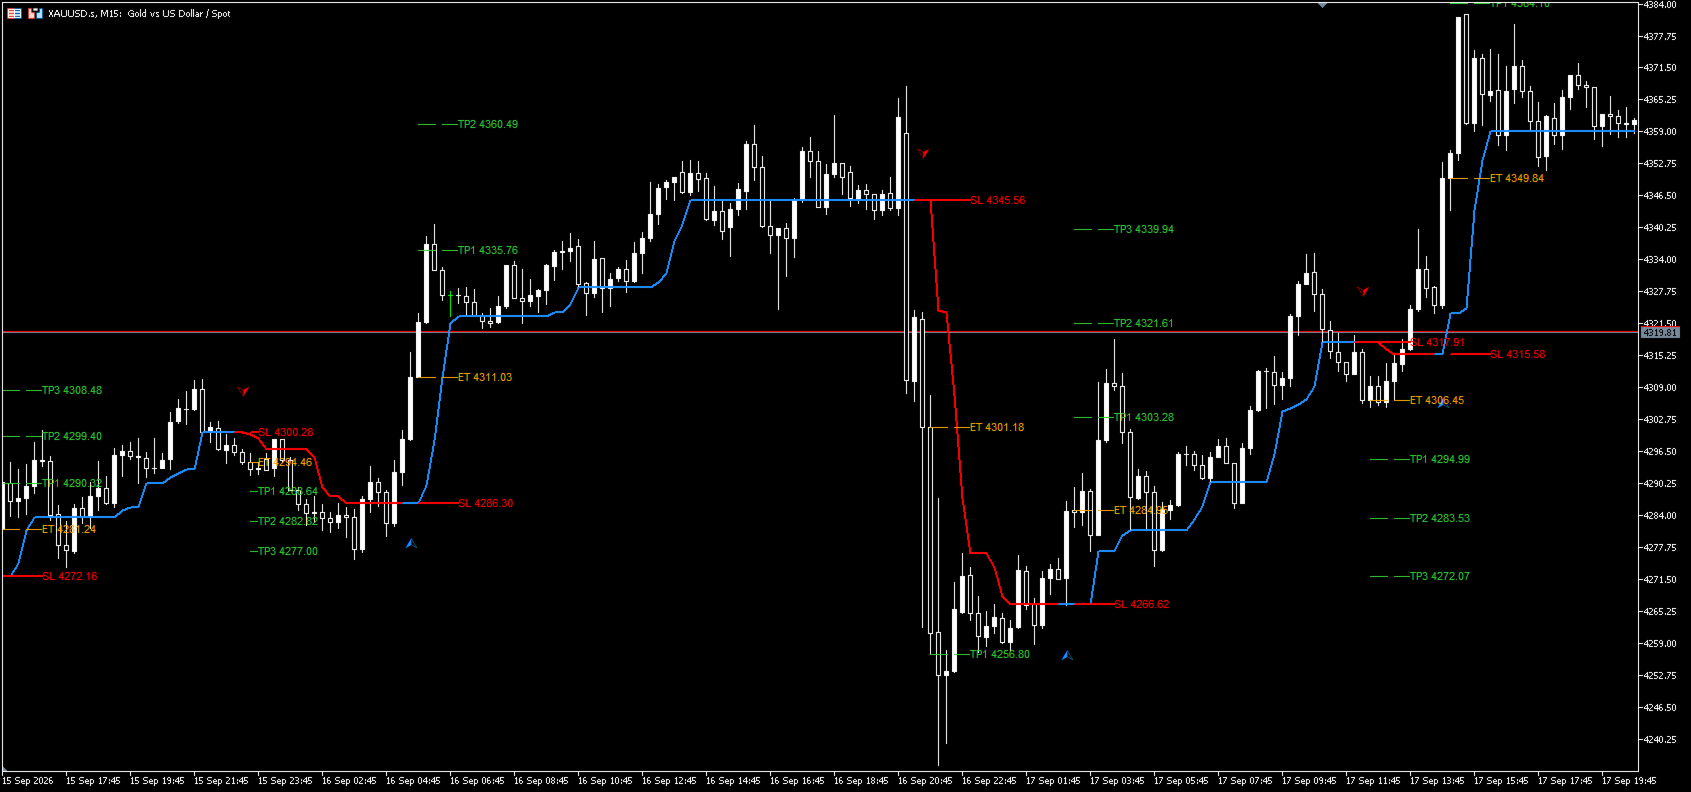
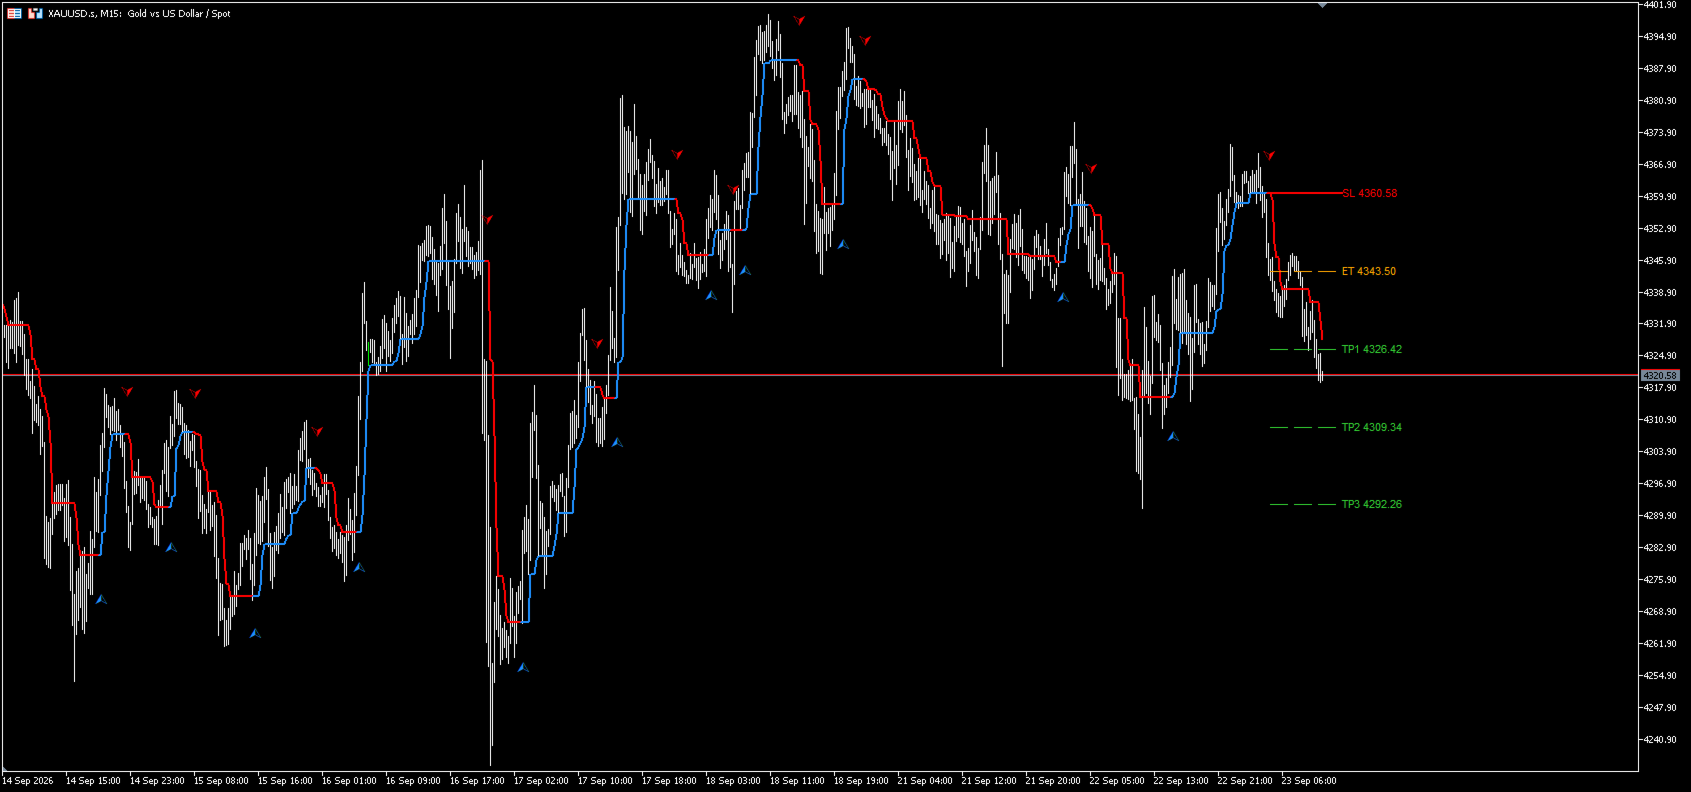
A reference line is drawn below price in an uptrend and above price in a downtrend. The line moves in a ratchet manner — it only rises during an uptrend and only falls during a downtrend — so single-bar noise cannot pull it back. This makes it usable directly as a trailing reference for an open position. The line changes color when the trend changes direction (blue for up, red for down).
2. ATR Channel and Fill
Upper and lower rails are built around the trend line using volatility (ATR) as the measuring unit, with a soft translucent fill between them. The channel widens and narrows automatically as volatility changes, which helps identify when the market enters an unusually volatile phase.
3. Reversal Arrows
When a trend change is confirmed, an arrow is placed on the corresponding bar: an up arrow for a bullish reversal, a down arrow for a bearish one. Arrows appear after confirmation and do not appear and then disappear again.
4. Automatic Trade Levels (core feature)
After each new signal, five horizontal levels are calculated and drawn automatically:
Level | Meaning |
|---|---|
ET | Entry reference — the open of the bar following the confirmed signal |
SL | Stop reference — the trend line value at the reversal point |
TP1 / TP2 / TP3 | Targets at 1R, 2R and 3R |
1R equals the distance between the entry price and the stop level. All three multiples are adjustable (for example 1R / 1.5R / 2.5R), and they can also be set to the same value if only one target is needed.
5. Historical Signal Levels
Historical signal levels can be displayed for review, up to 30 signals (adjustable), each drawn with a configurable bar width. This is intended for studying whether past setups had a sound risk/reward structure, not for judging the present bar.
6. Alerts
Optional pop-up alerts on trend reversal. Alerts trigger only on the latest bar and are de-duplicated per bar, so the same event is not reported repeatedly.
How to read the chart
- Line below price, blue — uptrend; the line itself works as a trailing reference for long positions
- Line above price, red — downtrend; the line itself works as a trailing reference for short positions
- Color change plus arrow — the trend structure has changed; the previous direction is no longer valid
- Colored horizontal level group — the risk structure of the latest signal: entry, stop and three targets at a glance
Suggested usage
- Direction filter — only consider entries that match the current line color, avoiding counter-trend trades.
- Trailing stop — move the stop along with the trend line while a position is open; a decisive break of the line signals exit.
- Target management — scale out at 1R, 2R and 3R so that the exit plan is fixed in advance rather than decided on the spot.
- Multi-timeframe — use a higher timeframe for direction and a lower one for timing, for example H4 for bias and H1 for arrow-based entries.
- Backtesting by eye — enable historical levels and check the risk/reward structure of past signals to see whether the settings fit the current symbol.
- Volatility filter — when the channel expands sharply, volatility is rising; consider reducing size or waiting for it to contract.
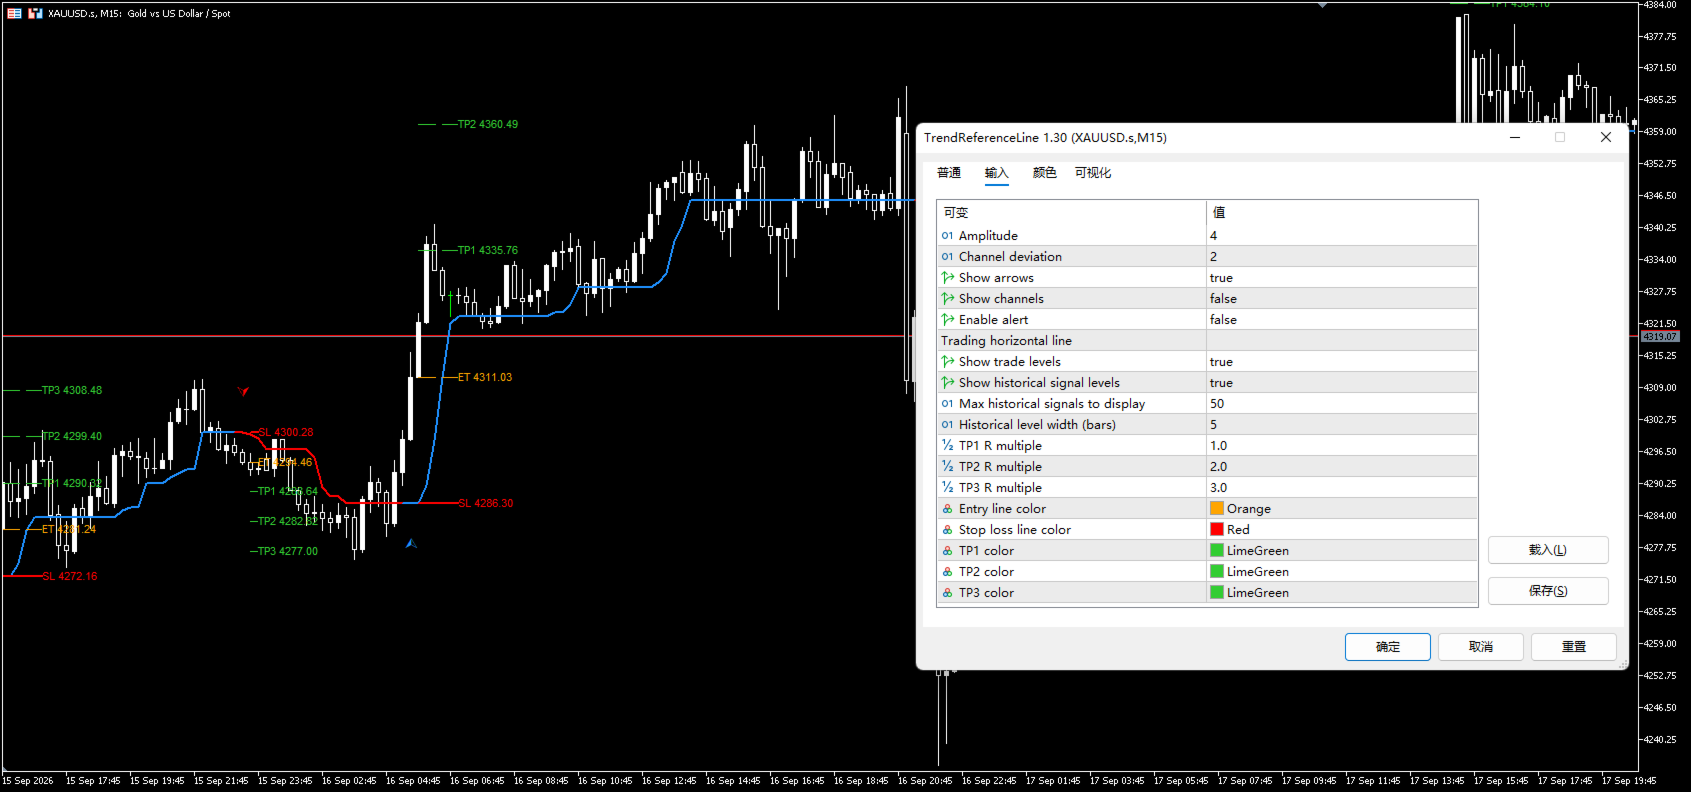
Input Parameters
Main
Parameter | Default | Description |
|---|---|---|
Amplitude | 4 | Look-back amplitude for trend calculation. Lower values are more sensitive and produce more signals; higher values are smoother and slower. |
Channel deviation | 2 | ATR channel width factor, measured in half ATR units. Higher values produce a wider channel. |
Show arrows | true | Display reversal arrows. |
Show channels | false | Display ATR rails and the filled band. Disabled by default. |
Show buy/sell labels | false | Add Buy / Sell text labels next to the arrows. |
Enable alert | false | Pop-up alert on trend reversal. |
Trading horizontal line
Parameter | Default | Description |
|---|---|---|
Show trade levels | true | Draw entry and target levels for the latest signal. |
Show historical signal levels | false | Also draw levels for past signals. |
Max historical signals to display | 30 | Maximum number of historical signals drawn; higher values use more resources. |
Historical level width (bars) | 5 | Width of each historical level, measured in bars. |
TP1 R multiple | 1.0 | First target = entry ± 1R. |
TP2 R multiple | 2.0 | Second target = entry ± 2R. |
TP3 R multiple | 3.0 | Third target = entry ± 3R. |
Colors
Parameter | Default |
|---|---|
Entry line color | Orange |
Stop loss line color | Red |
TP1 / TP2 / TP3 color | LimeGreen |
Tuning guide
- Too many signals / too much noise → increase Amplitude or move to a higher timeframe
- Too few signals / entries too late → decrease Amplitude or move to a lower timeframe
- Stops hit too easily → review the channel factor to gauge volatility, or allow a wider stop reference
- Targets rarely reached → lower TP1 from 1R to 0.5R–0.8R to secure partial profit first
Compatibility and Notes
- Works on any MT5 symbol and timeframe (forex, metals, indices, crypto). Default settings are most stable on M15 and above.
- This indicator provides technical analysis and visual reference only. It does not place orders and does not make trading decisions for the user.
- The stop and target levels are structural reference values derived from the indicator's own logic and do not constitute trading advice of any kind.
- Calculations rely on historical data; use signals after confirmation and in combination with your own risk management rules.
Risk Disclaimer
Trading financial markets involves risk. No technical analysis tool can predict future price movement or guarantee profit. Past signal behavior does not represent future results. Users should make independent decisions based on their own judgment and bear full responsibility for their trading results.