HubDynamicTrendLine
- インディケータ
- バージョン: 1.0

HubDynamicTrendLine
This indicator identifies strict pivot highs and lows based on N bars to the left and right (default 15), connecting consecutive pivots of the same type to build a dynamic channel with upper and lower boundaries.
Key Features
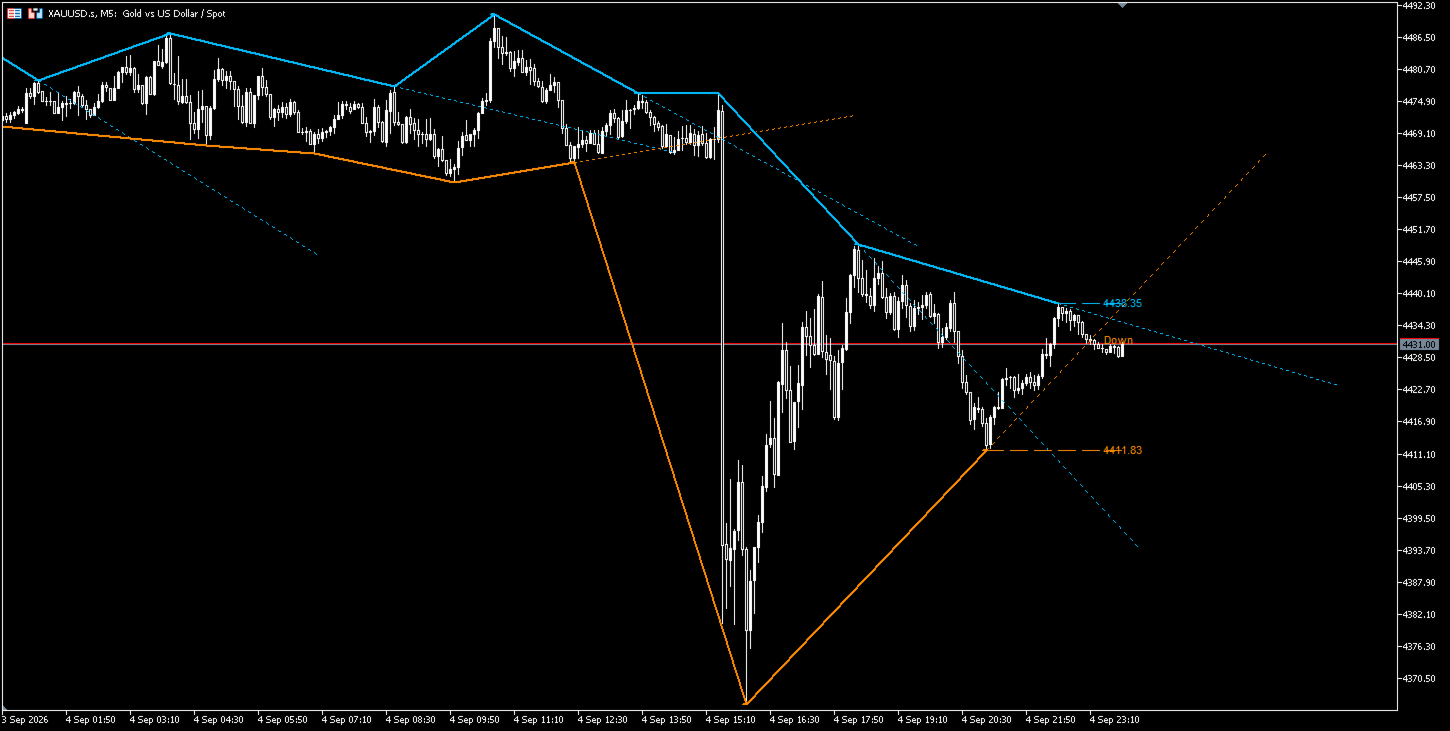
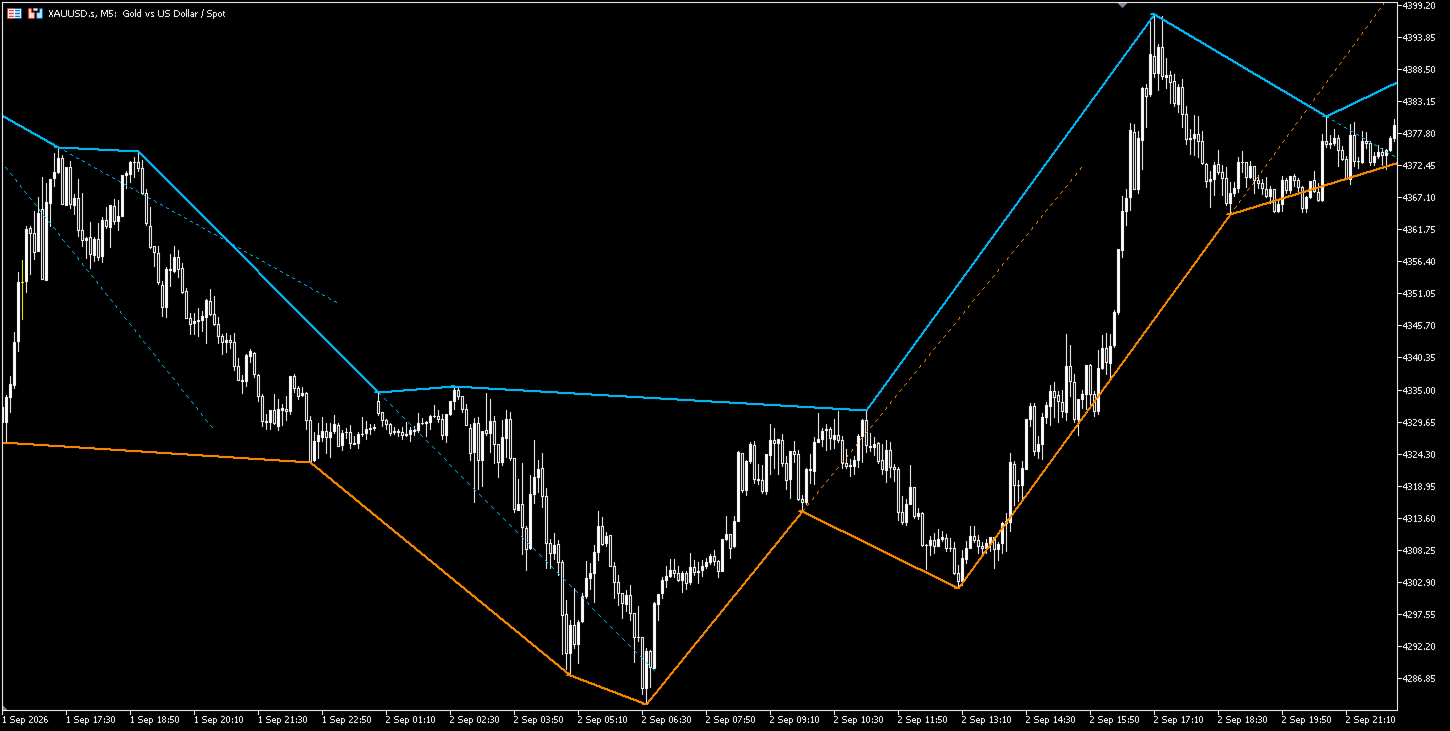
- Pivot Connections: Consecutive pivot highs and pivot lows are connected with solid trend lines, forming a visible channel structure.
- Slope Projection: When the price difference between two consecutive pivots of the same type is at least one 200-period ATR, the slope of that segment is projected forward (default 70 bars) using a dotted line to indicate the potential channel extension.
- Breakout Labels: If the latest close crosses the active projection line, a short "Up" (bullish breakout) or "Down" (bearish breakout) label is printed near the bar.
- Latest Pivot Levels: The most recent pivot high and pivot low are tracked with horizontal dashed lines and price labels, assisting support/resistance identification.
Input Parameters
Parameter | Description | Default |
|---|---|---|
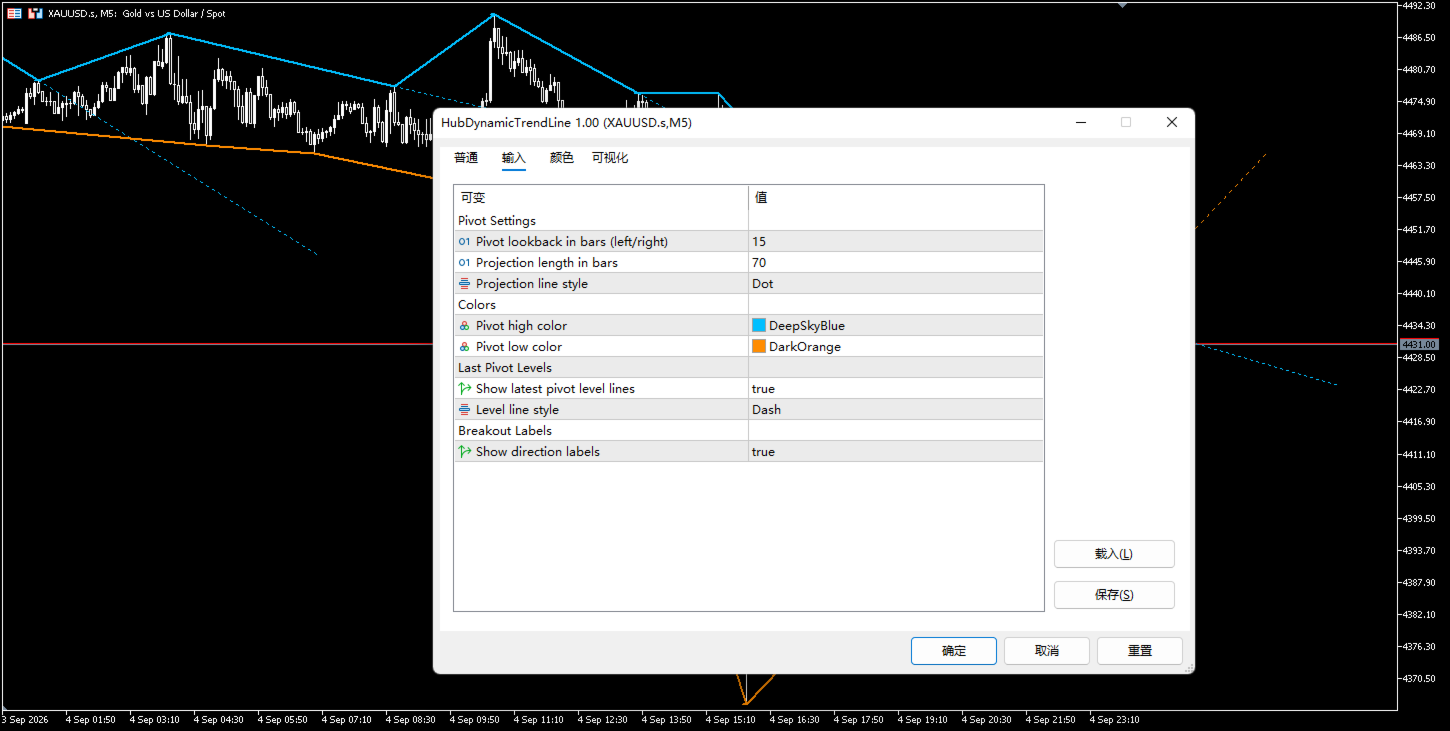
Pivot Length | Bars to the left/right for pivot detection | 15 |
Extend Length | Projection length in bars | 70 |
Ext. Style | Projection line style | Dot |
High Color | Pivot high color | Blue |
Low Color | Pivot low color | Lime |
Show Levels | Show latest pivot level lines | true |
Show Breakout | Show breakout direction labels | true |
Usage
Suitable for technical analysis on any symbol and any timeframe. The pivot channel helps traders identify trend structure, channel boundaries and potential breakouts.
⚠️ Risk Disclosure: This indicator is for technical analysis assistance only. It does not constitute investment advice and does not guarantee any trading outcome. Past performance does not guarantee future results. Users assume full responsibility for all trading decisions.