
CustomRange VolumeProfile
- インディケータ
-
Sompop Jittrakul
 Trader since 2007 and owner of www.ThailandTraderClub.com - www.ThailandTradingSchool.com - www.TradingStat.me
 - バージョン: 1.30
- アップデート済み: 20 9月 2026
- アクティベーション: 20
CustomRange VolumeProfile
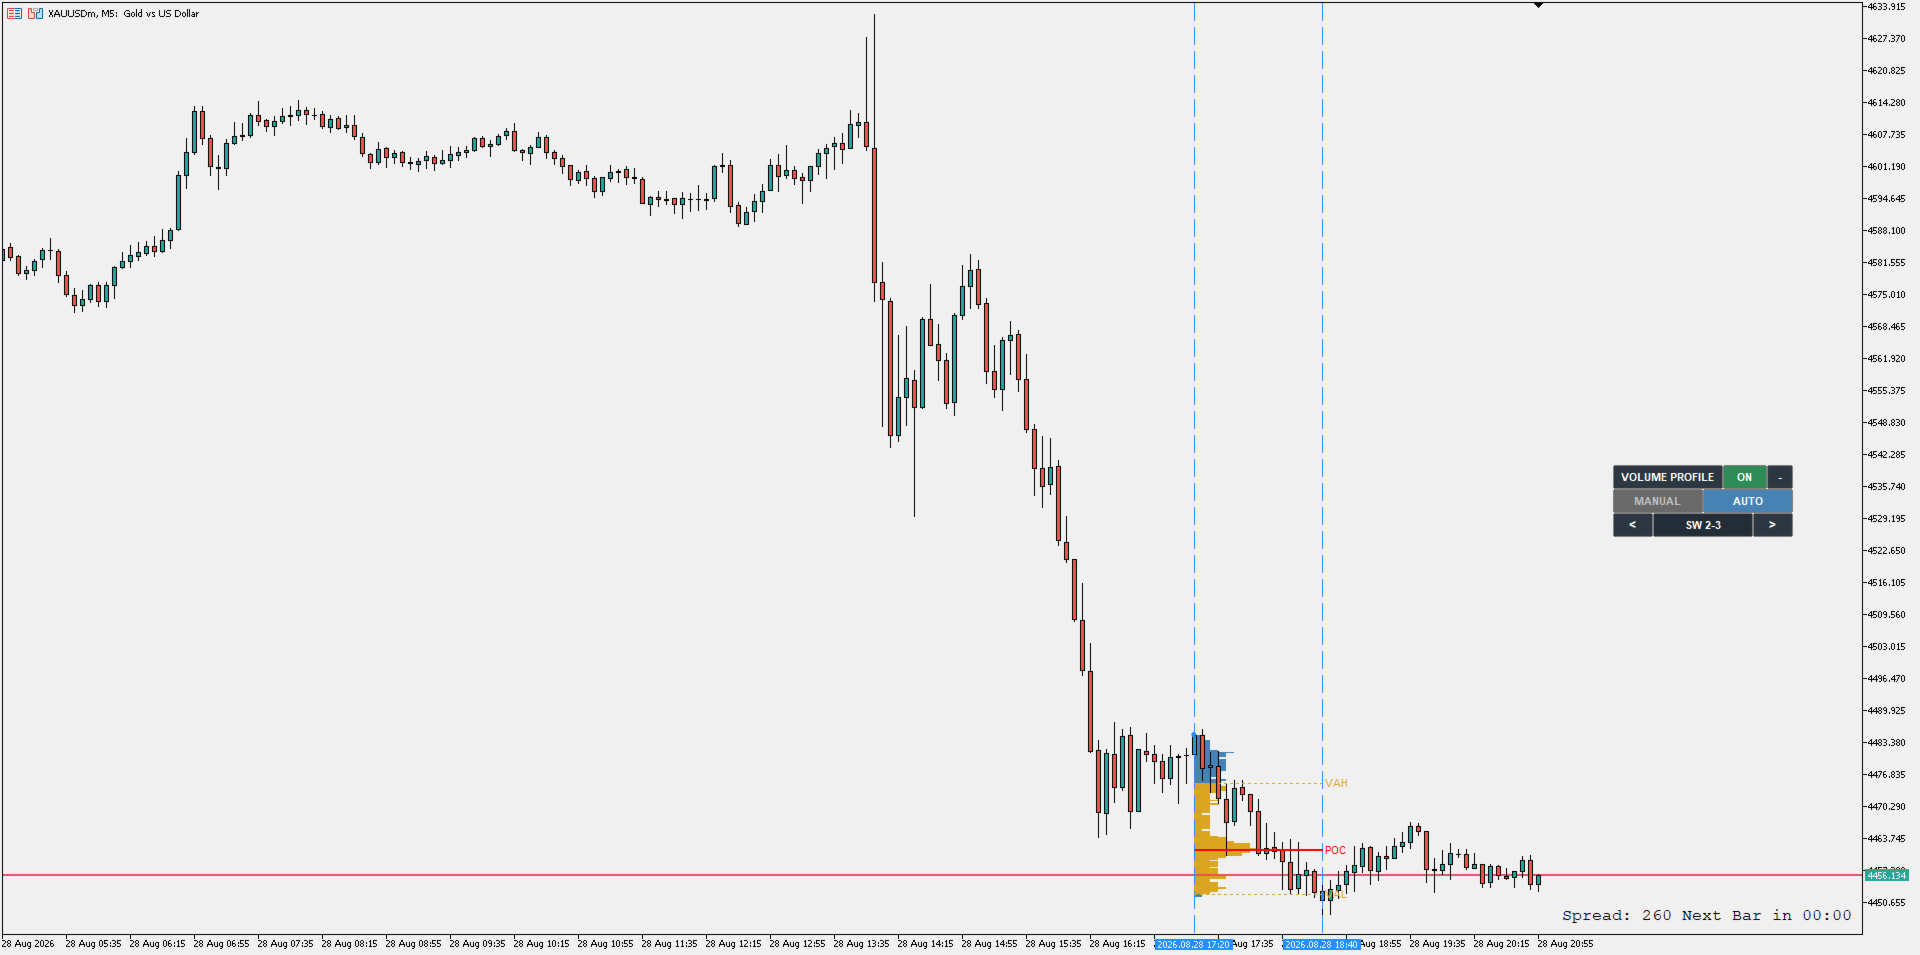
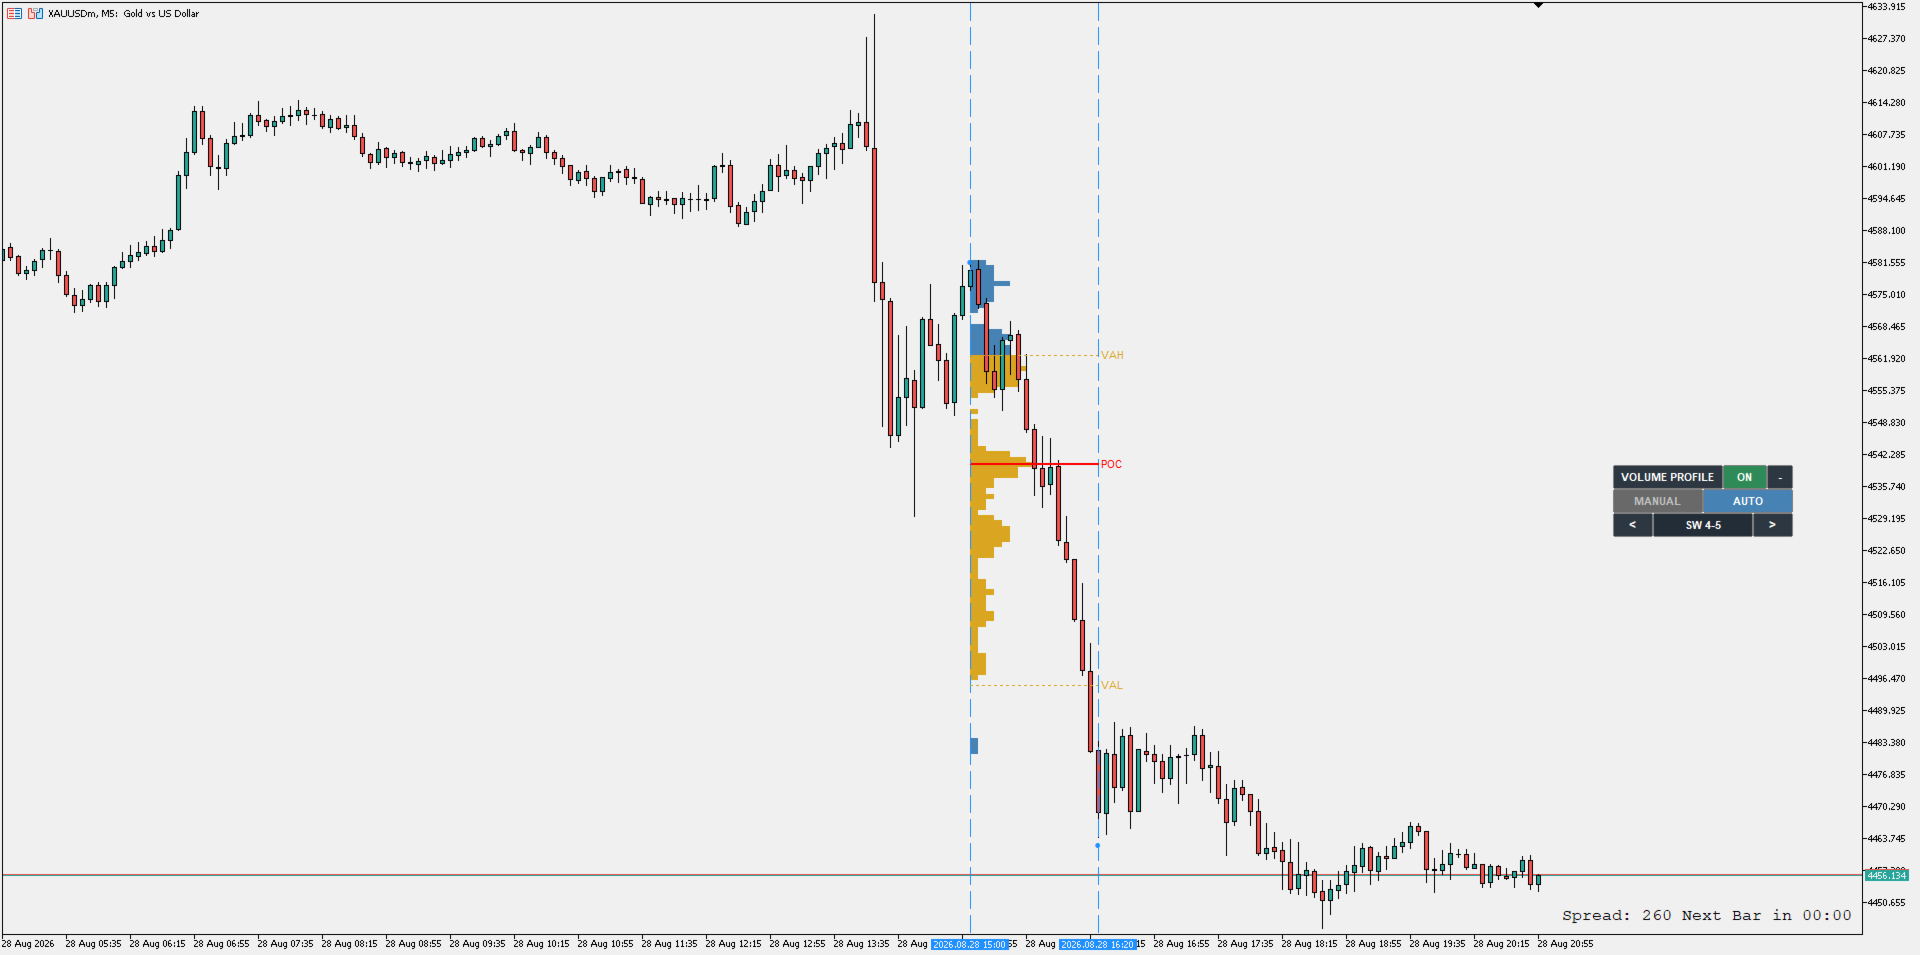
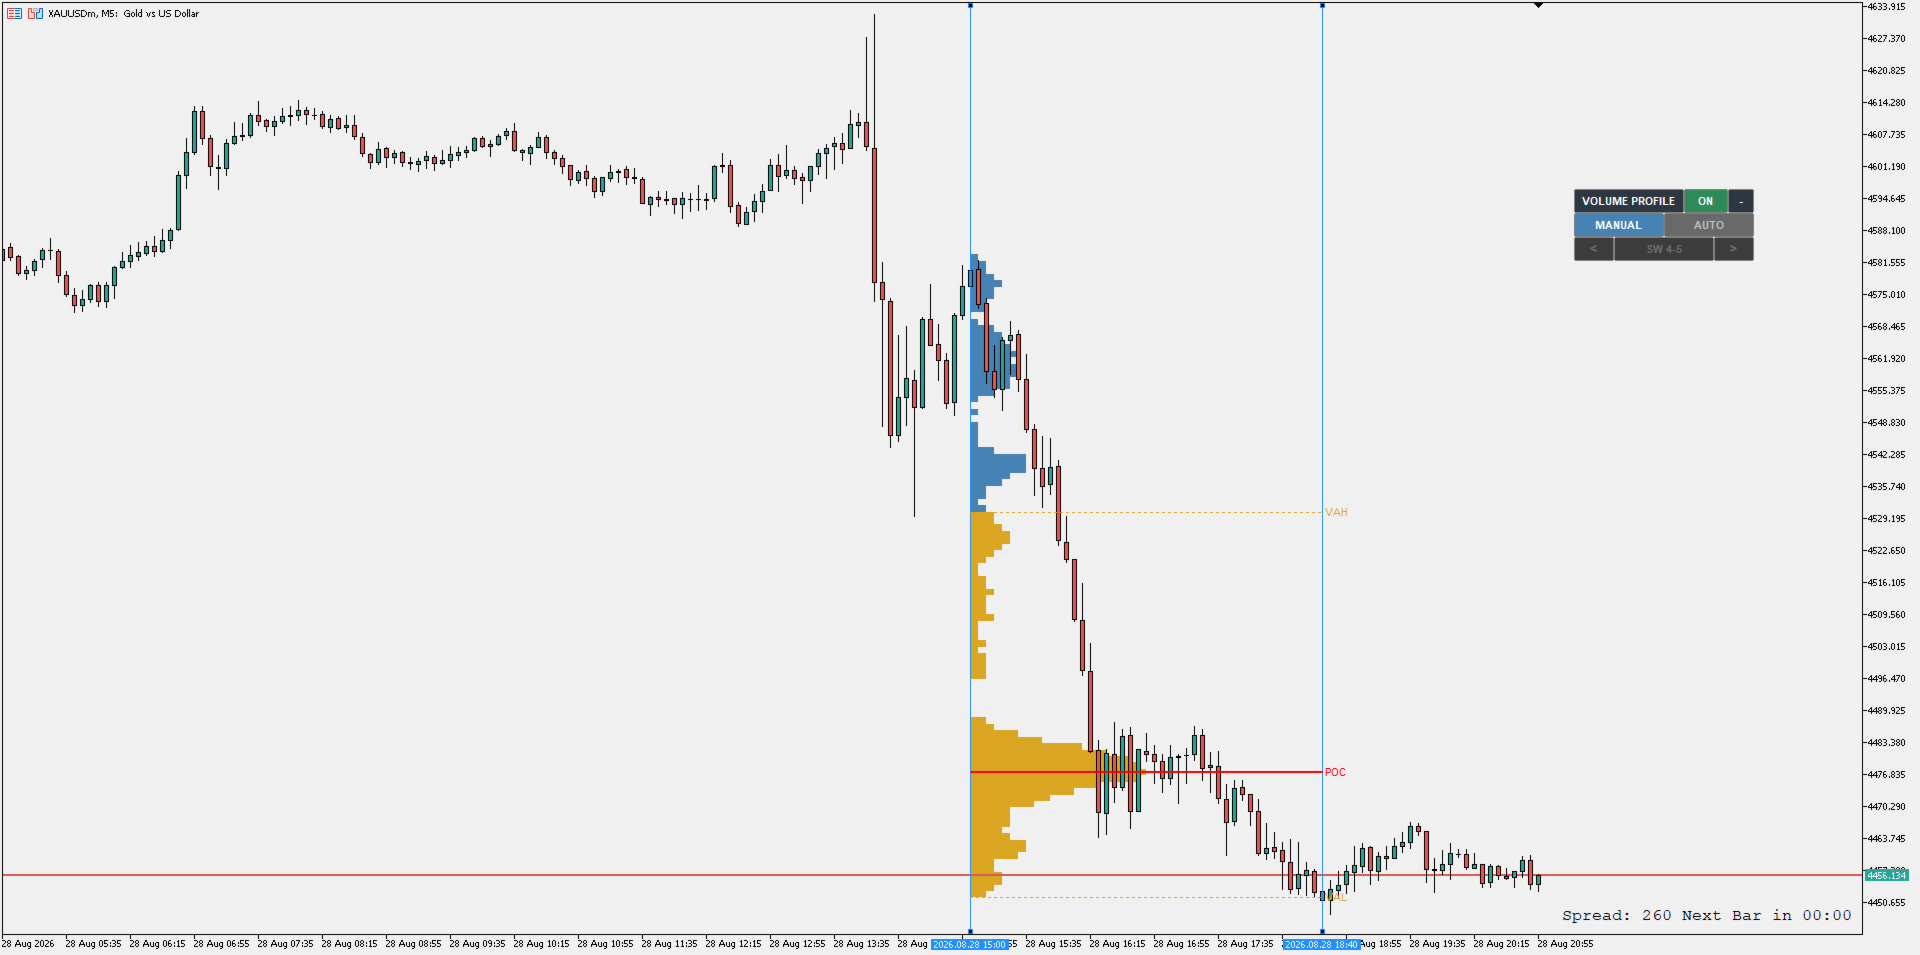
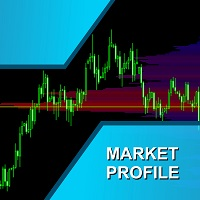
This indicator builds a Volume Profile for any part of the chart you want to study. Instead of resetting per day, you choose the range - either by dragging two vertical lines yourself, or by letting the indicator snap the range to a ZigZag swing leg automatically. It then draws the horizontal volume histogram together with the three key levels: the Point of Control (POC), the Value Area High (VAH) and the Value Area Low (VAL).
Two Ways To Set The Range
- MANUAL - two vertical lines appear on the chart, ready to drag straight away (no need to select them first). The profile recalculates as you move them.
- AUTO - the range locks onto the latest confirmed ZigZag swing leg and follows the market on its own. Use the < > buttons to step back through older swing pairs (0-1, 1-2, 2-3 ...) whenever the newest leg is not the one you want to measure.
Key Features
- Compact control panel on the chart: ON / OFF, MANUAL / AUTO switch and the swing selector.
- Collapse / expand button shrinks the panel down to a single bar so it never covers your chart.
- The panel can be dragged anywhere by its header.
- POC, VAH and VAL plotted and labelled for the selected range.
- The two swing points currently in use can be marked on the chart.
- Standard MT5 ZigZag parameters - Depth, Deviation, Back Step - so the swing detection behaves exactly the way you are used to.
- Mode, selected swing pair, panel position and collapsed state are all kept when you switch timeframe or symbol.
- Adjustable Value Area percentage, resolution, profile width and full colour control.
- Choose the timeframe used to build the volume, independent of your chart timeframe.
- Works on any symbol and any timeframe.
How It Works
Once the range is set - by hand in MANUAL mode, or by the swing detection in AUTO mode - the indicator reads price and volume from the calculation timeframe you select, distributes each bar's volume across the price range it covered, and stacks the result into horizontal bins between the two range lines. The bin with the highest volume becomes the POC. Bins are then added around the POC until the chosen Value Area percentage of total volume is reached, which defines the VAH and VAL boundaries.
In AUTO mode the swing points are taken from the classic ZigZag algorithm. Only confirmed swing points are used, so the range does not jump around while the newest leg is still forming.
Input Parameters
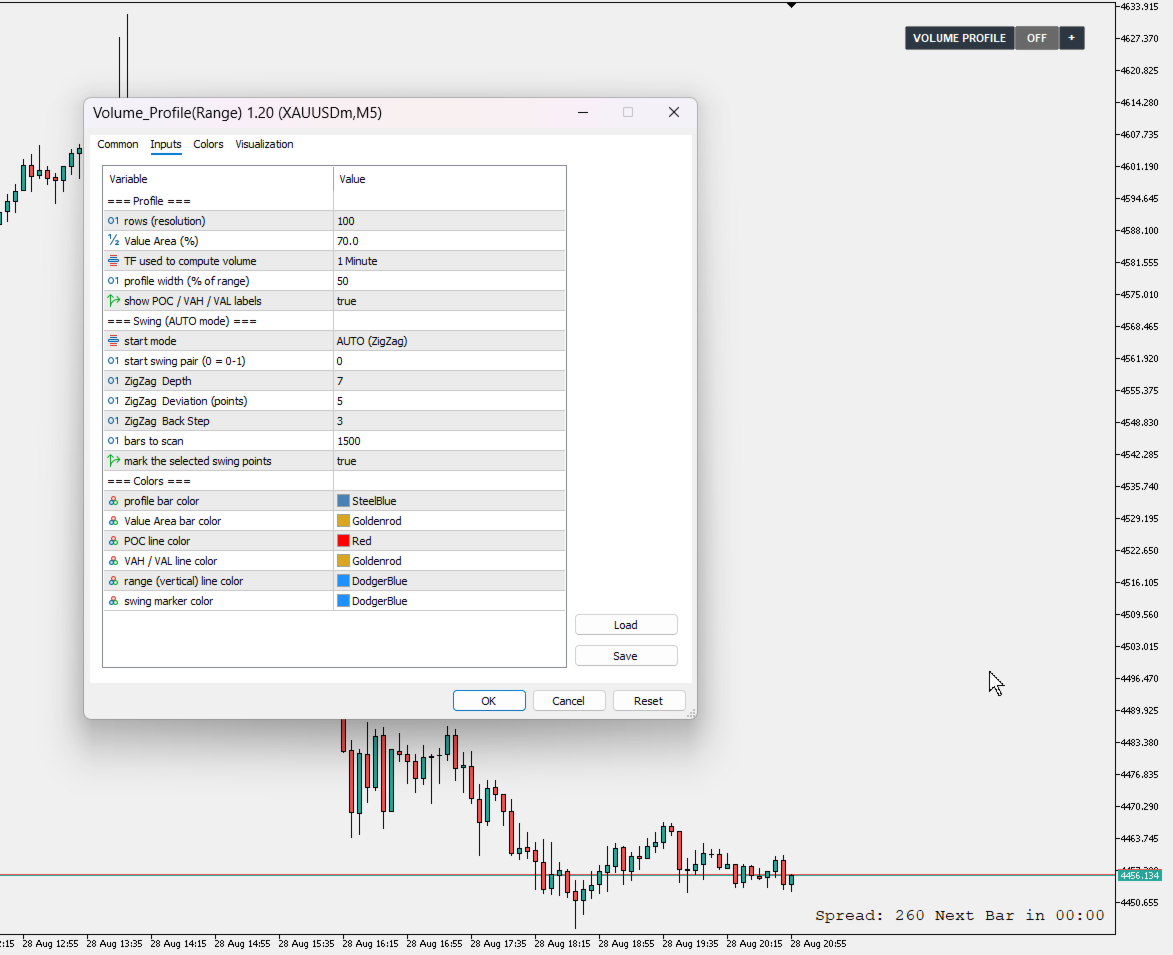
Profile
- rows (resolution) - number of price bins; higher = finer detail.
- Value Area (%) - share of total volume included in the Value Area.
- TF used to compute volume - timeframe used to build the profile.
- profile width (% of range) - horizontal length of the histogram relative to the distance between the two lines.
- show POC / VAH / VAL labels - show or hide the level labels.
Swing (AUTO mode)
- start mode - which mode the indicator starts in, MANUAL or AUTO.
- start swing pair - which swing pair is selected at start (0 = the latest leg).
- ZigZag Depth / Deviation / Back Step - standard ZigZag swing detection settings.
- bars to scan - how far back the swing detection looks.
- mark the selected swing points - show or hide the two swing markers.
Colors
- profile bar color - colour of bars outside the Value Area.
- Value Area bar color - colour of bars inside the Value Area.
- POC line color - colour of the Point of Control line.
- VAH / VAL line color - colour of the Value Area boundary lines.
- range (vertical) line color - colour of the two range lines.
- swing marker color - colour of the two swing point markers.
Notes
This is a visual analysis tool. It does not send trading signals and does not open orders.



































ユーザーは評価に対して何もコメントを残しませんでした