Institutional Framework Trading System MT5

概要

Institutional Framework Trading System MT5 は、Smart Money Concepts(SMC)による価格構造、オプション・ポジショニングデータ(XAUUSD専用)、およびマクロ経済レジームスコアリングを基盤とした、金融商品向けの多層コンフルエンス・インジケーターです。

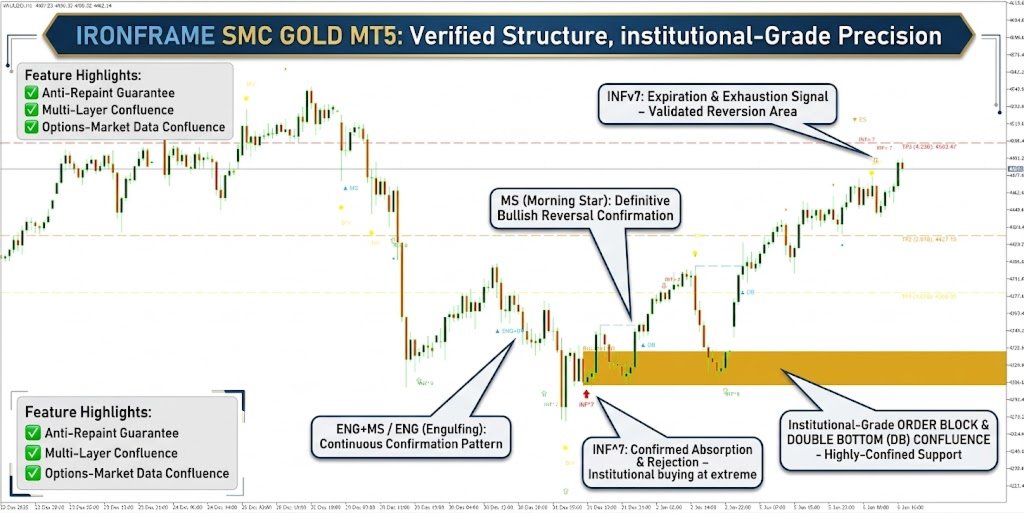
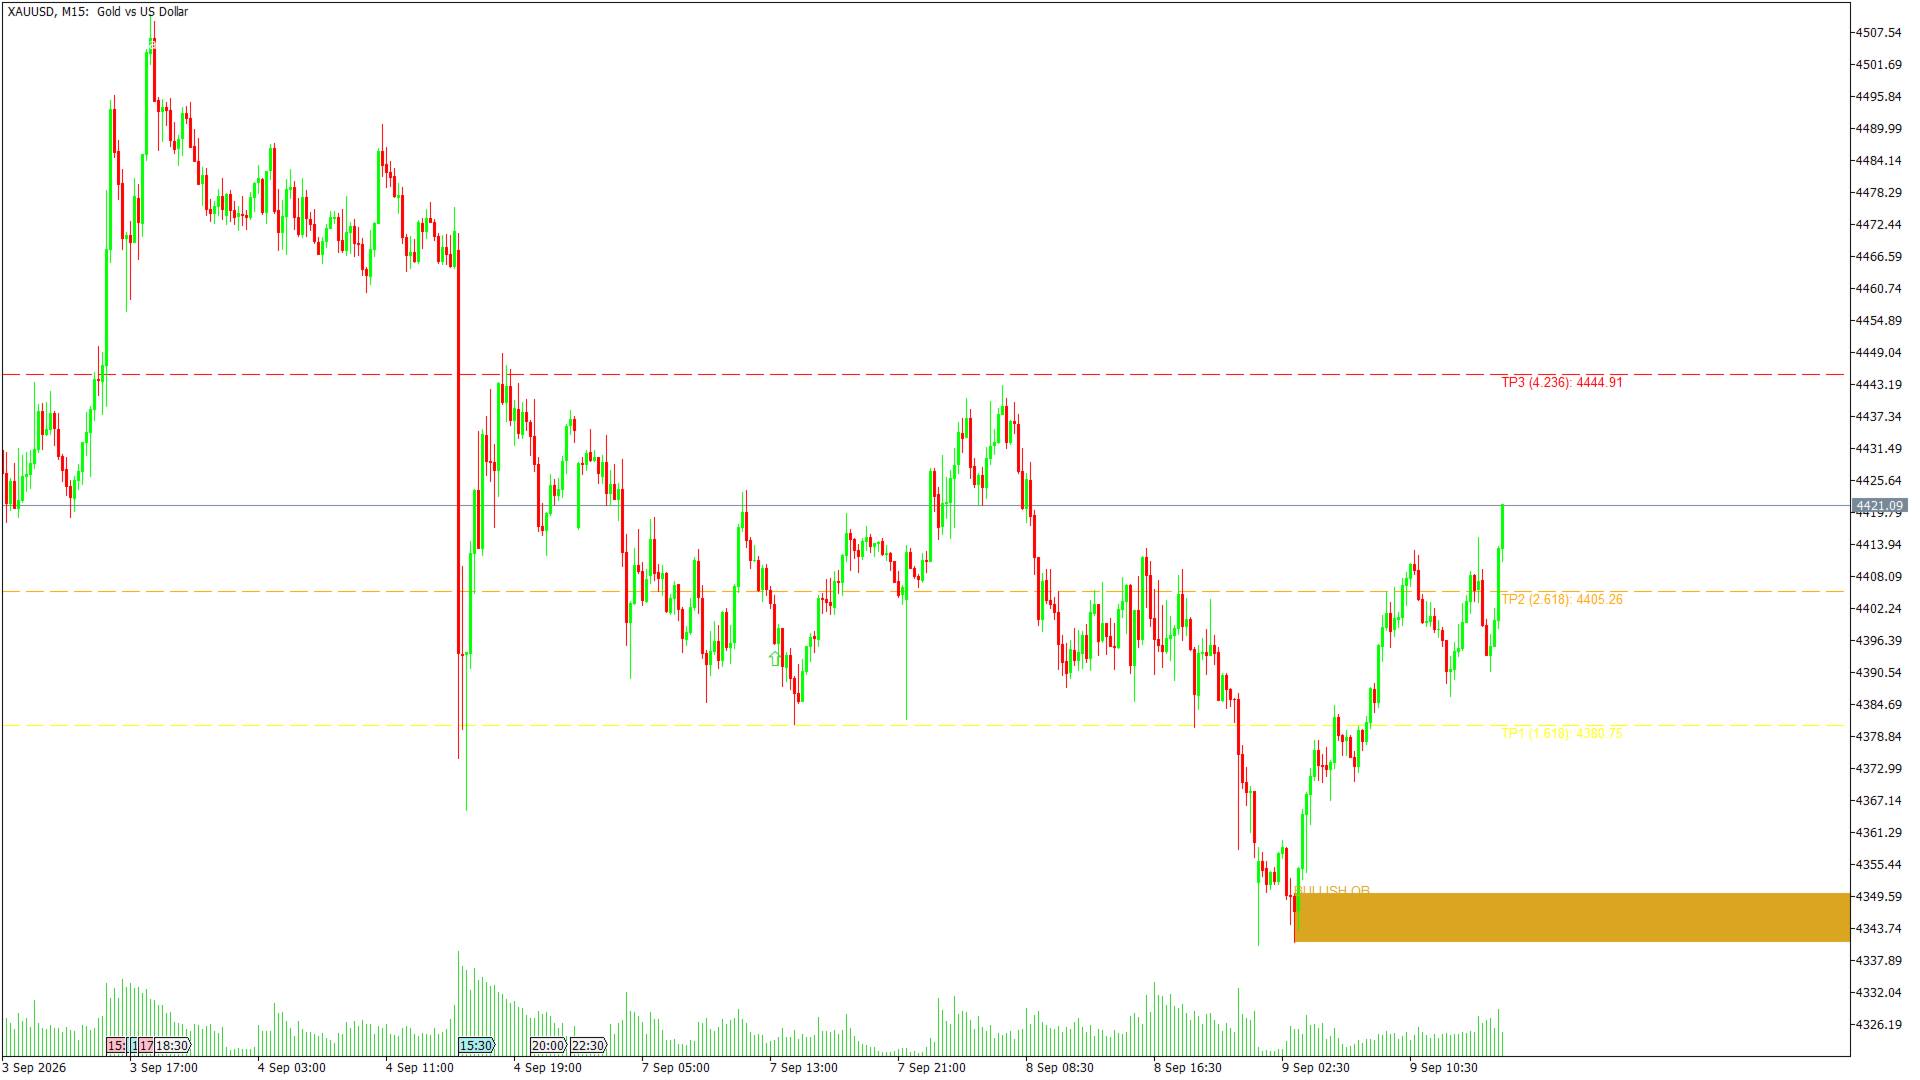
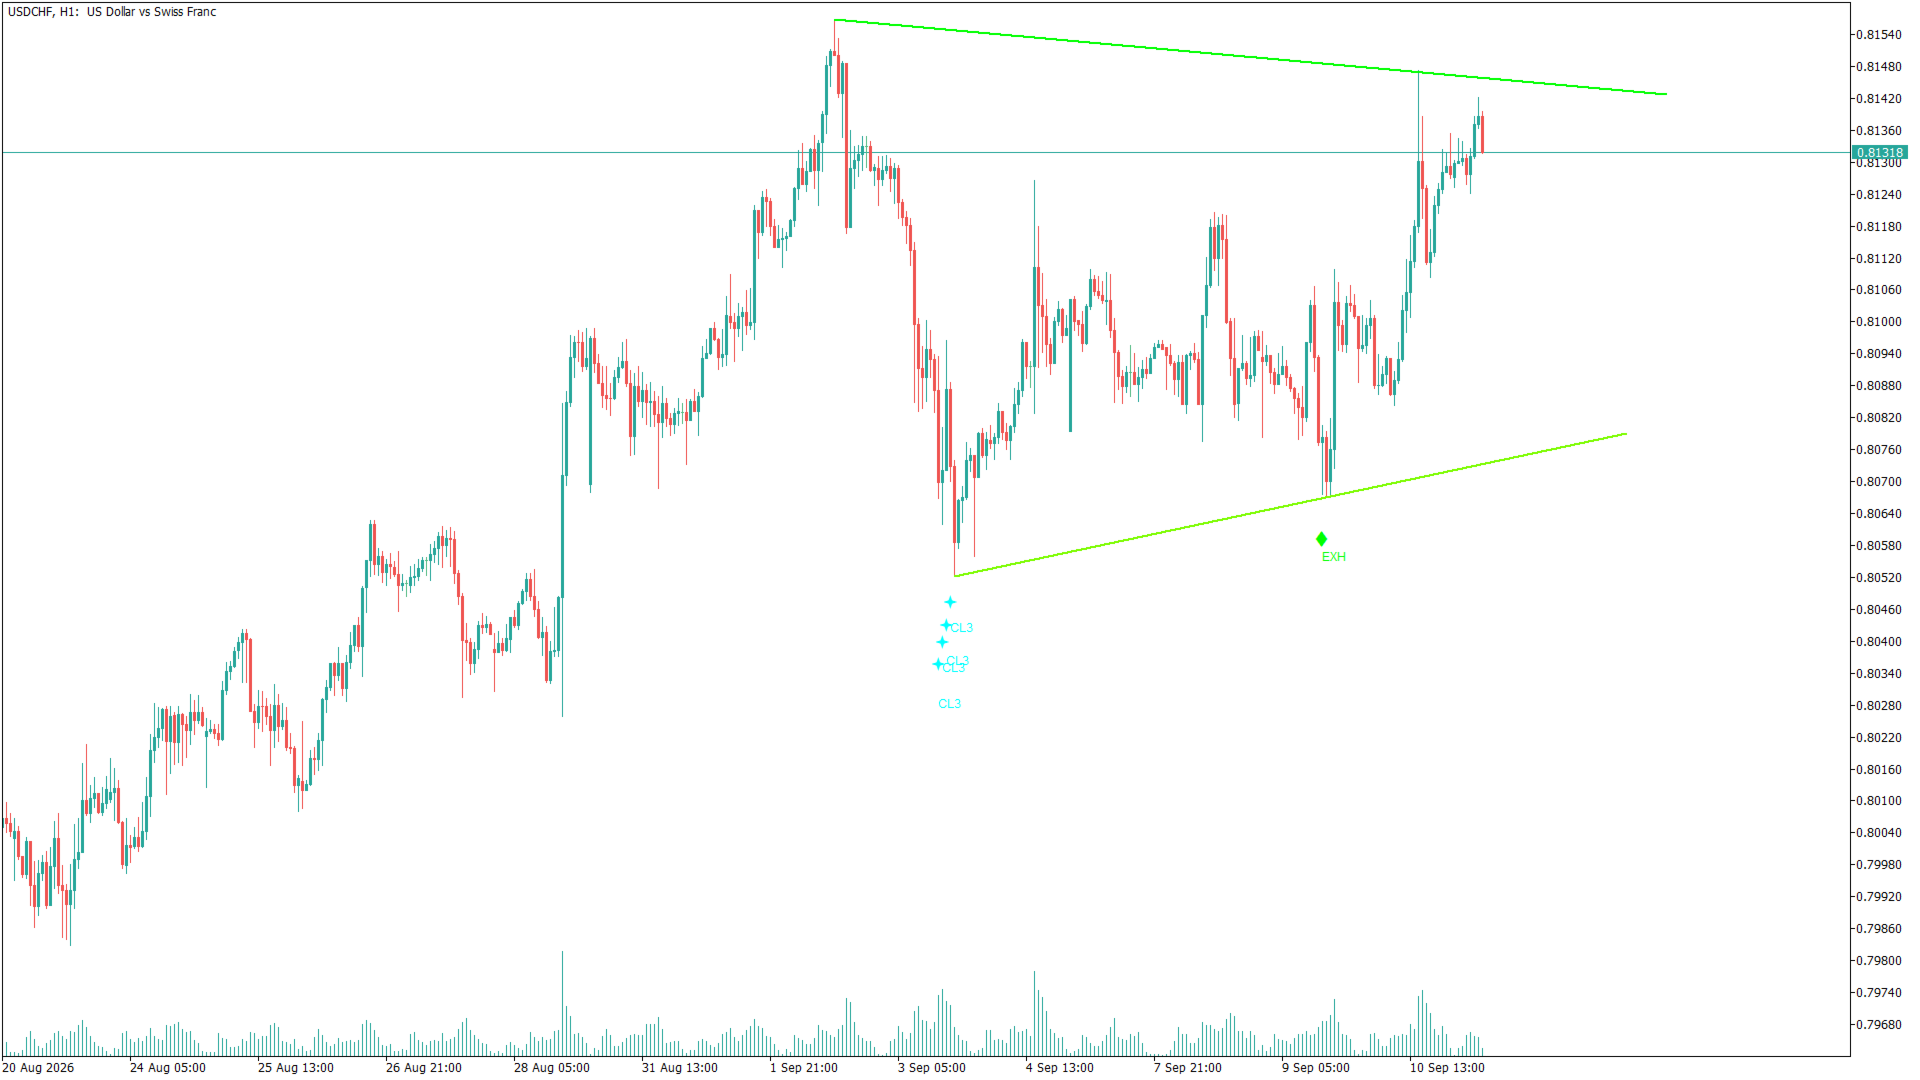
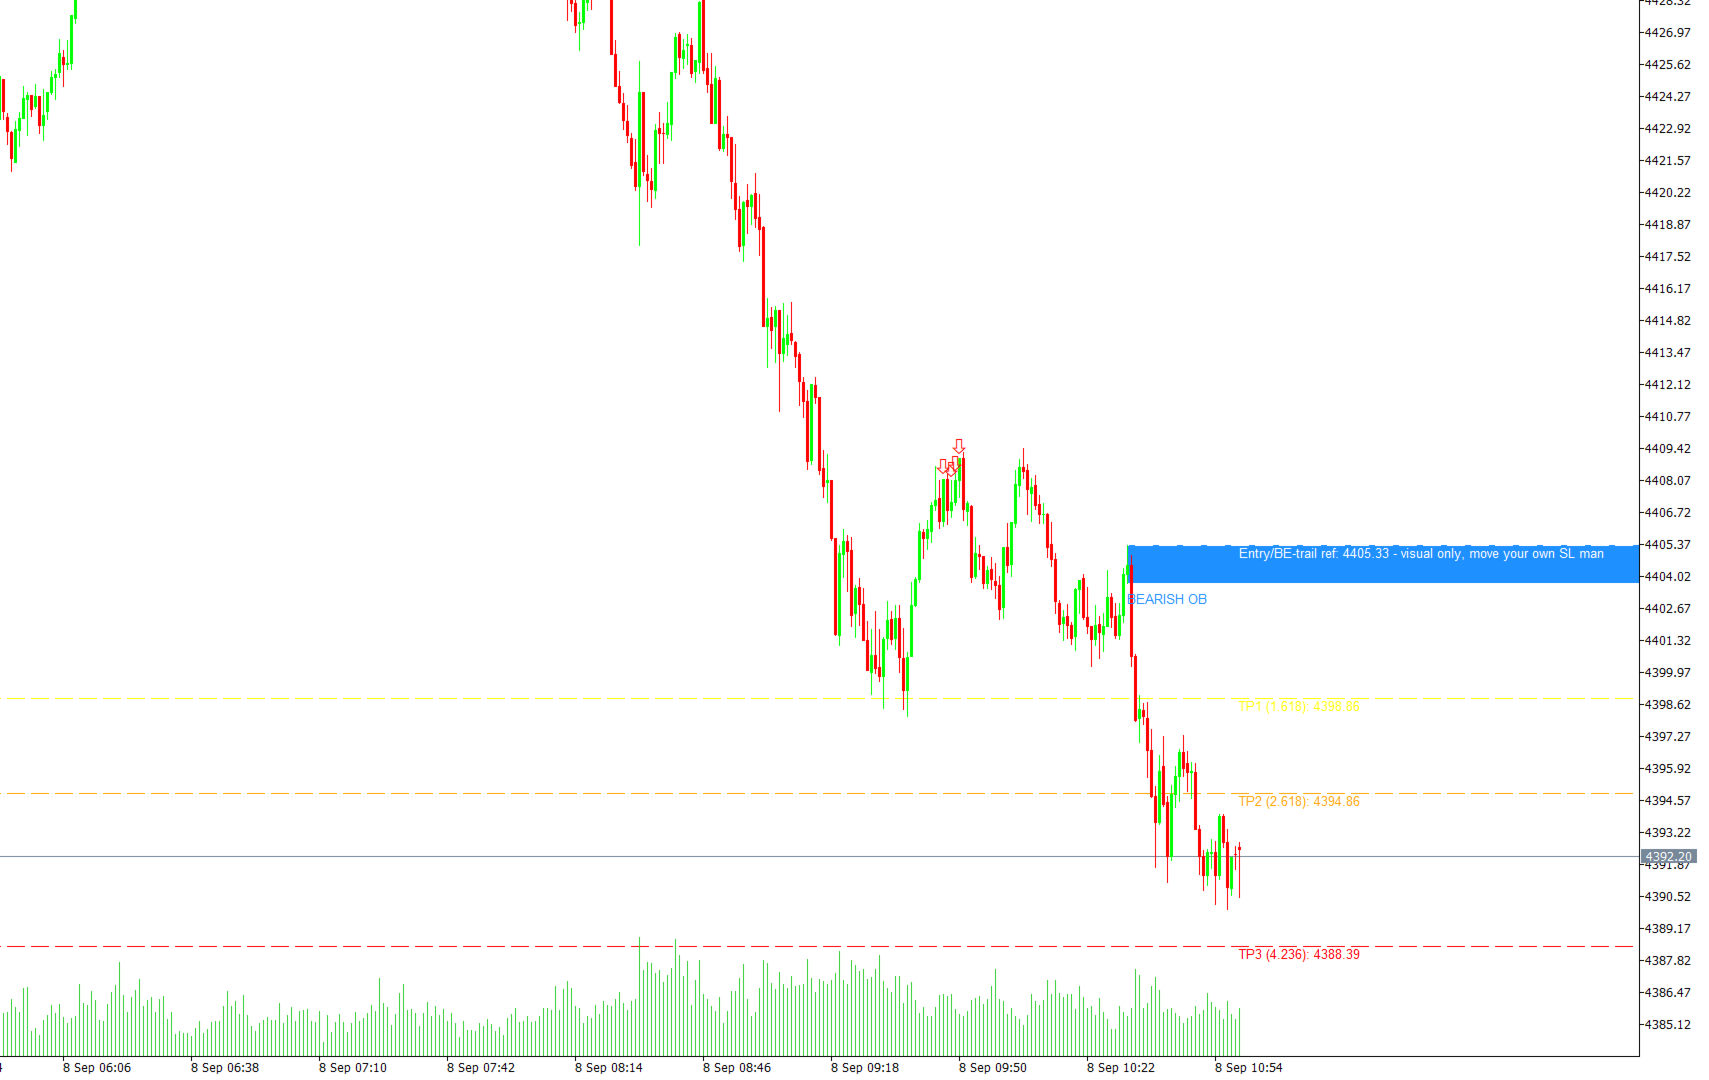
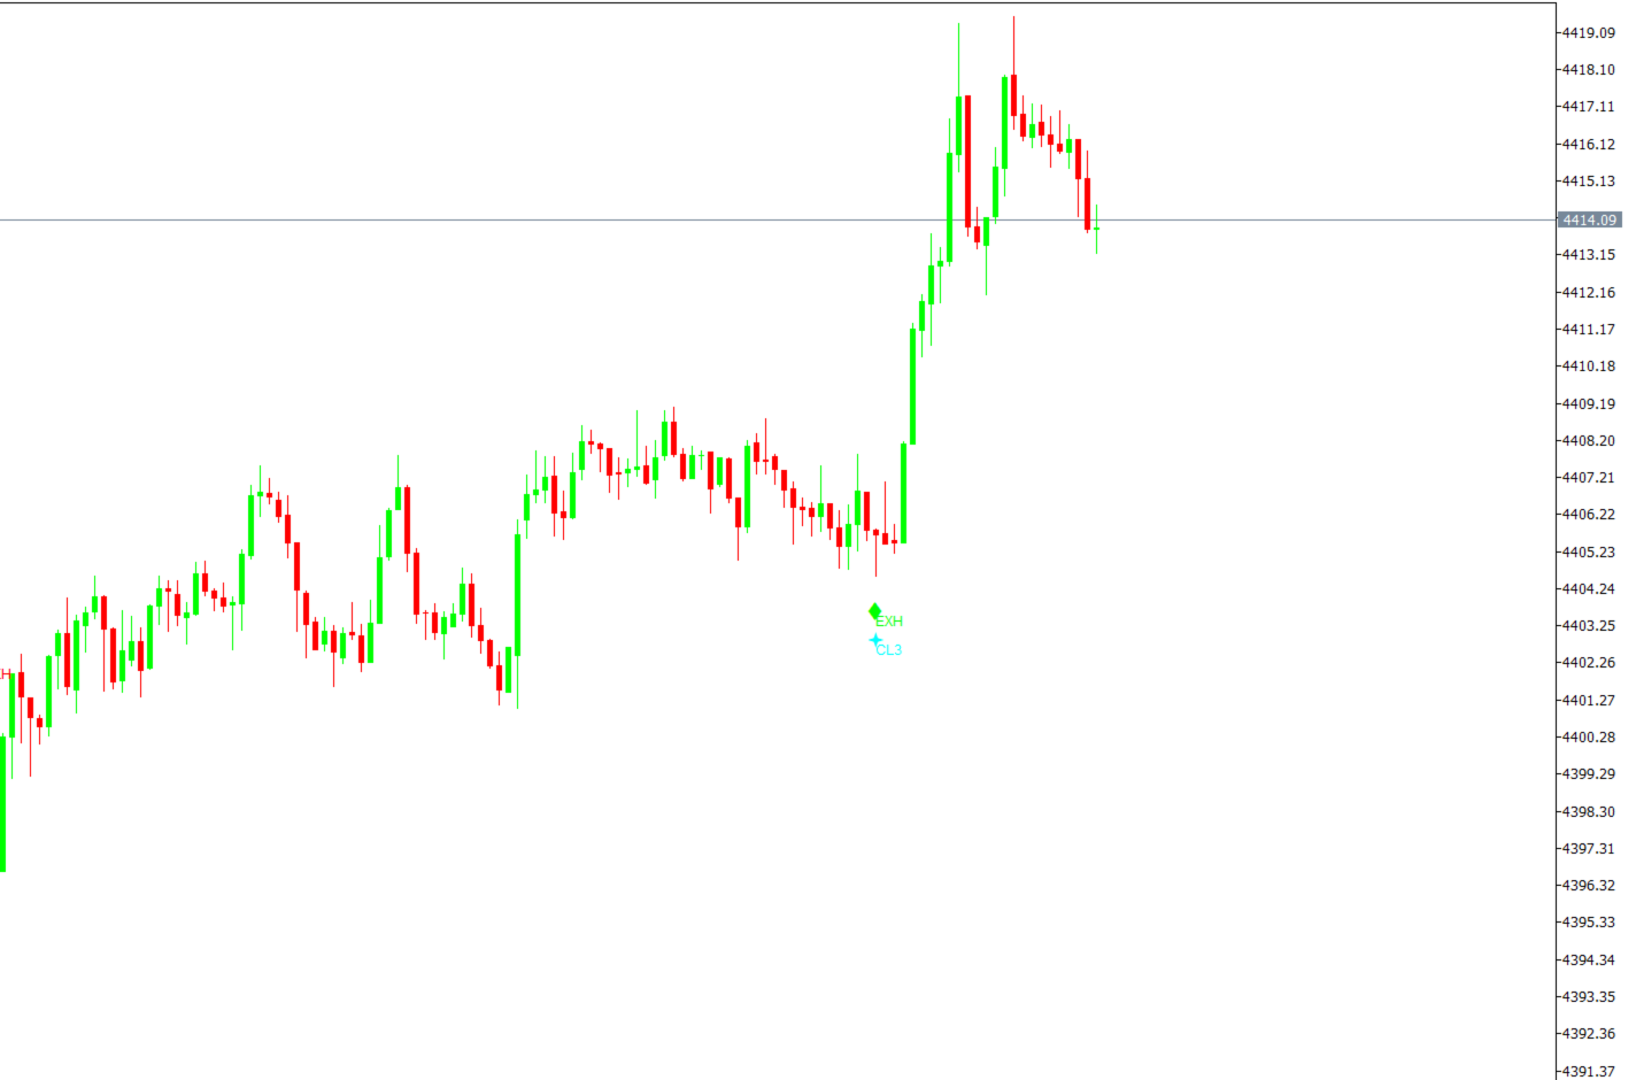
リペイントしない買い・売りシグナルを、ローソク足が完全に確定した後にのみ表示します。また、検出した構造 — オーダーブロック、需給ゾーン、流動性スイープ、エグゾースション、アブソープション、Deltaダイバージェンス — をチャート上に直接描画するため、各シグナルが生成された根拠を可視化できます。ロジックがブラックボックスの中に隠されることはありません。

本インジケーターは、注文の発注、リスク管理、ポジションサイズの計算を行いません。ユーザー自身のトレード管理と併用することを前提とした、シグナルおよび分析レイヤーです。

シグナル検出

2つの独立した検出レイヤーが連携して機能します。

  • 構造:強気・弱気のオーダーブロック、需給ゾーン、過去のスイング高値/安値に対する流動性スイープ、および現在のアクティブ・トレーディングレンジ内におけるプレミアム/ディスカウント/エクイリブリアムゾーン。

  • 確認:エグゾースション・ローソク足(長いヒゲ、ブレイクされたスイングに対して逆方向の小さな実体)、アブソープション(重要なレベル付近の狭いレンジ内で拒否された高出来高)、およびスイングポイントにおけるDeltaまたは出来高ダイバージェンス。ノイズによる偽シグナルを減らすため、最小スイングサイズフィルター(ATRスケーリング)も使用します。

2つのシグナルモード

  • Conservative:オーダーブロック、流動性スイープ、ダイバージェンスを要求します(各条件は個別に有効/無効化可能)。これらをスコアリングし、最小コンフルエンス閾値によってシグナルをフィルタリングします。このモードでは、ファンダメンタル/センチメント・レジーム(下記参照)と逆方向のシグナルをブロックできます。

  • Rangebound:構造(オーダーブロックまたは需給ゾーン)に加えて、少なくとも1つの確認要素を要求します。このモードでは、レジームスコアに関係なく、買い・売りの両方向が有効です。

さらに、上位時間足の方向性チェック、取引セッションウィンドウ、シグナル・クールダウン、オーダーブロックの最大経過時間などの追加フィルターが両モードに適用され、それぞれ個別に設定できます。

オプション・ポジショニングレイヤー

Max Pain、サポート/レジスタンス、Battle Zones、およびGammaベースのレベルを、オプションのOpen Interest(建玉)と出来高から算出します。

2種類のデータソースに対応しています。

  • ユーザーが用意するCSVファイル。実際の金(Gold)オプション・チェーンデータに加えて、週間ストライクを手動入力できます。

  • オプションのリアルタイムAPIモード。第三者のGamma Exposureプロバイダーからデータを取得します。ただし、そのプロバイダーの無料プランでは金先物オプションの直接データを利用できないため、このモードでは実際の金オプションデータの代わりに、金鉱株の相関銘柄をセンチメントのプロキシとして使用します。

この制限は、該当モードが有効な場合、インジケーター自身のチャート上のパネルに明確に表示されます。また、このモードで算出されたレベルは金チャート上には描画されず、実際の金価格に基づくレベルのみが表示されます。

マクロ経済レジーム・スコアリング

0~100の独立した2つの複合スコア — ファンダメンタルスコアとセンチメントスコア — をシグナルロジックに組み込むことができます。

  • 自動コンポーネント:CFTC Commitment of Traders(COT)ポジショニング、Gold Fear & Greed、Federal Reserveバランスシート、CPI、PPI、失業率。それぞれ設定可能な更新間隔で公開データソースから取得します。

  • 手動コンポーネント:信頼できる無料の公開データフィードが存在しない一部のデータ(Fedの政策スタンス、利下げ確率、NFP/ADPの実績値と予想値、地政学的緊張度、Bank Participation Reportの数値)は、ユーザーが直接入力します。

両方の複合スコアは無効化し、単一の固定値入力に置き換えることもできます。また、別のExpert AdvisorからGlobalVariablesを介して値を供給することも可能です。

可視化

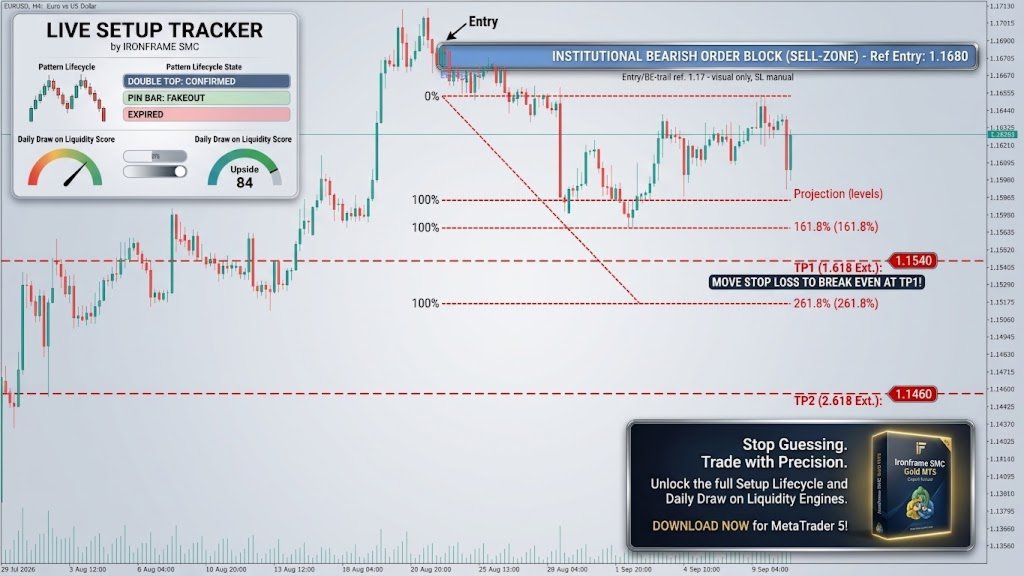
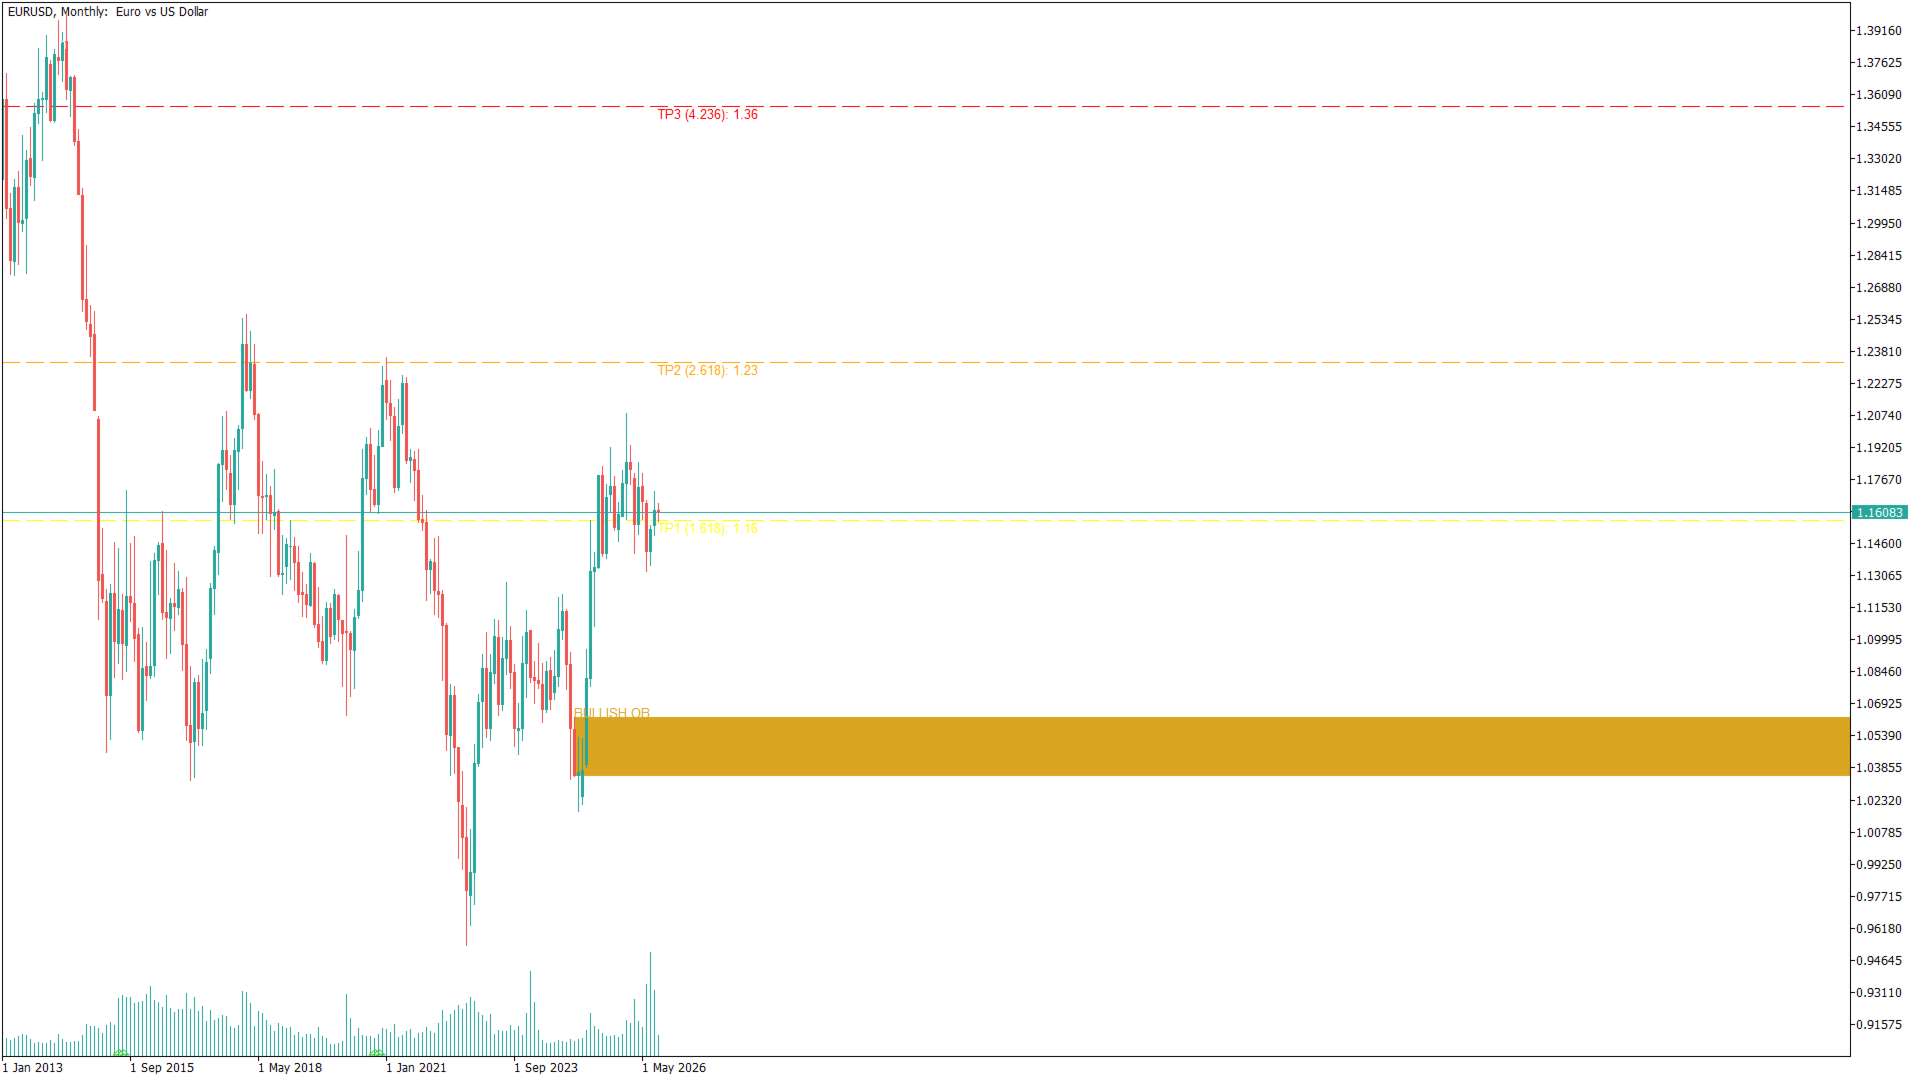
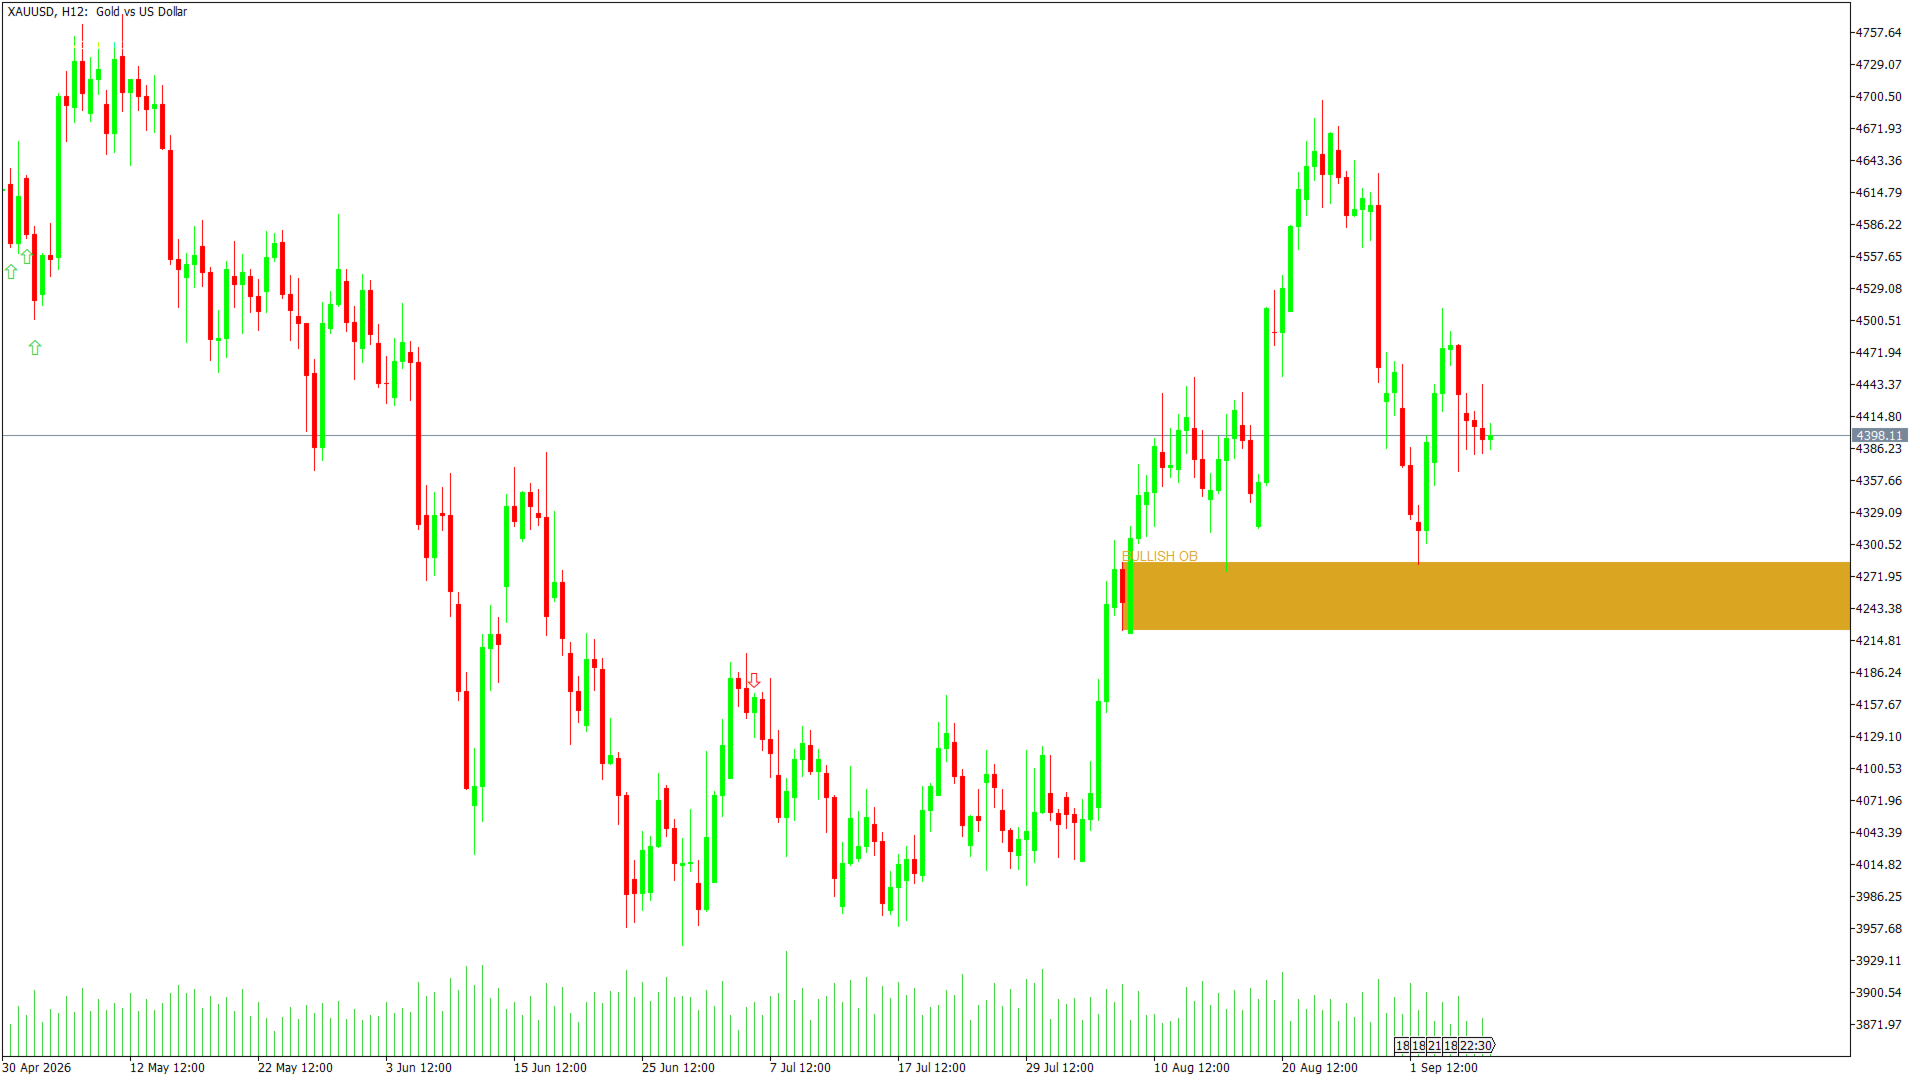
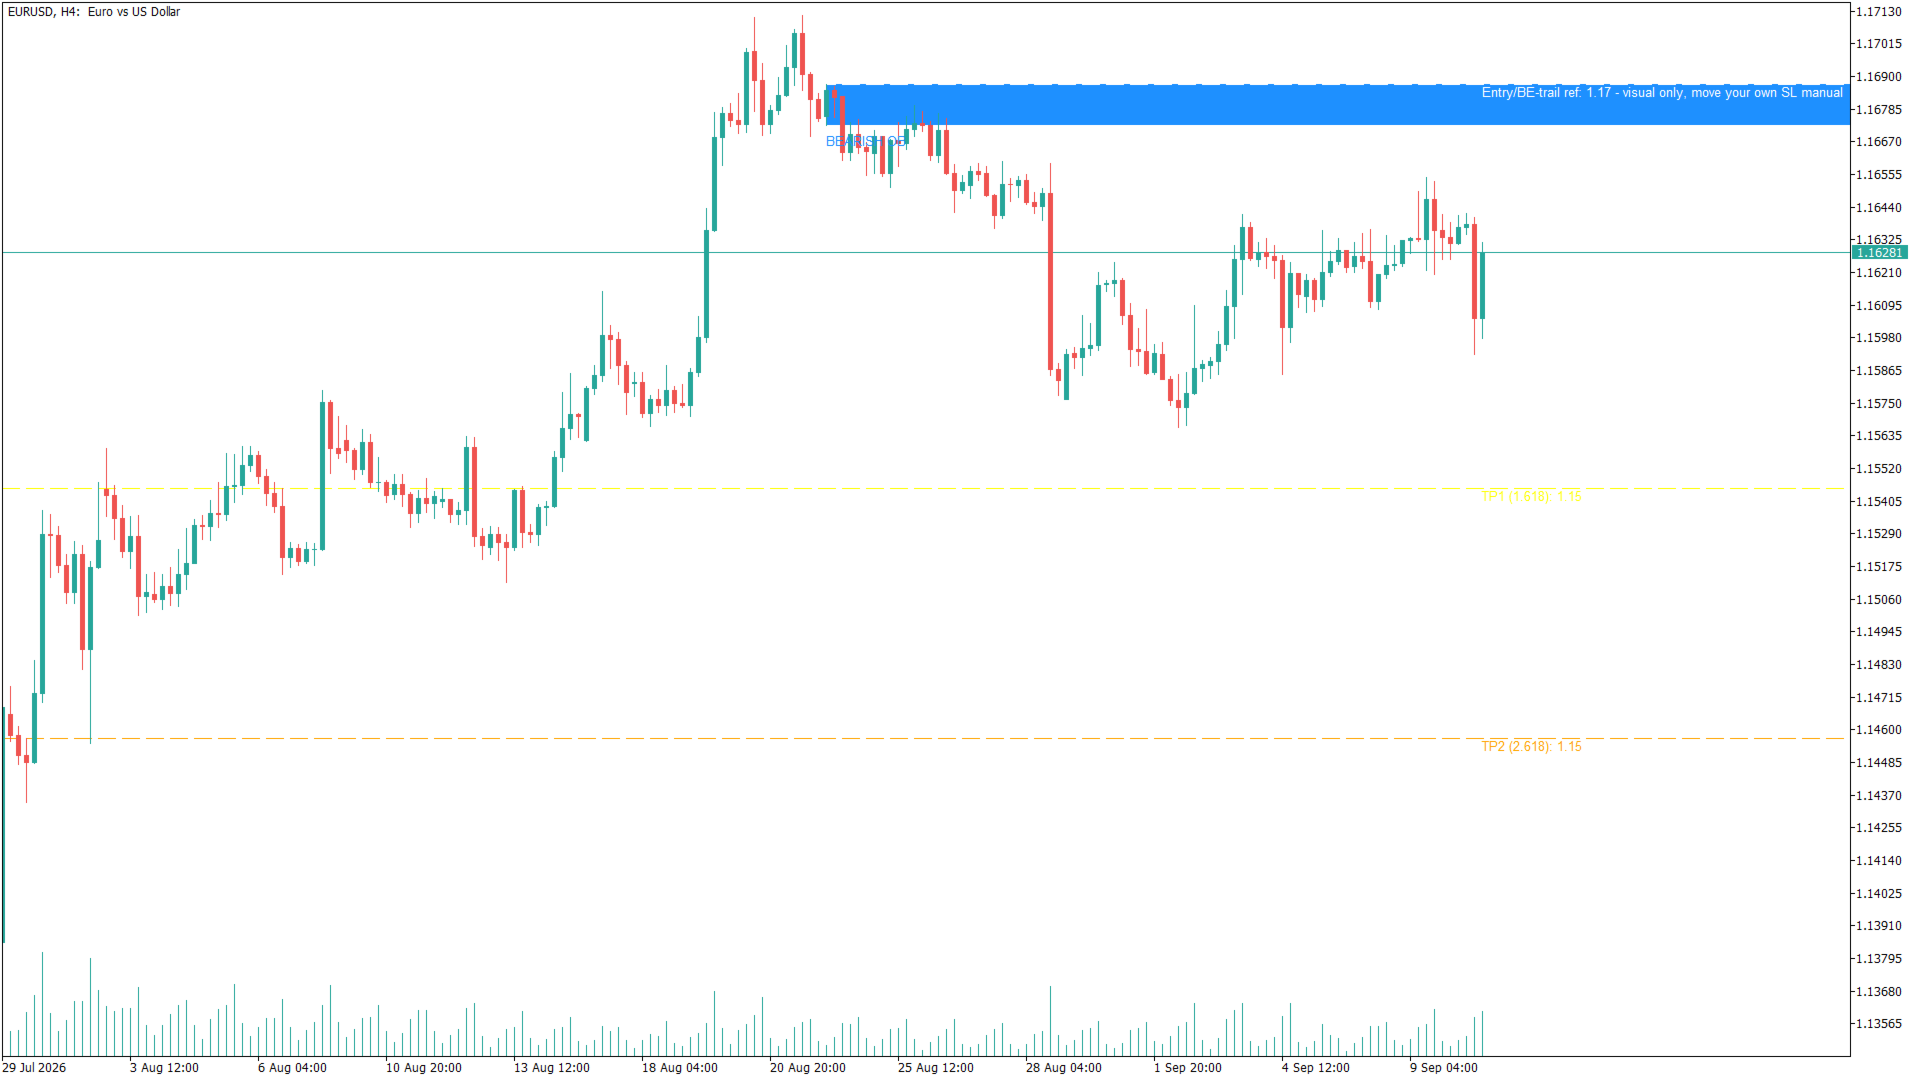
オーダーブロック、需給ゾーン、アクティブ・トレーディングレンジ、エグゾースション/アブソープション/ダイバージェンスのマーカー、クラスター・コンフルエンス・マーカー、Fibonacciエクステンションの参照ライン(視覚的な参考情報のみであることを明確に表示)をチャートオブジェクトとして描画します。

各要素は個別に表示/非表示を切り替えることができます。

アラート

新しいシグナルが発生するたびに、ポップアップアラートおよびモバイルプッシュ通知を送信します。

既存のチャート履歴にインジケーターを追加した際に過去のシグナルが大量に通知されることを防ぐため、履歴バックフィルに対するアラートはデフォルトで抑制されています。

必要条件

自動ファンダメンタル/センチメント機能およびリアルタイムオプションデータ機能を使用するには、ターミナルのExpert Advisors設定で指定された外部ホストに対するWebRequestを有効にする必要があります。また、データソースの1つについて無料のAPIキーが必要です。

詳細は、インジケーター自身の入力パラメータのツールチップおよびチャート上のログ出力に記載されています。

ネットワークアクセスを許可したくない場合は、すべての自動データ機能を無効にして、手動入力へ切り替えることもできます。

入力パラメータ

Signal Mode

  • SignalMode — Conservative または RangeBound(上記参照)。

Regime Inputs (fallback)

  • FundamentalScore — 固定ファンダメンタルスコア(0~100)。自動取得が無効で、GlobalVariableによる上書きが設定されていない場合のみ使用されます。

  • SentimentScore — センチメントスコアについても同様です。

Auto Fundamentals & Sentiment

  • UseAutoFundamentals — ファンダメンタルスコアを自動計算します。

  • UseAutoSentiment — センチメントスコアを自動計算します。

  • FRED_API_Key — Federal Reserveバランスシートのデータソース用の無料APIキー。該当コンポーネントにのみ必要です。

  • OilSymbol — ブローカーのWTI原油シンボル。原油コンポーネントに使用します(外部リクエストを行わず、直接読み取ります)。

  • FundamentalsRefreshHours / SentimentRefreshHours — 自動コンポーネントを更新する頻度。

Fundamentals: Manual Components

  • ManualFedStance — 現在のFed政策スタンスに対するユーザー自身の評価(0 = 非常にタカ派、100 = 非常にハト派)。

  • ManualCmeCutProb — 次回会合での利下げ確率。別の情報源から取得した値を入力します。

  • ManualNFPActual / ManualNFPExpected — 最新のNon-Farm Payrolls(NFP)の実績値と市場予想値。

  • ManualADPActual / ManualADPExpected — 最新のADP雇用統計の実績値と市場予想値。

  • ManualGeoScore — ユーザー自身による地政学的リスク評価(0~100)。

Sentiment: Manual Components

  • BPR_USBanksLong / BPR_USBanksShort — CFTC Bank Participation Reportに基づく米国銀行のロング/ショート数値。この2つの数値から、保存された履歴に対するパーセンタイルランキングを自動計算します。

SMC / Structure Detection

  • SwingWing — スイングポイントを確定するために必要な左右のバー数。

  • SwingLookback — スイング構造を検索する過去方向の範囲。

  • ATRPeriod — 内部ATRの平均期間。

  • DisplacementMult — 一般的なディスプレイスメント閾値(情報表示用)。

  • OBDisplacementMult — オーダーブロックのディスプレイスメント・ローソク足に必要な最小Body/ATR比率。

  • OBMaxWickRatio — そのローソク足に許容される最大ヒゲ比率。

  • SDMoveMultiple — 供給/需要ゾーンとして認識するために、ベースに対して必要となる相対的な値動きの大きさ。

  • EquilibriumBandPct — アクティブレンジ内の「エクイリブリアム」(中立)ゾーンの幅。

Signal Scoring (Conservative mode only)

  • RequireOrderBlock / RequireSweep / RequireDivergence — 各必須条件を個別に有効/無効化します。

  • MinSignalScore — シグナル生成に必要な最低コンフルエンススコア。

  • OBProximityPct — 価格が有効なオーダーブロックに接近していなければならない最大距離。

Delta (native tick data)

  • MaxTickBars — 実際のティックレベルの買い/売りDeltaを使用する直近バー数。これを超えると、出来高をプロキシとして使用します(ブローカーのティック履歴に依存)。

Exhaustion Detection

  • EnableExhaustion — オン/オフ。

  • ExhaustionWickMult / ExhaustionBodyMult — 有効なエグゾースション・ローソク足を定義するヒゲおよび実体サイズの閾値(ATR基準)。

Absorption Detection

  • EnableAbsorption — オン/オフ。

  • AbsorptionVolFactor — 直近平均に対する出来高の閾値。

  • AbsorptionRangeFactor — 許容される最大ローソク足レンジ(ATR基準)。

  • AbsorptionRejectPct — 必要となる最小ヒゲベースのリジェクション率。

Delta Divergence

  • EnableDivergence — オン/オフ。

  • DrawDivergenceMarks — チャート上にダイバージェンス・マーカーを表示します。

  • DivergenceMinSwingATR — Lower Low / Higher Highをダイバージェンスとして認識するために必要な最小スイングサイズ差(ATRスケーリング)。

Cluster Confluence

  • UseClusterScoring — オン/オフ。

  • MinClusterSignals — クラスターとして認識するために必要な同時発生要素数。

  • ClusterBonusScore — クラスターが検出された場合にコンフルエンススコアへ加算されるボーナス。

Visualization

  • DrawActiveRange / DrawOrderBlocks / DrawExhaustionMarks / DrawAbsorptionMarks — 各チャート要素を個別に表示/非表示します。

  • ZoneRayBars — ゾーンの長方形を右方向へ延長するバー数。

  • GV_Prefix — このインジケーター内部のGlobalVariablesに使用されるプレフィックス。状態を共有させない複数の独立インスタンスを実行する場合のみ変更してください。

Supply & Demand Zones

  • DrawSupplyDemandZones — オン/オフ。

  • SDLookback — ゾーンを検索する過去方向の範囲。

  • SDMaxBaseCandles — ゾーンのベースとして考慮する最大ローソク足数。

  • SDDisplacementMult — ゾーンとして認識するために必要な最小ディスプレイスメント閾値。

  • SDMaxZonesShown — 各方向に表示する最大ゾーン数。

  • SupplyZoneColor / DemandZoneColor — チャート上のゾーンカラー。

Marker Display

  • MarkLookbackBars — エグゾースション/アブソープション/ダイバージェンス/クラスター・マーカーを描画する過去バー数。

Options: Data Sources (CSV mode)

  • CSV_File_Name — オプションチェーンのCSVファイル(リアルタイムAPIモードが無効の場合のみ使用)。

  • Weekly_Call_Strikes / Weekly_Put_Strikes — 手動入力する週間ストライクデータ。

  • Weekly_Weight — 月次データに対する週間データの相対ウェイト。

Live Data Source

  • UseLiveAPI — オン/オフ(上記のオプション・ポジショニングレイヤーを参照)。

  • FlashAlpha_API_Key — リアルタイムデータプロバイダー用のユーザー自身のAPIキー。

  • FlashAlpha_Symbol — リアルタイムモードで使用する相関株式のシンボル。

  • FlashAlpha_Expiration — 対象となるオプションの満期日。

  • RefreshIntervalHours / MaxDailyAPICalls — 更新頻度および1日あたりのAPI呼び出し上限。

Options: Thresholds

  • Min_OI_Threshold / Min_Volume_Threshold — ストライクを対象として認識するために必要な最小Open Interestおよび出来高。

  • Max_Pain_Buffer — 算出されたMax Painレベル周辺の許容範囲。

  • Max_Strikes_Processed — フィルタリング後に保持する最大ストライク数。

  • Max_Battle_Zones_Shown — 高出来高の「Battle Zone」レベルを表示する最大数。

Options: Refresh

  • Refresh_Hotkey — 即時更新を強制するチャート上のホットキー。

  • Auto_Refresh_Seconds — CSVモードでの自動更新間隔。

Options Liquidity Confluence

  • UseOptionsConfluence — 近接するオプションレベルをコンフルエンススコアのボーナス要素として使用します。

  • OptionsConfluenceATRMult — 近接判定の許容範囲(ATRスケーリング)。

  • OptionsConfluenceBonus — 適用されるスコアボーナス。

Higher-Timeframe Confirmation

  • UseHTFFilter — 上位時間足の方向性との一致を要求します。

  • HTFTimeframe — 確認対象となる上位時間足。

  • HTFLookbackBars — 比較する上位時間足のバー数。

  • HTFNeutralPct — 明確な方向性として認識するために必要な最小変動率。この値を下回る場合、上位時間足はニュートラルとして扱われます。

Session Filter

  • AllowedSession — ロンドン、ニューヨーク、両方、またはすべてのセッションにシグナルを制限します(UTCのおおよその時間帯)。

  • UTCOffsetHours — ブローカーのサーバー時間のUTCオフセットを調整します。

Alerts

  • AlertOnSignal — 新しいシグナルごとにポップアップアラートを表示します。

  • SendPushNotification — 新しいシグナルごとにモバイルプッシュ通知を送信します。

  • SuppressAlertsOnBackfill — チャートに初めてインジケーターを追加した際、過去シグナルに対するアラートを抑制します。

Signal Cooldown

  • SignalCooldownBars — 同一レベルで繰り返しシグナルが発生するまでに必要な最小バー数。

Stale Zone Decay

  • MaxBarAgeForSignal — オーダーブロックが新しいシグナルの対象として有効であり続ける最大経過バー数。

Fibonacci Extension Reference

  • EnableFibTargets — オン/オフ。

  • FibTP1 / FibTP2 / FibTP3 — 参照ラインに使用するエクステンション比率(視覚的な参考情報のみ)。

  • FibTP1Color / FibTP2Color / FibTP3Color / TrailBEColor — 各ラインのチャートカラー。


おすすめのプロダクト
Smart FVG Stats
- Md Rashidul Hasan
5 (1)
The  Smart FVG Statistics Indicator  is a powerful MetaTrader 5 tool designed to automatically identify, track, and analyze Fair Value Gaps (FVGs) on your charts. Love it? Hate it? Let me know in a review! Feature requests and ideas for new tools are highly appreciated. :) Try "The AUDCAD Trader": https://www.mql5.com/en/market/product/151841 Key Features Advanced  Fair Value Gap  Detection Automatic Identification : Automatically scans for both bullish and bearish FVGs across specified histo
FREE
Swiss VWAPsimple
Terence Gronowski
4.8 (5)
Swiss VWAPsimple Motivation Did not find free VWAP that works, the one that I found craseh. So I created a VWAP which calculates values only for the actual day. So computer resouces are not over stressed. What is VWAP, how is it used?  VWAP stands for Volume Weighed Average Price, it calculates the running sum of tick volume and the runnung sum of price times tickvolume. The division of these sums result in a weighed price (Sum P*V/Sum V). The calculation starts normally at midnight. The values
FREE
White Weis Volume This indicator shows the sum of the volume in each wave, bulish or bearish, as idealized by David Weis , but it brings an important addition , which is the marking of the bar with the highest volume of the wave (White Bar)! In coding the indicator, it was sought to optimize the code to require minimal processing during use and not to overload mt5. The indicator can be used for pre-trading analysis and study, where the trader analyzes possible points of support and resistance
High Low Open Close
Alexandre Borela
4.98 (45)
このプロジェクトが好きなら、5つ星レビューを残してください。 このインジケータは、指定されたためのオープン、ハイ、ロー、クローズ価格を描画します 特定のタイムゾーンの期間と調整が可能です。 これらは、多くの機関や専門家によって見られた重要なレベルです トレーダーは、彼らがより多くのかもしれない場所を知るために有用であり、 アクティブ。 利用可能な期間は次のとおりです。 前の日。 前週。 前の月。 前の四半期。 前年。 または: 現在の日。 現在の週。 現在の月。 現在の四半期。 現年。
FREE
VWAP Anchor Tool
Jackson Mukurani Wanguthi
Anchored VWAP is a lightweight, interactive volume-weighted average price indicator designed for traders who need precision without clutter. Unlike standard VWAP that resets every session, this tool lets you drop up to five custom anchors directly on any candle. Each anchor calculates VWAP from that exact point forward, complete with standard deviation bands to highlight where price may find support or resistance relative to volume. Key Features: • Up to 5 simultaneous anchors — compare multi
FREE
Simple Vwap with the daily, weekly and monthly VWAP is the abbreviation for   volume-weighted average price , which is a technical analysis tool that shows the ratio of an asset's price to its total trade volume. It provides traders and investors with a measure of the average price at which a stock is traded over a given period of time. How it's used Identify entry and exit points:   Traders can use VWAP to determine when to buy or sell an asset.   Understand price trends :  Traders can use V
FREE
VWAP + Volume Profile Combined Indicator FREE Launch Offer OVERVIEW Professional combination of VWAP (Volume Weighted Average Price)  and Volume Profile in a single MT5 indicator. This powerful tool  combines two of the most respected institutional trading tools  into one seamless display. KEY FEATURES 1. VWAP with 6 calculation modes 2. Volume Profile with Value Area analysis 3. Point of Control identification 4. Standard deviation bands 5. Dynamic color changing 6. Separate buy/sell vol
FREE
Weis Wave Double Side Alert
Eduardo Da Costa Custodio Santos
The Weis Wave Bouble Side Indicator for MT5 is part of the toolkit (Wyckoff Academy Wave Market) The Weis Wave Bouble side Indicator for MT5 was created based on the already established Weis Wave created by David Weis. The Weis Wave Double Side indicator reads the market in waves as R. Wyckoff did in 1900. It helps in the identification of effort x result, cause and effect, and Supply and demand Its differential is that it can be used below the zero axis and has a breakout alert showing Who is s
概要 このインジケーターは、クラシックな ドンチャンチャネル を強化したバージョンで、実践的なトレード機能を追加しています。 標準の3本線(上限、下限、中央線)に加え、 ブレイクアウト を検出し、チャート上に矢印で視覚的に表示します。また、チャートを見やすくするために、 現在のトレンド方向と逆側のラインのみを表示 します。 インジケーターの機能: 視覚的シグナル :ブレイクアウト時にカラフルな矢印を表示 自動通知 :ポップアップ、プッシュ通知、Eメール RSIフィルター :市場の相対的な強弱に基づいてシグナルを検証 カスタマイズ可能 :色、ラインの太さ、矢印コード、RSI閾値など 動作原理 ドンチャンチャネルは次のように計算します: 上限線 :直近N本のクローズ済みローソク足の最高値 下限線 :直近N本のクローズ済みローソク足の最安値 中央線 :最高値と最安値の平均値 上方ブレイクアウト は終値が上限線を超えたときに発生し、 下方ブレイクアウト は終値が下限線を下回ったときに発生します。 インジケーターは以下を行います: 3本のドンチャンラインを描画 方向転換後の最初のブレイクアウト
FREE
Indicator Description Range Filter Pro is a sophisticated trading tool for XAUUSD (Gold) that combines adaptive price filtering with volume analysis and real-time market monitoring. Designed for both novice and professional traders, this indicator helps identify trend direction, potential reversals, and significant market movements through its multi-layered approach. Key Components 1.Dynamic Range Filter 2.Volatility-Adjusted Bands 3.Volume-Enhanced Candles 4.Professional Trading Dashboard 5.M
FREE
How it works –   Base-departure detection — algorithmically finds consolidation bases (overlapping range with compressed volatility) followed by displacement departures. Patterns: Drop-Base-Rally, Rally-Base-Drop, Rally-Base-Rally, Drop-Base-Drop — detected structurally, not by candle names. –   Strength score (0–100) — from departure velocity, time-at-base, freshness (each revisit decays the score), higher-timeframe confluence and origin volume. –   Lifecycle — Fresh, Tested (decaying), Broken
FREE
MIDAS Super VWAP
Flavio Javier Jarabeck
4.27 (11)
Imagine VWAP, MVWAP and MIDAS in one place... Well, you found it! Now you can track the movement of Big Players in various ways, as they in general pursue the benchmarks related to this measuring, gauging if they had good execution or poor execution on their orders. Traders and analysts use the VWAP to eliminate the noise that occurs throughout the day, so they can measure what prices buyers and sellers are really trading. VWAP gives traders insight into how a stock trades for that day and deter
FREE
Macro-R Pro Signal — Advanced Trading Signal Indicator Macro-R Pro Signal is a professional trading indicator designed to deliver high-quality BUY and SELL signals with enhanced precision and reduced market noise. By combining Bollinger Bands, RSI, and adaptive volatility filtering , this indicator helps traders identify high-probability reversal points while avoiding unfavorable market conditions. How the Strategy Works This indicator is built on a mean reversion + momentum confirmation concep
FREE
Donchian Channel is an indicator created by Richard Donchian. It is formed by taking the highest high and the lowest low of the last specified period in candles. The area between high and low is the channel for the chosen period. Its configuration is simple. It is possible to have the average between the upper and lower lines, plus you have alerts when price hits one side. If you have any questions or find any bugs, please contact me. Enjoy!
FREE
MSX Hybrid Heiken Scalper Overview MSX Hybrid Heiken Scalper is a MetaTrader 5 indicator based on a modified Heiken Ashi methodology with closed-bar smoothing. The indicator is designed to display trend direction through color-coded candles while reducing sensitivity to short-term market fluctuations. All calculations are performed using completed candles, allowing historical values to remain fixed after bar close. Features • Modified Heiken Ashi calculation • Closed-bar processing • Color-code
FREE
Simple Weis Wave
Jean Jacques Huve Ribeiro
3.67 (3)
One of the best tools for analyzing volume, Weis Wave was idelized by David Weis, to facilitate the reading of directional flow. For the VSA method disciples it is an evolution of the practices created by Richard Wycoff, facilitating a predictive reading of the market, always seeking an accumulation and distribution of the negotiated contracts. Cumulative wave volume  Range of wave ( removed) Average Wave volume Ref "Tim Ord lectures" ( removed)
FREE
VWAP Diaria
Samuel De Souza Ferreira
Daily VWAP — Institutional Reference for Intraday Value The Daily VWAP is a professional indicator based on the Volume-Weighted Average Price (VWAP) , designed to reveal the true balance between price and volume throughout the trading session. Unlike traditional moving averages, the Daily VWAP incorporates the weight of traded volume in every price movement, providing a much more accurate reference to the behavior of institutional traders and large market participants. What the indicator deliver
FREE
Correlation Matrix Pro - マルチ通貨ヘッジスキャナー 通貨ペア間の相関関係をリアルタイムで把握! 最大6つの通貨ペア間の統計的関係を同時に可視化する強力な分析ツールです。ポートフォリオ管理、リスク分散、ヘッジ戦略に最適です。 主な機能 - 対数リターンを使用したリアルタイムピアソン相関 - 最大6通貨ペアを同時監視 - 自動タイムフレーム検出 - 調整可能な遡及期間(5-200本) - ヘッジ機会の自動検出 - ミニマルで折りたたみ可能なパネルデザイン - 即座に解釈できるカラーコード付きマトリックス カラーコード 緑 (+0.70 〜 +1.00) = 強い正の相関 薄緑 (+0.50 〜 +0.69) = 中程度の正の相関 グレー (-0.49 〜 +0.49) = 弱い/相関なし オレンジ (-0.50 〜 -0.69) = 中程度の負の相関 赤 (-0.70 〜 -1.00) = 強い負の相関(ヘッジ) なぜ相関分析が重要? リスク管理 高相関ポジションによるリスクの二重化を回避。 ヘッジ戦略 効果的なヘッジのため、強い負の相関を持つペアを自動検出。
FREE
Follow The Line MT5
Oliver Gideon Amofa Appiah
4.6 (35)
This indicator obeys the popular maxim that: "THE TREND IS YOUR FRIEND" It paints a GREEN line for BUY and also paints a RED line for SELL. (you can change the colors). It gives alarms and alerts of all kinds. IT DOES NOT REPAINT and can be used for all currency pairs and timeframes. Yes, as easy and simple as that. Even a newbie can use it to make great and reliable trades. NB: For best results, get my other premium indicators for more powerful and reliable signals. Get them here: https://www.m
FREE
Key level wedge MT5
Presley Annais Tatenda Meck
The   Key level wedge MT5   indicator automatically draws rising wedge pattern and falling wedge pattern for you on the chart. This pattern is really good when used as a confirmation entry at key support & resistance, supply & demand and reversal zones. Advantages  The   Key level wedge MT5   block DOES NOT RE-PAINT, giving you confidence when a signal appears and also helps when looking back.  The   Key level wedge MT5   includes an on/off button on the chart to easily keep the charts clean
The indicator highlights the points that a professional trader sees in ordinary indicators. VisualVol visually displays different volatility indicators on a single scale and a common align. Highlights the excess of volume indicators in color. At the same time, Tick and Real Volume, Actual range, ATR, candle size and return (open-close difference) can be displayed. Thanks to VisualVol, you will see the market periods and the right time for different trading operations. This version is intended f
FREE
Important Lines
Terence Gronowski
4.88 (24)
This indicator displays Pivot-Lines, preday high and low, preday close and the minimum and maximum of the previous hour. You just have to put this single indicator to the chart to have all these important lines, no need to setup many single indicators. Why certain lines are important Preday high and low : These are watched by traders who trade in a daily chart. Very often, if price climbs over or falls under a preday low/high there is an acceleration in buying/selling. It is a breakout out of a
FREE
Renko bricks drawn as time-anchored boxes on your ordinary chart, so brick structure and real time stay visible together. A renko brick prints when price moves a set distance, ignoring how long that takes. That strips out the sideways noise a time chart is full of. The usual way to see them is a separate offline chart, which loses the clock. This draws the same bricks over your normal candles instead, so you keep the time axis, your other indicators, and your orders. How the bricks are built Onl
FREE
The utility draws reversal levels using the formulas for each of the selected number of candles: Pivot = (high + close + low) / 3 R1 = ( 2 * Pivot) - low S1 = ( 2 * Pivot) - high R2 = Pivot + (R1 -S1) R3 = high + ( 2 * (Pivot - low)) S2 = Pivot - (R1 - S1) S3 = low - ( 2 * (high - Pivot)) H = high L = low U = if the candle is bullish, then close. Otherwise - open D = if the candle is bullish, then open. Otherwise - close On any timeframe. After a new candle closes on the calculated timeframe
FREE
Sweep Liquidity
Nawal Kishor Yadav
5 (1)
Liquidity Sweep Pro v3.2 — スマートマネー流動性検知 機関投資家の流動性スイープをリアルタイムで検知するために設計されたプロフェッショナル指標です。Buy-Side Liquidity (BSL) と Sell-Side Liquidity (SSL) のスイープを特定し、Strong と Weak に自動分類します。 主な機能: • BSL および SSL スイープのリアルタイム検知 • ヒゲの比率、ボディの終値、出来高に基づく Strong vs Weak 分類 • 品質フィルター搭載:    - Wick Ratio Filter(Strong & Weak それぞれ調整可能)    - Volume Filter(ティック出来高 vs MA)    - Body-Close Filter • 現在のセッション別スイープカウンターダッシュボード(Strong/Weak BSL & SSL) • 非リペイント矢印 — シグナルはバーの終値で確定 • 色、矢印の距離、パネル位置、フィルター設定を完全にカスタマイズ可能 • シグナルの密集を防ぐクールダウンシ
FREE
Girassol Sunflower MT5 Indicator
Saullo De Oliveira Pacheco
3.86 (7)
This is the famous Sunflower indicator for Metatrader5. This indicator marks possible tops and bottoms on price charts. The indicator identifies tops and bottoms in the asset's price history, keep in mind that the current sunflower of the last candle repaints, as it is not possible to identify a top until the market reverses and it is also not possible to identify a bottom without the market stop falling and start rising. If you are looking for a professional programmer for Metatrader5, please
FREE
ピボットポイントフィボRSJは、フィボナッチレートを使用してその日のサポートラインとレジスタンスラインを追跡するインジケーターです。 この壮大な指標は、フィボナッチレートを使用してピボットポイントを通じて最大7レベルのサポートとレジスタンスを作成します。 価格がこのサポートとレジスタンスの各レベルを尊重する方法は素晴らしいです。そこでは、オペレーションの可能な入口/出口ポイントを認識することができます。 特徴 最大7レベルのサポートと7レベルの抵抗 レベルの色を個別に設定します 入力 ピボットタイプ ピボットフィボRSJ1 =フィボ比1の計算 ピボットフィボRSJ2 =フィボ比2の計算 ピボットフィボRSJ3 =フィボ比3の計算 ピボットフィボクラシック=クラシックピボット計算 最小ピボットレベル ピボット3レベル ピボット4レベル ピボット5レベル ピボット6レベル ピボット7レベル それでも質問がある場合は、ダイレクトメッセージで私に連絡してください: https://www.mql5.com/ja/users/robsjunqueira/
FREE
Value Chart Candlesticks
Flavio Javier Jarabeck
4.57 (14)
The idea of a Value Chart indicator was presented in the very good book I read back in 2020 , " Dynamic Trading Indicators: Winning with Value Charts and Price Action Profile ", from the authors Mark Helweg and David Stendahl. The idea is simple and the result is pure genius: Present candlestick Price analysis in a detrended way! HOW TO READ THIS INDICATOR Look for Overbought and Oversold levels. Of course, you will need to test the settings a lot to find the "correct" one for your approach. It
FREE
Bollinger Bands B
Flavio Javier Jarabeck
4.5 (6)
John Bollinger created this indicator in 2010 as a way to read the original indicator (Bollinger Bands) in a more "technical" way, shown as an oscillator. The typical range of the Bollinger Bands %B is 0 - 0.5 - 1.0, where "0" represents the lower band, the "0.5" the middle band, and "1" the upper band. The line on the indicator represents the Closing prices. As simple as that. SETTINGS Bollinger Bands period of analysis Standard Deviation multiplier Shift Price type to be analyzed If you like
FREE
Theory VWAP is a volume-weighted moving average, bringing greater relevance to prices. The VWAP base calculation follows the classic formula described in Investopedia ( https://www.investopedia.com/terms/v/vwap.asp ). VWAP = sum(typical price[i]*volume[i]) / sum(volume[i]) Functionalities Orion Intraday VWAP innovates by allowing the user to choose between the conventional Daily, Weekly and Monthly periods, also having the option of calculating the Intraday indicator, as used in other platform
このプロダクトを購入した人は以下も購入しています
Neuro Poseidon is a new indicator by Daria Rezueva. It combines precise trading signals with adaptive TP/SL levels - creating best possible trades as a result! Message me and get  Neuro Poseidon Assistant  as a gift to automize your trading process! What makes it stand out? 1. Proven profitability on all assets and timeframes 2. Only confirmed BUY and SELL signals present on the chart 3. Adaptive TP & SL levels generated by the software for each trade 4. Easy to understand - suitable for al
UZFX {SSS} スキャルピング・スマートシグナル v5.0 MT5は、変動の激しい市場において正確かつリアルタイムのシグナルを求めるスキャルパー、デイトレーダー、スイングトレーダー向けに設計された、リペイントのない高性能な取引インジケーターです。(UZFX-LABS)によって開発されたこのインジケーターは、価格行動分析、トレンド確認、スマートフィルタリングを組み合わせることで、すべての通貨ペアおよび時間枠において、高確率の売買シグナル、警告シグナル、トレンド継続の機会を生成します。 トレードの判断に迷うのはもうやめましょう。明確さ、正確さ、そして規律ある市場執行を求めるトレーダーのために設計された、体系的なシグナルシステムに従い始めましょう。 間違いなく、MQL5で入手可能な最高のインジケーターの一つです。絶対に見逃さないでください!!「スマートなトレーダーのためのスマートシグナル」 最新バージョン5.0がリリースされました。価格は予告なく最大499.99ドルまで値上がりする可能性がありますので、チャンスを逃さないようお早めにお求めください!! 購入を決める前に!無料トライアル
Azimuth Pro
Ottaviano De Cicco
5 (7)
Azimuth Pro V2:MT5向けシンセティック・フラクタル構造分析と確認済みエントリー 概要 Azimuth Pro は Merkava Labs によるマルチレベルスイング構造インジケーターです。4つのネストされたスイングレイヤー、スイングアンカーVWAP、ABCパターン検出、3タイムフレーム構造フィルタリング、そして確定バーでの確認済みエントリー — 1つのチャートで、ミクロスイングからマクロサイクルまでを網羅するワークフロー。 これはブラインドシグナル製品ではありません。ロケーション、コンテキスト、タイミングを重視するトレーダーのための構造ファーストワークフローです。 ️ サマーセール — 夏至とThe Oracle Proの発売を記念して、Azimuth Proが30%オフ。現在279 USD(通常399 USD)。期間限定の夏季オファー。 1. V2での変更点 シンセティック・マルチタイムフレームエンジン 上位タイムフレーム分析をMeridian Proと同じ独自のシンセティックアーキテクチャで一から再構築。よりクリーンなHTFコンテキスト、安定したライブ動作、
Boom & Crash & PainX & GainX Ultimate Spike Detector Trade Spikes With Confidence — Not Guesswork Catching spikes should be one of the most profitable strategies in synthetic markets. But for most traders, it becomes one of the most frustrating. You enter too early… price goes against you. You wait for a spike… it never comes. You finally catch one… but don’t know whether to hold or close. You make profit… then give it all back because there’s no exit plan. This is exactly the problem the Ultim
GEM Signal Pro GEM Signal Pro は、MetaTrader 5 向けのトレンドフォロー型インジケーターです。より明確なシグナル、より整理されたトレードセットアップ、そして実用的なリスク管理をチャート上で確認したいトレーダーのために設計されています。 単純な矢印だけを表示するのではなく、GEM Signal Pro はトレード全体の考え方を、より見やすく分かりやすい形で表示します。条件が確認されると、インジケーターはエントリー価格、ストップロス、利確目標をチャート上に表示し、トレードセットアップをより効率的に確認できるようにします。 動作の仕組み このインジケーターは、まず内部ロジックに基づいて有効なシードシグナルを検出します。 確認条件が満たされると、GEM Signal Pro はチャート上に完全なセットアップを表示します。これにより、トレーダーはトレード構造をより明確に把握し、手作業による分析を減らすことができます。 チャート上のトレードレベル 確認済みシグナルに対して、GEM Signal Pro は以下を表示できます。 エントリー価格 ストップロス テ
PrimeScalping is a powerful trading companion designed to generate high-probability entry signals with dynamic TP/SL/DP levels based on volatility. Built-in performance tracking shows win/loss stats, PP1/PP2 hits, and success rates — all updated live. Key Features: Buy/Sell signals with adaptive volatility bands Real-time TP/SL/DP levels based on ATR Built-in MA Filter with optional ATR/StdDev volatility Performance stats panel (Success, Profit/Loss, PP1/PP2) Alerts via popup, sound, push, or e
note: this indicator is for METATRADER4, if you want the version for METATRADER5 this is the link:  https://www.mql5.com/it/market/product/108106 TRENDMAESTRO ver 2.5 TRENDMAESTRO recognizes a new TREND from the start, he never makes mistakes. The certainty of identifying a new TREND is priceless. DESCRIPTION TRENDMAESTRO identifies a new TREND in the bud, this indicator examines the volatility, volumes and momentum to identify the moment in which there is an explosion of one or more of these da
Title:FX-AIEA Supply and Demand Zone Indicator (MT5) — Technical Overview Version: 2.51 | Platform: MetaTrader 5 Introduction Supply and demand zones are considered a core manifestation of institutional order flow, providing a more direct reflection of buying and selling pressure than traditional support/resistance levels. This indicator attempts to automate the identification of high-probability supply and demand zones using an adaptive ZigZag algorithm, reducing the subjectivity and time asso
多くの矢印インジケーターは、シグナルだけを表示して、その後の判断をすべてトレーダーに任せてしまいます。KT Alpha Hunter Arrows は、完整なトレードプランをチャート上に提示します。 各シグナル矢印が表示されるたびに、エントリーライン、ストップロス、4つのテイクプロフィット水準、そして現在の銘柄と時間足が今トレードに値するかどうかを示すリアルタイムのエッジ判定が、すでに描画された状態で表示されます。付属の Trade Manager EA は、あなたが手動でエントリーした後の実行管理を担当し、相場が荒れて判断がぶれやすい場面でも規律あるトレードを保ちやすくします。リペイントなし。確定足シグナルのみ。Forex、ゴールド、指数、その他あなたが取引するあらゆる銘柄に対応します。 主な機能 リペイントしない買い矢印と売り矢印を、足の確定後にのみ表示。 各シグナルに、エントリーライン、構造的ストップロス、4つのテイクプロフィット水準を表示。 Edge Dashboard が、現在のチャートで買いセットアップと売りセットアップを別々に評価。 判定システム:No Edge、Mar
SMC Sweep Fvg MT5 — スマートマネーと同じ目線で、チャート上に市場を映す こんな経験はありませんか。価格がストップを巻き取り、反転し、まさに想定どおりの方向へ進む。方向は正しかった。間違えたのはエントリーだけです。 このインジケーターは、そうした場面を減らすために作られています。分析で最も重い部分——チャートのマークアップ——を引き受け、本当に重要な「判断」をあなたに残します。 チャートに表示されるもの マーケットストラクチャー — 実際の構造的高値・安値に HH / HL / LH / LL ラベルとレベルライン。トレンドが一目で分かり、推測は不要です。 インバランスゾーン(FVG) — 価格が急ぎ過ぎて通過し、後で戻りやすい領域。未埋めと既埋めのゾーンは別色で表示されます。 流動性の動き — 反転前に市場がレベルを巻き取る瞬間を追跡します。 トレード設計の完成形 — エントリー矢印、ストップロス、利益目標。すべて描画済みで、頭の中で計算する必要はありません。 トレンドフィルター — 上位足のラインで、主戦場の動きの側に立ち続けられます。 インジケーターは
SmartScalping is a powerful trading companion designed to generate high-probability entry signals with dynamic TP/SL/DP levels based on volatility. Built-in performance tracking shows win/loss stats, PP1/PP2 hits, and success rates — all updated live. Key Features: Buy/Sell signals with adaptive volatility bands Real-time TP/SL/DP levels based on ATR Built-in MA Filter with optional ATR/StdDev volatility Performance stats panel (Success, Profit/Loss, PP1/PP2) Alerts via popup, sound, push, or e
ScalpPoint is a powerful trading companion designed to generate high-probability entry signals with dynamic TP/SL/DP levels based on volatility. Built-in performance tracking shows win/loss stats, PP1/PP2 hits, and success rates — all updated live. Key Features: Buy/Sell signals with adaptive volatility bands Real-time TP/SL/DP levels based on ATR Built-in MA Filter with optional ATR/StdDev volatility Performance stats panel (Success, Profit/Loss, PP1/PP2) Alerts via popup, sound, push, or emai
MasterTrend Indicator for MT5 A powerful trend-following and signal-evaluation tool MasterTrend   is a custom MT5 indicator that combines Moving Averages and ATR-based risk/reward logic to generate clear buy/sell signals. It visualizes dynamic SL/TP levels, evaluates past trade outcomes, and displays win/loss statistics in a clean on-chart panel. Key features include: Buy/Sell signals based on MA crossovers ATR-based SL/TP1/TP2/TP3 levels with visual lines and labels Signal outcome tracking wit
このインジケーターは、市場で 関心が示されたゾーン をハイライトし、その後に 注文の蓄積ゾーン を表示します。 これは、大規模な**板情報(オーダーブック)**のように機能します。 これは、 巨大な資金 のためのインジケーターです。その性能は卓越しています。 市場にどんな関心が存在していても、 必ず目に見えるようになります 。 (これは 完全に再設計され、自動化されたバージョン です。もはや手動分析は必要ありません。) トランザクションスピード(取引速度) は新しい概念のインジケーターで、市場で大口注文が どこに・いつ 集中しているかを示し、それに基づいたチャンスを提供します。 トレンドの変化を 非常に早い段階 で察知することができます。 FXでは「出来高」と呼ばれているものは誤解されています。実際には、これは 時間あたりの価格変動量 です。したがって、正しい名称は トランザクションスピード です。 考え方・行動・分析の仕方すべてが問われます。 分析パラダイムの転換は非常に重要です。 このインジケーターは、FXにおける出来高の考え方を 根本から再定義 し、論理的な形で正確に活用する、
RelicusRoad Pro: 定量的市場オペレーティングシステム 【期間限定】無制限アクセス 70% OFF - 2,000人超のトレーダーと共に なぜ多くのトレーダーは「完璧な」インジケーターを使っても失敗するのでしょうか? それは、文脈を無視して 単一の概念 だけでトレードしているからです。文脈のないシグナルは単なるギャンブルです。勝ち続けるには、 根拠の重なり(コンフルエンス) が必要です。 RelicusRoad Proは単なる矢印インジケーターではありません。完全な 定量的市場エコシステム です。独自のボラティリティモデリングを用いて、価格が推移する「適正価値の道(Fair Value Road)」をマッピングし、ノイズと真の構造的ブレイクを判別します。 推測はやめましょう。機関投資家レベルの「ロード・ロジック」でトレードを。 コアエンジン:「Road」アルゴリズム システムの中心となる Road Algo は、市場環境にリアルタイムで適応するダイナミックなボラティリティチャネルです。 安全ライン(平衡点) と、価格が数学的に反転しやすい 拡張レベル を投影します。 Si
相場が本当は何をしているのかを見抜く。   3つの市場フェーズ(収縮・拡張・トレンド)を目の前でライブに捉え、トレンド・フェーズの初期段階でより優れたエントリーを取りましょう   。      当て推量はもう終わり。機関投資家やスマートマネーのように相場を読み始めましょう。   Apex Market Structure Pro(MT5版)は、ノイズを取り除き、あらゆるローソク足の下にある真の構造を見せる高精度のスマートマネー分析ツ   ールです。流動性、構造転換、蓄積ゾーン、トレンドバイアスを、ひとつのクリーンでプロフェッショナルなオーバーレイに集約します。遅行   指標に見切りをつけ、明晰さをもってトレードする準備のできた本気のトレーダーのために作られました。   重要:本インジケーターは Heikin Ashi(平均足)ローソク足での動作を前提に設計されています。使用前にチャートを Heikin Ashi   に設定し、その真価を解き放ってください。分析のすべては Heikin Ashi の価格の流れを軸に構築されています。Apex Market Structure Pr
Historical Similarity Matcher Indicator (HI.SI.MA) Try it free today — demo version now available!   https://www.mql5.com/en/market/product/167114 Overview The Historical Similarity Matcher is a technical analysis indicator for MetaTrader 5. It scans historical price data to find segments that show statistical similarity to a user-selected reference period on the chart.
AriX
Temirlan Kdyrkhan
1 (4)
AriX Indicator for MT5 A powerful trend-following and signal-evaluation tool AriX is a custom MT5 indicator that combines Moving Averages and ATR-based risk/reward logic to generate clear buy/sell signals. It visualizes dynamic SL/TP levels, evaluates past trade outcomes, and displays win/loss statistics in a clean on-chart panel. Key features include: Buy/Sell signals based on MA crossovers ATR-based SL/TP1/TP2/TP3 levels with visual lines and labels Signal outcome tracking with real-time stat
Gold Uptrend Insider
Lawrence Chiiambb Mkandawi
5 (1)
Uptrend Insider A clean and powerful trend-following indicator that helps you catch the beginning of uptrends and exit before the market turns into a range or downtrend. How it works:   Green → Uptrend signal (potential buying opportunity) Orange → Ranging / sideways market possibility but maintain the trend positions just keep an eye for possible ranges and reversals. Red → Downtrend or exit signal (time to close long positions) The indicator is designed to be extremely simple and visual. You o
OrderFlow Absorption – MT5用プロフェッショナル・デルタ&アブソープションシグナルインジケーター OrderFlow Absorptionで本物のオーダーフロー分析の力を解き放ちましょう。MetaTrader 5向けの究極のデルタヒストグラム&アブソープションシグナルインジケーターです。あらゆる価格変動の裏側で何が起きているのかを知りたいトレーダーのために設計されており、市場を動かす隠れた買い/売り圧力や吸収イベントを明らかにします。 特徴 デルタヒストグラムの可視化:   買い圧力・売り圧力を色分けされたヒストグラムで即座に表示。 アブソープションシグナル検出:   高度なロジックで強気・弱気の吸収イベントを特定し、反転の兆しを早期に通知。 チャートマーカー:   吸収シグナルをチャート上に直接マークし、視覚的に分かりやすく表示。 ポップアップアラート:   新しい吸収シグナルが出現した際にリアルタイムで通知。 カスタマイズ可能な閾値:   弱いシグナルを除外し、高確率のセットアップに集中。 リソース管理:   大きなチャートでも高速に動作する効率的な計算。
マーケットメーカーのためのツール。 Meravith は次の機能を提供します: すべての時間足を分析し、現在有効なトレンドを表示します。 強気と弱気の出来高が等しくなる流動性ゾーン(出来高均衡)を強調表示します。 異なる時間足のすべての流動性レベルをチャート上に直接表示します。 テキスト形式の市場分析を生成し、参考情報として表示します。 現在のトレンドに基づいて目標値、サポートレベル、ストップロスを計算します。 取引のリスクリワード比を算出します。 口座残高に基づいてポジションサイズを計算し、潜在的な利益を推定します。 また、市場に大きな変化があった場合には警告を表示します。 インジケーターの主要ライン: 強気/弱気の出来高エグゾーストライン ― 目標値として機能します。 市場のトレンドを示すライン。市場が強気か弱気かによって色が変わり、トレンドのサポートとして機能します。主にその色が市場センチメントを示します。 出来高均衡ライン(Eq)。Eq(Volume Equilibrium)ラインはシステムの中核です。これは買い手と売り手の出来高のバランスポイントを表します。市場の流動性を示し
トレーダーの皆さん、こんにちは! 多くの個人トレーダーは、動作の遅いウェブスクリプトに頼っています。真の収益性を実現するには、体系化されたフレームワークが必要です。 Astro AIインジケーターは、一般的なチャートオーバーレイではありません。これは、ターミナル上で直接動作する2つのエージェントを含む、コンパイル済みのニューラルネットワークです。 システムの具体的な技術は以下のとおりです。 1. エージェント1:アナリスト(グラフィカルニューラルネットワーク - GNN) 市場は孤立した価格バーではなく、相互に連結されたデータネットワークです。 機能:エージェント1は、グラフィカルニューラルネットワークを使用して、これらの複雑で非線形な関係をマッピングします。 利点:一般的なインジケーターは過去の移動平均しか考慮しませんが、当社のGNNは市場の深い構造的関係をリアルタイムで処理し、個人トレーダーの取引量が大きな影響を与える前に、隠れた相関関係を明らかにします。 2. エージェント2:エグゼキューター(近接戦略最適化 - PPO) パターン認識は、戦いの半分に過ぎません
VTrende Pro
Andrii Diachenko
5 (1)
VTrende Pro - MTF indicator for trend trading with a display panel for MT5 *** Videos can be translated into any language using subtitles (video language - Russian) Although the signals of the VTrende Pro indicator can be used as signals of a full-fledged trading system, it is recommended to use them in conjunction with the Bill Williams TS. VTrende Pro is an extended version of the VTrende indicator. Difference between Pro version and VTrende: - Time zones - Signal V - signal 1-2 waves -    S
Brandon Angelo Flag Pattern — how it works This indicator automatically detects classic bull and bear flag chart patterns in real time. The detection happens in three stages for each bar. First it looks for a flagpole — a sharp, strong directional move over a configurable number of bars ( FlagpoleBars , default 5) that must exceed a minimum percentage size ( FlagpoleMinPct ). For a bullish flag the pole must close net higher than it opened; for a bearish flag, net lower. Second it identifies th
This indicator automatically detects internal & swing market structure, Fibonacci Retracement and Fibo Levels. Features Full internal & swing market structure labeling in real-time Fibonacci Retracement Fibonacci Levels After purchasing the indicator, the full source code is provided, and via indicator buffers it can be easily integrated into your Expert Advisors (EAs) for automated trading strategies.
以下は Chimera Volume の日本語訳です。 MetaTrader 5用 Chimera Volume 高度な出来高分析と市場活動の可視化 Chimera Volumeは、MetaTrader 5向けに設計されたカスタムインジケーターです。正規化された出来高の動きを分析し、動的な視覚的フレームワークを通じて市場参加者の変化をリアルタイムで表示します。 このインジケーターは、適応型正規化アルゴリズムを用いてティック出来高データを処理し、出来高の強さ、蓄積フェーズ、および異なる市場条件下での活動シフトを構造化して表現します。 生の出来高を表示する標準的なインジケーターとは異なり、Chimera Volumeは追加の計算を適用することで、市場活動の相対的な変化を強調し、チャートの視認性を向上させます。 主な機能 ルート・インテント・ヒストグラム (Root Intent Histogram): 正規化された出来高の強さと市場参加度を視覚化する動的ヒストグラムです。適応型カラー・トランジションを採用しており、活動の活発化と参加の減少を明確に区別します。 慣性ライン (Inertia
MERAVITH SCANNERは、MetaTrader 5用のプロフェッショナルな金融市場インジケーターで、複数の分析ツールを一つの統合システムにまとめています。独自の出来高加重平均価格(VWAP)手法を使用してすべての計算を自動で行い、主観的な解釈を完全に排除します。 このインジケーターは、すべての資産クラス(FX、株式、指数、商品、暗号通貨)およびM1から月足までのすべての時間軸で動作します。基本原理は「価格は出来高に従う」というものです。MERAVITHは機関投資家の出来高が集中するポイントを特定し、その集中から数学的に正確な価格レベルを導き出します。予測や投機は行わず、計算のみを行います。 MERAVITH SCANNERを使用すると、28の主要FX通貨ペアをすべての時間軸でわずか2~3分でスキャンできます。また、任意の市場をスキャンすることも可能です。例えば、約100銘柄の株式を約10分でスキャンできます。 インジケーターは、消耗レベル、均衡線、偏差、統計レベル、およびターゲット予測を算出します。 チャート要素 Origin Point :すべての計算が始まる起点です。イン
Big Player Range
Thalles Nascimento De Carvalho
5 (3)
BigPlayerRange — MT5向け最強インジケーター BigPlayerRange は、MetaTrader 5 で日経ミニやドル先物などの取引において、 最も効果的なインジケーター と評価されています。大口投資家(機関投資家)の行動を可視化し、高精度なテクニカル分析を可能にします。 どのように機能するのか? BigPlayerRangeは、買い圧力ゾーン(緑ライン)と売り圧力ゾーン(赤ライン)を描画し、価格がその範囲を超えるとトレンド方向への動きを示唆します。 緑のライン上で終値: 買いの勢いが強く、上昇トレンドの可能性。 赤のライン下で終値: 売り圧力が優勢で、下落が予想される。 範囲内での価格: レンジ相場でブレイクを待つ段階。 主なメリット: 機関投資家ゾーンの検出: 大口のエントリーポイントを視覚化。 自動ターゲット計算: 利確ポイントを戦略的に設定。 プルバックの可能性分析: リスク管理に役立つ情報提供。 推奨の使い方: Imbalance DOM Pro と併用してゾーンブレイクを確認。 SwingVolum
Route Lines Prices MT5  - は、潜在的な取引シグナルを見つけるために設計されたインジケーターです。シンプルなインターフェースには、複数の価格変動アルゴリズムに加え、シグナル終点の検出と完了した軌跡の計算機能が搭載されています。アルゴリズムには、使用する時間枠に基づいたボラティリティと価格平滑化の計算が含まれています。 このインジケーターには、値を変更するための主要なパラメーター「 Calculating price values 」があります。デフォルト値の1は、バランスの取れた自動計算形式を提供し、インジケーターを手動で設定することなく使用できます。 2から500までの値を手動で変更することで、独自の取引システムに合わせてインジケーターをカスタマイズできます。 このインジケーターには、2本の移動平均線(高速移動平均線と低速移動平均線)の交点で表される市場方向インジケーターが組み込まれており、独自のトレンドを判断する際には無効にすることができます。 このインジケーターは、M1からH4の時間枠での使用を推奨します。あらゆる取引銘柄で使用できます。 シグナル
フィルタ:
レビューなし
レビューに返信