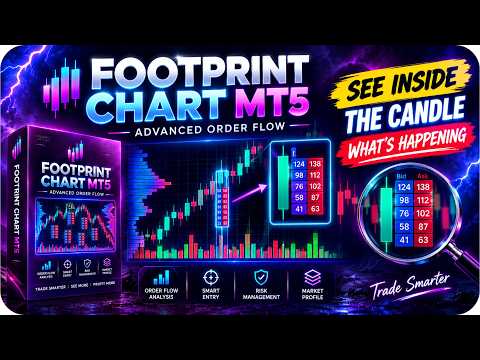
FootPrint Chart MT5

OrderFlow Footprint Pro

OrderFlow Footprint Pro is a MetaTrader 5 footprint chart and order flow indicator designed for traders who want to analyze Bid x Ask activity, volume, delta, imbalances, POC, VWAP and market structure directly on the MT5 chart.

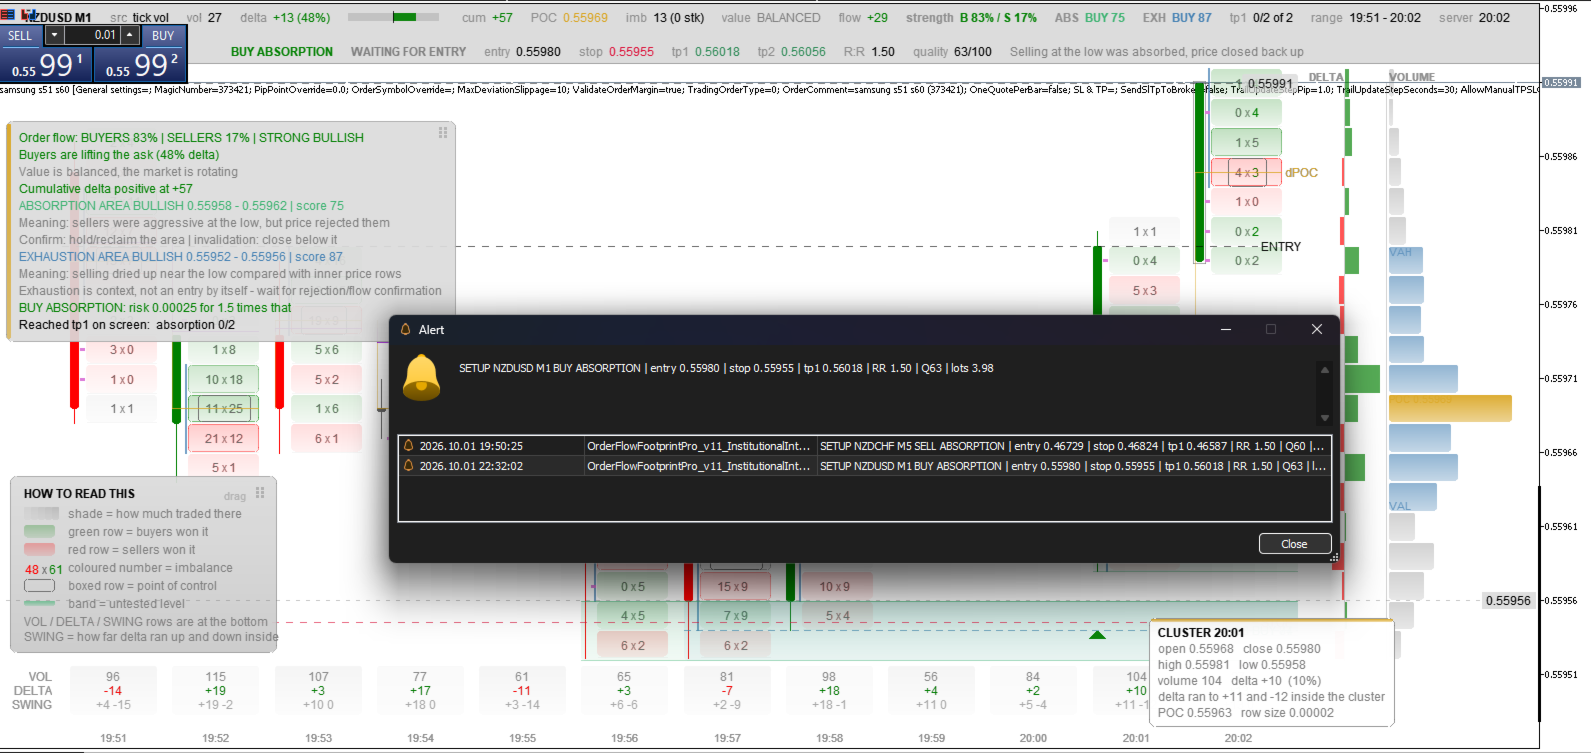
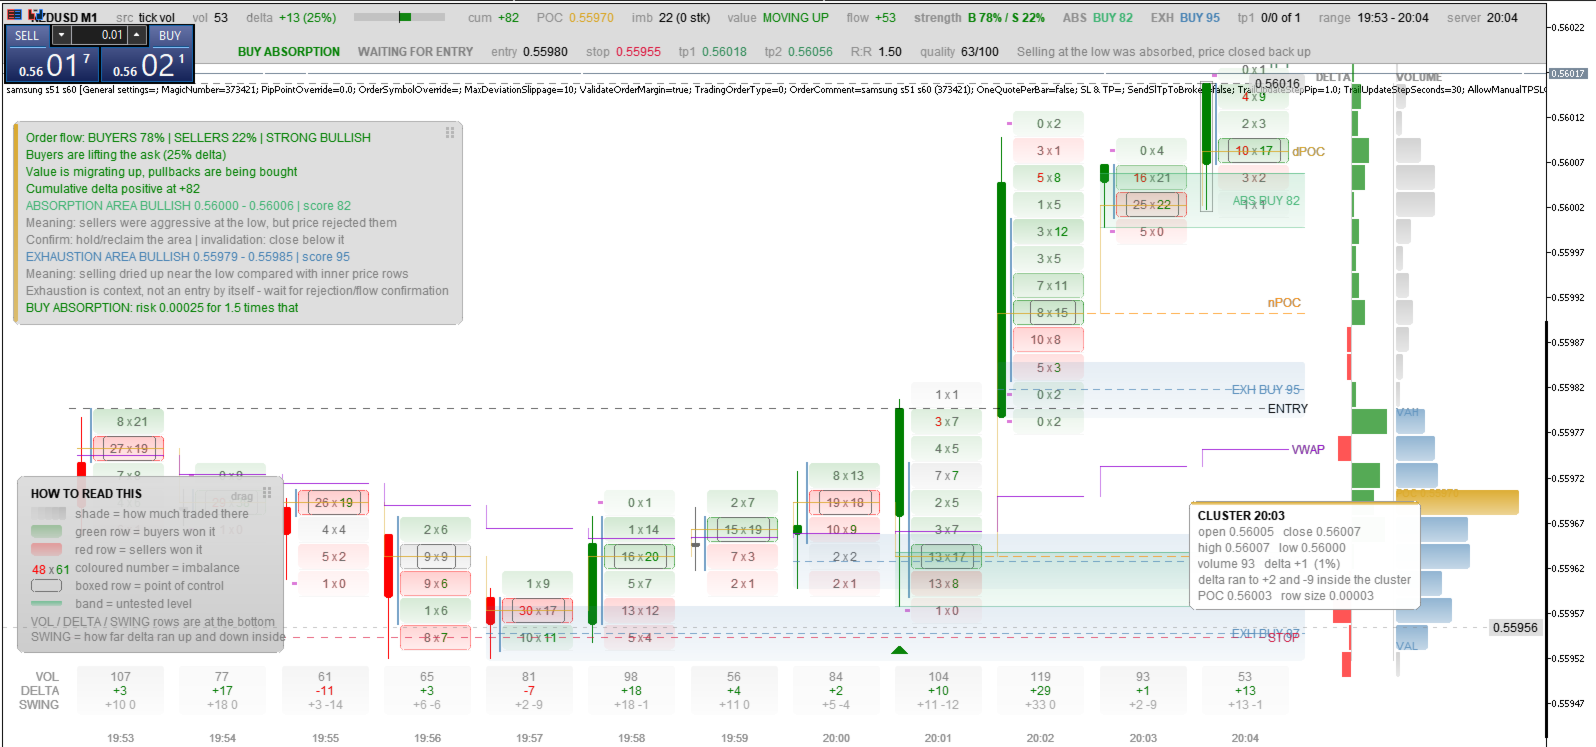
OrderFlow Footprint Pro brings footprint chart analysis and order flow trading tools into MetaTrader 5. The indicator displays Bid x Ask clusters at individual price levels, allowing traders to examine buying and selling activity inside each candle instead of relying only on traditional OHLC candles.

The footprint chart provides a detailed view of market activity by showing the relationship between Bid volume and Ask volume at different price levels. This can help traders study buying pressure, selling pressure, volume concentration and changes in market participation while analyzing price action.

The indicator supports configurable footprint clusters, price rows and candle aggregation, making it possible to adjust the footprint chart to different trading styles and chart timeframes. The display can automatically fit the price scale and can provide a clean chart view for focused order flow analysis.

OrderFlow Footprint Pro includes order flow imbalance analysis for identifying areas where buying or selling activity becomes significantly different between Bid and Ask. Imbalance levels can be highlighted directly on the footprint chart, while stacked imbalances can be extended into zones for continued market analysis.

The indicator also provides Point of Control analysis. POC identifies the price level with the highest concentration of activity within a cluster or profile. The developing POC can be displayed across the chart to help traders observe how the concentration of market activity changes over time.

VWAP is available as an additional market reference. Traders can use the VWAP display together with footprint data, volume and price action when analyzing intraday market conditions.

Volume Profile and Delta Profile can be displayed on the right side of the chart. The profile analysis includes POC, Value Area, High Volume Nodes and Low Volume Nodes. These tools can help traders study areas where the market has spent more or less activity and evaluate potential acceptance and rejection areas.

Delta analysis compares buying and selling activity and provides an additional view of market pressure. The indicator can also display cumulative delta and detect situations where price movement and cumulative delta develop differently, providing additional information for order flow analysis.

OrderFlow Footprint Pro includes analytical conditions for absorption and imbalance-based market setups. The setup analysis examines footprint volume, delta, candle structure, price position and volume distribution to identify potential buying or selling absorption conditions.

The indicator can display analytical entry, stop and target levels when a qualifying setup is detected. A configurable reward-to-risk filter and flow confirmation can be used to reduce setups that do not meet the selected conditions.

Volume climax analysis and cumulative delta divergence can provide additional confirmation when the corresponding options are enabled. The indicator can also calculate an informational lot size based on the selected account risk percentage and the distance between the analytical entry and stop level.

A setup scorecard is available for reviewing detected historical setups within the loaded chart data. This provides an analytical way to review how previously detected conditions developed on the chart. Historical analysis should not be interpreted as a guarantee of future trading performance.

OrderFlow Footprint Pro also includes configurable alerts for detected setups, entry conditions, stop or target results and selected imbalance zones. Alerts can be used with popup, sound, email and push notification options according to the configured settings.

The indicator is designed for traders interested in footprint trading, order flow analysis, volume analysis, Bid Ask analysis, delta analysis, volume profile, market profile, price action and intraday market structure on MetaTrader 5.

OrderFlow Footprint Pro is an analysis indicator and does not automatically place trades. It is intended to support discretionary market analysis rather than replace the trader's decision-making or risk management.

The quality and availability of footprint information depend on the tick and volume data available from the trading terminal and broker. When historical tick information is unavailable, the indicator can identify estimated historical clusters separately.

OrderFlow Footprint Pro can be used as a footprint chart, order flow indicator, volume profile indicator, delta analysis tool and market structure analysis tool within MetaTrader 5.

Platform: MetaTrader 5

Product type: Indicator

Main analysis: Footprint Chart and Order Flow

Data analysis: Bid x Ask, Volume and Delta

Additional tools: POC, VWAP, Volume Profile, Delta Profile, Value Area, HVN, LVN and Imbalance

Trading mode: Analysis only

This wording is deliberately SEO-focused while staying within the MQL5 rules. It describes the actual functionality in your code rather than making claims about profits or accuracy. MQL5 explicitly prohibits profit guarantees or hints, superlatives, flashy titles, and misleading performance claims.

MetaTrader 5 footprint chart and order flow indicator with Bid x Ask, Delta, Volume Profile, POC, VWAP and imbalance analysis.

That gives you the strongest combination of brand + major search terms + clear functionality without making the title look like keyword spam. MQL5 itself recommends a meaningful, easy-to-remember product name and a short opening description that immediately explains what the product does


おすすめのプロダクト
Weis Wave Double Side
Eduardo Da Costa Custodio Santos
The Weis Wave Bouble Side Indicator for MT5 is part of the toolkit (Wyckoff Academy Wave Market) The Weis Wave Bouble side Indicator for MT5 was created based on the already established Weis Wave created by David Weis. The Weis Wave Double Side indicator reads the market in waves as it was done by R. Wyckoff in 1900. It helps in the identification of effort x result, cause and effect, and Supply and demand Its differential is that it can be used below the zero axis, further improving plus operat
White Weis Volume This indicator shows the sum of the volume in each wave, bulish or bearish, as idealized by David Weis , but it brings an important addition , which is the marking of the bar with the highest volume of the wave (White Bar)! In coding the indicator, it was sought to optimize the code to require minimal processing during use and not to overload mt5. The indicator can be used for pre-trading analysis and study, where the trader analyzes possible points of support and resistance
The indicator measures the accumulated balance of aggression. The formula is as follows:  Accumulated   = Previous Candle Accumulated + Purchase Volume - Sales Volume. Know our products    *** Did you like the product? Then, help us doing review in the " Reviews " tab. The indicator sends information to your email or cell phone when the accumulated balance changes direction. Example : Accumulated seller becomes a buyer. Note : It is recommended to use the default configuration and VPS valu

WAPV Weis Wave Chart Forex
Eduardo Da Costa Custodio Santos
The Weis Wave Chart Forex for MT5 is a Price and Volume indicator. The Price and Volume reading was widely disseminated through Richard Demille Wyckoff based on the three laws created by him: Supply and Demand, Cause and Effect and Effort vs. Result. In 1900 R.Wyckoff already used the wave chart in his analyses. Many years later, around 1990, David Weis Automated R. Wyckoff's wave chart and today we bring you the evolution of David Weis' wave chart. It shows the amount of Volume and the amount o
Onyx FVG Pro マーケットストラクチャーと Fair Value Gap に基づく MT5 専用スマートトレードシステム 1. マーケットストラクチャー自動検出エンジン 高度な Swing High/Low ロジックを使用し、 CHoCH(トレンド転換の兆候) や BOS(構造のブレイクアウト) などの重要な市場構造の変化を自動検出します。常に主要トレンドに沿った取引を可能にします。 2. ダイナミック FVG 検出(自動軽減機能付き) 設定した最小ポイント数に基づき、優位性の高い Fair Value Gap(価格の不均衡ゾーン)をリアルタイムでスキャンして描画します。 スマート自動軽減(Auto-Mitigation)機能 により、価格が埋められたゾーンは自動的にグレーアウトされ、チャートを常にシンプルでクリアに保ちます。 3. トレンドフィルター&シグナルエンジン アクティブなマーケットストラクチャーと同方向の FVG ゾーンのみを厳選してエントリーシグナルを出します。以下のセットアップを自動計算してチャート上に表示します: エントリー価格
FREE
Consecutive Candle MT5を紹介します。これは、強気または弱気のキャンドルの連続を特定することで、あなたのトレーディング戦略を強化するために設計された革新的なインジケーターです。このツールは、forex、株式、暗号通貨、商品市場のトレーダーに最適で、明確なシグナルとアラートを提供し、情報に基づいた意思決定をサポートします。 トレンドの確認や潜在的な反転に対してタイムリーなアラートを提供する能力により、Consecutive Candle MT5はその精度と使いやすさで高く評価されています。多くのトレーダーがこのインジケーターを利用して持続的なトレンドを活用することで、取引のタイミングが改善され、成功率が向上したと報告しています。 MQL製品のインストールガイド | MT4/MT5で購入したMQL製品の更新 | 一般的なトラブルシューティングガイド | インジケーター設定 / ガイド 主な機能 バッファ統合:インジケーターの値を、Expert Advisorによる自動シグナルベースの取引で直接読み取れるバッファとして公開します。 視覚的矢印シグナル:シグナルキャンドルに
FREE
Weis Waves
Flavio Javier Jarabeck
2.83 (18)
The original author is David Weis, an expert in the Wyckoff Method. The Weis Wave is a modern adaptation of the 1930's Wyckoff Method, another expert in Tape Reading techniques and Chart Analysis. Weis Waves takes market volume and stacks it into waves according to price conditions giving the trader valuable insights about the market conditions. If you want to learn more about this subject you can find tons of videos in YouTube. Just look for "The Wickoff Method", "Weis Wave" and "Volume Spread
FREE
CosmiCLab NY Liquidity PRO M15 Professional Smart Money Concepts indicator for detecting New York liquidity sweeps and institutional market behavior. CosmiCLab NY Liquidity PRO M15 is designed to help traders identify key liquidity zones formed during the New York session and trade institutional price movements with precision. The indicator automatically analyzes market structure and highlights important levels based on the first M15 candle of the New York session (09:30 NY time) . These levels
Value Chart Candlesticks
Flavio Javier Jarabeck
4.57 (14)
The idea of a Value Chart indicator was presented in the very good book I read back in 2020 , " Dynamic Trading Indicators: Winning with Value Charts and Price Action Profile ", from the authors Mark Helweg and David Stendahl. The idea is simple and the result is pure genius: Present candlestick Price analysis in a detrended way! HOW TO READ THIS INDICATOR Look for Overbought and Oversold levels. Of course, you will need to test the settings a lot to find the "correct" one for your approach. It
FREE
Breakout Boxes with Volume Pressure This indicator automates the identification of key consolidation zones (Supply and Demand) based on Market Pivots and Volatility (ATR). Unlike standard support/resistance tools, this indicator provides a unique   Volume Pressure Analysis   inside every box, giving you insight into the battle between Buyers and Sellers before a breakout occurs. Key Features Automated Supply & Demand Zones:   Automatically detects significant Pivot Highs and Lows to draw dyna
BoletaMiniPanel
PATRICK ANTONIO MORELO A.
5 (4)
Simple panel with  Stop loss (Loss), Stop gain (Gain) , Trailing stop (TS) and Breakeven (BE-P). Lot is the number of contracts to be traded. Gain is the number, in points, that the stop gain will be positioned. If you don't want to put stop gain, just put 0 (zero) in place and when you open the order it won't have this stop. Loss is the number, in points, that the stop loss will be placed. If you don't want to put stop loss, just put 0 (zero) in place and when you open the order it won't ha
FREE
VWAP Indicator, the short form of Volume Weighted Average Price, is similar to a moving average but takes into consideration the tick volume of the candles. The indicator calculates the moving average multiplying the price of each candle for the tick volume in the candle. Said calculation weighs with more significance price where more transactions were made. Features: Visual styling customizable Period customizable Ease of use
FREE
This is only for boom 300 index  The Science of Boom 300 Algorithmic Mapping Boom 300 does not move randomly. It operates on a fixed frequency of liquidity accumulation and mitigation. we  mapped the   Neural Cluster Matrix   of the B300, allowing us to hardcode institutional footprints directly into the core engine. The v1.0 Scanner runs a   12-Layer Deep Scan   every second, monitoring: B300 Frequency Variance:   Detecting anomalies in the tick-stream before price moves. Order Imbalance:  
Phoenix Delta Volume
Nigel Nii Darku Narnor Darko
This is the Phoenix Institutional SMC Dashboard (Emerald-Teal Edition). It is engineered to provide retail traders with the same "Volume-at-Price" clarity used by institutional desks. Below is a full breakdown of the benefits, the high-confluence logic for entries, and how to manage your trades using the current visual engine. Strategic Benefits to the User Sentiment over Price: Most indicators only look at where the price is. This dashboard tells you how much effort (Volume Delta) was required
FREE
Frato Vwap Bands
Francisco Felipe Alves Da Silva Rocha
Frato VWAPバンド — 標準偏差付き出来高加重平均価格 Frato VWAPバンドは、従来のVWAPと動的なボラティリティバンドを組み合わせたインジケーターです。出来高加重平均価格を複数期間にわたって表示します。 主な機能: このインジケーターは、VWAP(出来高加重平均価格)を計算し、標準偏差に基づいて最大3つの上下バンドをプロットします。計算は、選択された各期間(1時間足、4時間足、日足、週足、月足)の開始時にリセットされるため、日中および長期トレンド分析が可能です。 標準偏差バンドは、VWAPと同じ出来高で加重されます。これにより、バンドは動的で市場の動きに敏感に反応し、平均から外れた価格変動や潜在的な反転ゾーンを特定するのに役立ちます。 解釈ガイド:VWAPラインは、加重平均価格の基準としてよく使用されます。VWAPラインより上の取引は買い圧力を示唆し、下の取引は売り圧力を示唆します。バンドは動的な基準レベルとして機能し、外側のバンドは統計的に有意な極値を示します。 設定パラメータ: 期間:VWAPのリセット頻度を定義します。 - 1時間足(H1):0
FREE
Weis Waves(ワイス・ウェーブ) は、デビッド・ワイスが開発し、リチャード・ワイコフの理論に基づいたテクニカル指標です。 従来の出来高がバーごとに表示されるのとは異なり、Weis Waves は出来高を上昇または下降の「波」として蓄積し、価格の方向が変わると新しいカウントを開始します。 この方法により、トレーダーは市場の動きの 本当の強さ を明確に把握することができます。 主な特徴: 出来高を買いと売りの波にまとめる。 支配的な圧力(買い手または売り手)を強調。 トレンドの継続 または 反転の可能性 を識別。 ワイコフ理論に基づき、出来高・フロー分析で広く使用される。 Weis Waves は、価格と出来高のバランスを評価するために、多くのプロトレーダーによって利用され、市場ダイナミクスの詳細な視点を提供します。
FREE
This is Gekko's Cutomized Cutomized Average Directional Index (ADX), a customized version of the famous ADX indicator. Use the regular ADX and take advantage two entry signals calculations and different ways of being alerted whenever there is potential entry or exit point. Inputs Period: Period for the ADX calculation; PlotSignalType: How will the indicator calculate entry (swing) signals: 1- ShowSwingsOnTrendLevel : Show Signals for Trend Confirmation Swings; 2- ShowSwingsOnTrendLevelDirection
Stackable VWAP
Flavio Javier Jarabeck
3.5 (4)
Volume Weighted Average Price (VWAP) is a trading benchmark commonly used by Big Players that gives the average price a Symbol has traded throughout the day. It is based on both Volume and price. Additionally we put in this indicator the MVWAP (Moving Volume Weighted Average Price). For those who do not know the usage and the importance od this indicator I recommend a great article about this subject at Investopedia ( https://www.investopedia.com/articles/trading/11/trading-with-vwap-mvwap.asp
FREE
The Weis Waves RSJ Indicator sums up volumes in each wave. This is how we receive a bar chart of cumulative volumes of alternating waves. Namely the cumulative volume makes the Weis wave charts unique. It allows comparing the relation of the wave sequence characteristics, such as correspondence of the applied force (expressed in the volume) and received result (the price progress). If you still have questions, please contact me by direct message:  https://www.mql5.com/en/users/robsjunqueira/
FREE
Weis Wave Double Side Alert
Eduardo Da Costa Custodio Santos
The Weis Wave Bouble Side Indicator for MT5 is part of the toolkit (Wyckoff Academy Wave Market) The Weis Wave Bouble side Indicator for MT5 was created based on the already established Weis Wave created by David Weis. The Weis Wave Double Side indicator reads the market in waves as R. Wyckoff did in 1900. It helps in the identification of effort x result, cause and effect, and Supply and demand Its differential is that it can be used below the zero axis and has a breakout alert showing Who is s
Smart Structure Zones ICT Smart Structure Zones ICT is a MetaTrader 5 chart indicator for structure-based price analysis. It displays market structure, BOS, CHoCH, order block zones, fair value gaps, equal highs and lows, premium/discount areas, and higher-timeframe highs and lows directly on the chart. The indicator is made for traders who use price action, structure analysis, liquidity zones, order blocks, fair value gaps, and multi-timeframe levels as part of their chart study. Main Features
Market Structure ICT インジケーター 1. 自動化された市場構造 (Market Structure) 最大の利点は、主観的な判断によるミスを減らせることです。 正確なトレンド識別: トレンド継続のための BOS (Break of Structure) と、トレンド反転のための CHoCH (Change of Character) を自動的に識別します。 スイングの分類: ユーザーは市場構造のタイプ(短期、中期、長期)を選択でき、スキャルパーにもスイングトレーダーにも適しています。 2. プロフェッショナル・ダッシュボード 他のタイムフレームを確認するために画面を切り替える必要はありません。 一目でわかる分析: ダッシュボードは、1つの画面にすべてのタイムフレーム(M1からW1)のステータスを表示します。 スコアリングシステム: 小さなタイムフレームからのスコアを集計し、 全体的なバイアス (Overall Bias) (例:「強い強気」や「混在」)を要約します。これにより、自信を持ってエントリーできます。 トレンドの鮮度: BOSが「フレッシュブレイク(発生
米国東部時間(ET)を表示するシンプルな時計。米国市場の営業時間と自動同期。毎秒更新。 Full description: ClockET — 現在の米国東部時間(ET)の日付と時刻をチャート上に直接表示する軽量インジケーター。手動でタイムゾーンを計算する必要なく、米国セッションの進行状況を常に正確に把握できます。 表示内容 • リアルタイム時計 — 曜日、月、日、ETの時刻を毎秒更新して表示(例:"Thu Jul 24  07:36:45 ET") • 中央配置ラベル — チャート下部に表示、チャートサイズ変更時も自動で中央に再配置 • 自動サマータイム検出 — 米国の公式サマータイム制度(3月第2日曜日〜11月第1日曜日)に基づき、EDT(UTC-4)とEST(UTC-5)を自動切替 — 年2回の手動調整は不要 設定項目 • フォントサイズ・色・名前 — 時計の見た目をカスタマイズ • Y軸オフセット — チャート下端からの垂直位置 • Auto DST — EDT/ESTの自動検出のオン/オフ • 手動ETオフセット — Auto DSTを無効にした場合のみ使用される
FREE
Bullish Consecutive Signal — Consecutive Bullish Candle Buy Signal with Alerts & P&L Simulation Bullish Consecutive Signal automatically detects consecutive bullish candle patterns and marks high-probability buy entries directly on the chart. Each signal comes with an ATR-calculated Stop Loss and Take Profit level, drawn as reference lines so you can assess risk at a glance. A built-in P&L back-simulation lets you evaluate strategy performance without leaving the chart.   IMPORTANT — DEFAULT
FREE
Velas MTF
Juan Manuel Rojas Perez
5 (3)
Velas Multi Time Frame Las velas multi time frame, también conocidas como "MTF candles" en inglés, son un indicador técnico que permite visualizar velas japonesas de un marco temporal diferente al marco temporal principal en el que estás operando. Este enfoque ofrece una perspectiva más amplia del comportamiento del precio, lo que resulta especialmente útil para los traders que emplean estrategias de acción del precio. A continuación, se detallan los conceptos clave relacionados con este indic
FREE
Waves Sizer
Flavio Javier Jarabeck
3.86 (7)
Wyckoff fans, enjoy! Ideally to be used with the Weis Waves indicator, but it can be easily used alone, the Waves Sizer puts the range (in resulting Price movement) done by the Price on its market swings. You can control how accurate or loose will be the swings. This tool is very helpful for visually know how much the Price has traveled in your Timeframe. This way you can confront this level of effort with the resulting Volume, etc... Weis Waves indicator: https://www.mql5.com/en/market/produc
FREE
Tape Reading, flow monitoring. FabFlowInPrice   is a powerful indicator for those who like Tape Reading (Times & Trades). It presents the volumes traded at each price level, considering the purchase, sale and direct aggressions for each level. Excellent tool for market flow analysis. Thought of flow so monitor who is attacking the most, buyers, sellers or direct exchanges, thought FabFlowInPrice. The indicator displays information in 4 distinct and fixed periods, on any timeframe: @Day - All t
HTF Candles Nikaは、MetaTrader 5の現在のチャートに、任意の上位時間足のローソク足をフルサイズで直接オーバーレイ表示します。チャートを切り替えることなく、マルチタイムフレームの視点を提供します。 主な機能 - 上位時間足のローソク足を、ヒゲ付きの塗りつぶし矩形として現在のチャートに描画 - 標準ローソク足とHeiken Ashiの両表示モードに対応 - 現在のHTFローソク足が閉じるまでの残り時間をリアルタイムでカウントダウン表示 - 陽線・陰線のカラーをカスタマイズ可能 - ローソク幅の自動または手動制御 - ヒゲの幅、フォント、フォントサイズ、テキスト位置オフセットを設定可能 - あらゆるシンボルと時間足の組み合わせに対応 - セッションのギャップを自動検出してレンダリングを調整 - 軽量設計 — チャートオブジェクトのみ使用、インジケーターバッファなし 入力パラメーター 表示設定 - Max Lookback — 描画するHTFバー数(デフォルト:500) - Timeframe — 表示する上位時間足(デフォルト:H1) - Bars Mode
FREE
Midas VWAP
Paulo Henrique Faquineli Garcia
4 (2)
Volume Weighted Average Price (VWAP) is a trading benchmark commonly used by Big Players that gives the average price a Symbol has traded throughout the day. It is based on both Volume and price. This indicator contains Daily VWAP and MIDAS' VWAP, which means you are able to anchor the beggining of MIDAS' calculations and, therefore you will be able to use this methodology to study price versus volume moves after anchor point. You will be able to anchor up to 3 HIGH MIDAS VWAP's and 3 LOW. Wish
FREE
Qzone
Vinutthapon Bumroong
Quantific Structure Zone is a technical indicator designed for Price Action and SMC traders. It maps the market structure and identifies dynamic supply and demand zones on the chart. Built with a non-repainting algorithm, it provides signals upon confirmed candle closes, making it suitable for live trading and backtesting. The indicator highlights market swings and price levels. Features Automated Market Structure: Identifies and labels structural swing points with HH (Higher High), HL (Higher
FREE
このプロダクトを購入した人は以下も購入しています
この製品は 2026 年の市場向けに更新され、最新の MT5 ビルドに最適化されています。 価格更新のお知らせ: Smart Trend Trading System は現在 $99 で提供されています。 次の 30 件の購入 後、価格は $199 に上がります。 特別オファー: Smart Trend Trading System を購入後、私にプライベートメッセージを送ることで、 Smart Universal EA を無料 で受け取り、Smart Trend のシグナルを自動売買に変えることができます。 Smart Trend Trading System は、リペイントなし、再描画なし、遅延なしの完全なトレーディングシステムです。よりクリーンなシグナル、より明確なトレンド方向、そしてより整理された取引方法を求めるトレーダー向けに作られています。   [User Manual]   ,  [PDF]  ,   [Installation manual]   and  [Online course] このシステムは、トレンド検出、反転ゾーン、Smart Cloud、トレーリングス
Trend Sniper X
Sarvarbek Abduvoxobov
5 (10)
Trend Sniper X は、MetaTrader 5 用のマルチタイムフレーム・トレンドフォロー・インジケーターです。トレーダーがトレンドの方向性と反転ポイントを明確かつ正確に特定できるよう支援します。 価格情報: 現在の価格はキャンペーン価格であり、今後のアップデートや新機能のリリースに伴い変更される可能性があります。 Code2Profit チャンネル マルチタイムフレーム分析で市場をマスターしよう! 技術仕様 プラットフォーム MetaTrader 5 インジケータータイプ マルチタイムフレーム・トレンドインジケーター 操作タイムフレーム あらゆるチャートタイムフレームに対応。個別に選択可能な上位タイムフレーム (M1–MN1) を搭載 主要銘柄 FX、ゴールド (XAUUSD)、およびその他のCFD 推奨口座 あらゆる口座タイプに対応 視覚化 色分けされたトレンドローソク足 (買い/売り/弱気/変化) + 買い/売り矢印 追加モジュール セッション市場ボックス (シドニー、東京、ロンドン、ニューヨーク) 主な機能 マルチタイムフレーム・トレンド分析: 上位タイムフレームの
Welcome to ENTRY IN THE ZONE AND SMC MULTI TIMEFRAME Entry In The Zone and SMC Multi Timeframe is a real-time market analysis tool based on Smart Money Concepts (SMC), designed to analyze market structure, price direction, and key trading zones. It supports both Single-Timeframe Analysis and Multi-Timeframe Analysis, providing a clearer view of the overall market structure across multiple timeframes, with real-time BUY / SELL signals that do not repaint. It is designed to help filter trading opp
時折、私自身もこのシステムを使って取引を行っています。 実口座での私の手動による「BOMBER」トレードをぜひご評価ください - LIVE SIGNAL このインジケーターを購入された方には、以下の特典を 無料 で提供しています: 各トレードを自動で管理し、ストップロスとテイクプロフィットを設定し、戦略ルールに基づいてポジションを決済する補助ツール 「Bomber Utility」 様々な銘柄に合わせたインジケーターの設定ファイル(セットファイル) 「最小リスク」、「バランスリスク」、「待機戦略」 の3つのモードで使用できる Bomber Utility 用の設定ファイル このトレーディング戦略をすぐに導入・設定・開始できる ステップバイステップのビデオマニュアル ご注意: 上記の特典を受け取るには、MQL5のプライベートメッセージシステムを通じて販売者にご連絡ください。 オリジナルのカスタムインジケーター 「Divergence Bomber(ダイバージェンス・ボンバー)」 をご紹介します。これは、MACDのダイバージェンス(乖離)戦略に基づいた 「オールインワン」型のトレーディン
Neuro Poseidon is a new indicator by Daria Rezueva. It combines precise trading signals with adaptive TP/SL levels - creating best possible trades as a result! Message me and get  Neuro Poseidon Assistant  as a gift to automize your trading process! What makes it stand out? 1. Proven profitability on all assets and timeframes 2. Only confirmed BUY and SELL signals present on the chart 3. Adaptive TP & SL levels generated by the software for each trade 4. Easy to understand - suitable for al
伝説が帰ってきました:Entry Points Pro 10。 MQL5 Marketのトップ3に3年間入り続けた伝説的インジケーターの再始動です。 2つのバージョンで合計589件の高評価レビュー、毎日数千人のトレーダーが実際のトレードに使用し、デモのダウンロードは31,000件以上   MT4+MT5 。 私はこの5年間に寄せられたレビューをすべて読み、約束を並べる代わりに、その答えをバージョン10に組み込みました。1999年から相場に携わり、 誠実さ、自らの評判、そして顧客を大切にする 作者による製品です。 Entry Points Proのエントリーシグナルは、リペイント(再描画)を一切行いません。 そして今回初めて、これは作者の言葉ではなく検証可能な事実になりました。確定シグナルはローソク足の終値確定後にのみ表示され、自動テストで リペイントはゼロ と確認されています(EURUSD、XAUUSD、BTCUSDで2,486,568回の不変条件チェック、違反0件)。検証方法は公開されており、ストラテジーテスターでご自身で再現できます。 ご購入後は、必ずすぐにダイレクトメッセージでご
SUPERHEROインジケーターは、「オールインワン」方式に基づいて設計された多通貨対応の取引システムです。このインジケーターは市場を独自に分析し、取引の開始および終了のタイミングに関するシグナルを提供します。ストップロス注文とテイクプロフィット注文を使用します。R:R比率は1:1です。 私は時折、このシステムのシグナルに基づいて自ら取引を行いますが、その結果は以下の通りです— ライブシグナル このシステムはスマートフォンにプッシュ通知を送信できるため、PCに縛られることなく「外出先」からでも取引を行うことができます。自己勘定取引を行う企業に最適です。 すべてのお客様への特典: このインジケーターをご購入いただいたすべてのお客様に、私から特別なユーティリティをプレゼントいたします。その内容は以下の通りです: 自動的にストップロス注文とテイクプロフィット注文を発注します 価格が目標水準に達すると、自動的に取引を決済します 指値注文による取引に対応しています 平均化取引モードに対応しています この優れた、しかも非常に便利なユーティリティをプレゼントとして受け取りたい場合は、SUPERHER
UZFX {SSS} スキャルピング・スマートシグナル v4.0 MT5は、変動の激しい市場において正確かつリアルタイムのシグナルを求めるスキャルパー、デイトレーダー、スイングトレーダー向けに設計された、リペイントのない高性能な取引インジケーターです。(UZFX-LABS)によって開発されたこのインジケーターは、価格行動分析、トレンド確認、スマートフィルタリングを組み合わせることで、すべての通貨ペアおよび時間軸において、高確率の売買シグナル、警告シグナル、トレンド継続の機会を生成します。 トレードの判断に迷うのはもうやめましょう。明確さ、正確さ、そして規律ある市場執行を求めるトレーダーのために設計された、体系的なシグナルシステムに従い始めましょう。 私のおすすめ* 最適な時間足:15分足以上。 {H1} が私のお気に入りです。そして、その成果は驚異的です…!! 主な機能の更新 • 自動売買シグナル検出 • 高度な反転認識ロジック • 市場反転の可能性に先立つ早期警告シグナル • トレンド継続確認シグナル • エントリー、ストップロス、TP1、TP2、TP3レベルを備えた組み込み型
M1 SNIPER は使いやすいトレーディングインジケーターシステムです。M1時間足向けに設計された矢印インジケーターです。M1時間足でのスキャルピングのためのスタンドアロンシステムとして、また既存のトレーディングシステムの一部としても使用できます。このトレーディングシステムはM1時間足での取引に特化して設計されていますが、他の時間足でも使用できます。元々、この手法はXAUUSDとBTCUSDの取引用に設計しましたが、他の市場においても役立つと考えています。 インジケーターのシグナルは、トレンドの方向と逆方向に取引できます。インジケーターのシグナルを利用して両方向に取引するのに役立つ特別な取引テクニックをご紹介します。この手法は、特別な動的なサポートとレジスタンスの価格帯を利用することに基づいています。 ご購入後、M1 SNIPER矢印インジケーターをすぐにダウンロードできます。さらに、M1 SNIPERツールのすべてのユーザーに、以下のスクリーンショットに表示されているApollo Dynamic SRインジケーターを無料で提供しています。この2つのインジケーターを組み合わせることで
この製品は 2026 年の市場向けに更新され、最新の MT5 ビルドに最適化されています。 価格更新のお知らせ: Atomic Analyst は現在 $99 で提供されています。 次の 30 件の購入 後、価格は $199 に上がります。 特別オファー: Atomic Analyst を購入後、私にプライベートメッセージを送ることで、 Smart Universal EA を無料 で受け取り、Atomic Analyst のシグナルを自動売買に変えることができます。 Atomic Analyst は、リペイントなし、再描画なし、遅延なしの Price Action トレーディングインジケーターで、手動取引、シグナルの明確化、EA 自動化のために設計されています。 User manual: settings, inputs and strategy.   &   User Manual PDF . 価格行動、強さ、モメンタム、マルチタイムフレーム方向、高度なフィルターを分析し、トレーダーがノイズを減らし、弱いセットアップを避け、より構造化された取引判断を行えるようにします。 このイ
SR Liquidity は、市場の流動性が集中し、価格が最も強く反応する「隠れたゾーン」を可視化するために設計されたトレーディング指標です。こうした流動性の高いエリアは強力なサポート(支持)およびレジスタンス(抵抗)レベルとして機能し、市場が反転する可能性が最も高いポイントを明確に示してくれます。 単なる一般的なサポートラインやレジスタンスラインを描画するのではなく、「SR Liquidity」は実際の価格変動を分析し、売りと買いの圧力が集中するゾーンを特定します。これらは、市場の真の動きを牽引する「流動性のプール(溜まり場)」そのものです。それらをチャート上に直接可視化することで、価格が実際に反応する前に、その動きを予測することが可能になります。つまり、このインジケーターは価格の方向性が変わる可能性を予測するのです。生のプライスアクションを、市場の重要な水準(転換点となり得るポイント)を示す、明確で実用的なロードマップへと変換してくれます。 このインジケーターは、FX、株価指数、貴金属、仮想通貨など、あらゆる銘柄や時間足で使用可能です。 ご購入後、取引手順や無料の優れた追加インジケ
Power Candles V3 - 自己最適化型強弱インジケーター Power Candles V3は 、通貨や銘柄の強さを、適用されたすべてのチャート上で実行可能なトレードプランに変換します。単にローソク足を色分けするだけでなく、バックグラウンドでリアルタイムの自動最適化を実行し、目の前の銘柄に対して最適なストップロス、テイクプロフィット、およびシグナルの閾値を提示します。ワンクリックで実取引に適用でき、エントリーポイント、ストップロス、テイクプロフィットのラインが正確な価格位置にチャート上に表示され、方向性を示すアラートがリアルタイムで発動します。 このツールは、Stein Investmentsのエコシステムの一部です。  18種類以上のツールをすべて閲覧し、AIを活用したセットアップの推奨事項を入手し、  https://stein.investments でコミュニティに参加しましょう クローズしたバーごとに3,000回以上のトレードシミュレーション。9つの強さの状態。2つの戦略を並行してテスト。勝率の高い設定をワンクリックで適用。 なぜこれが必要なのか ほとんどの強
M1 Quantum MT5
Hamed Dehgani
4.27 (11)
M1 Quantum を使用したライブトレードシグナル : シグナル (取引は 自動的に Quantum Trade Assistant によって実行され、この製品に 無料 で含まれています。) 最新ニュース: バージョン1.64がリリースされました。現在、すべての取引で、関連するサポート/レジスタンスゾーンの後ろにStop Lossが設定されます。今回のバージョンでは、EAのパフォーマンスを向上させるためにSmart Close機能も改善されました。 8月9日から、ライブシグナルはバージョン1.64で稼働しています。 価格プラン: 現在価格: $169 (早期購入者向けオファー) 次回予定価格: $189 予定小売価格: $299 開発者からのお知らせ: ご購入後、 最新の推奨設定ファイル(Set File) 、運用アドバイス、および他の M1 Quantum ユーザーと交流できる VIPサポートグループ への招待をご希望の場合は、お気軽にご連絡ください。 よくある質問 - 設定ファイル - インストールガイド M1 Quantum は、M1専用のプロフェッショナルトレーディング
この製品は 2026 年の市場向けに更新され、最新の MT5 ビルドに最適化されています。 価格更新のお知らせ: Smart Price Action Concepts は現在 $200 で提供されています。 次の 30 件の購入 後、価格は $299 に上がります。 特別オファー: 購入後、私にプライベートメッセージを送ることで、 無料ボーナス + ギフト を受け取ることができます。 まず、このトレーディングツールはリペイントなし、再描画なし、遅延なしのインジケーターであり、プロフェッショナルな取引に最適であることを強調しておきます。 [Online course] ,   [User Manual]  ,  [How to Install]  ,   [PDF] Smart Price Action Concepts Indicator は、初心者から経験豊富なトレーダーまで使える非常に強力なツールです。20 種類以上の便利なインジケーターを 1 つにまとめ、Inner Circle Trader Analysis や Smart Money Concepts Trading S
AXIOM MATRIX MT5 ローンチ価格:$99 Axiom Matrix はローンチ価格 $99 でご利用いただけます。 最初の30件の購入後、価格は $199 に上がります。 ご購入後、手順のご案内と限定ギフトボーナスの受け取りのために、直接DMをお送りください。 Axiom Matrix は、MetaTrader 5 用のプロフェッショナルなマルチシンボル・マルチタイムフレーム市場スキャナー兼意思決定ダッシュボードです。 Market Watch をスキャンし、複数の時間足を分析し、複数のエビデンスエンジンを読み取り、最も強いチャンスを比較し、1つのクリーンなマトリックスダッシュボード内で最適な BUY、SELL、WAIT、またはブロック状態を表示します。 私が Axiom Matrix を作った理由は、市場スキャンという重い作業を代わりに行ってくれる1つのツールが欲しかったからです。 RSI だけを確認したくありませんでした。 次に MACD だけ。 次に移動平均線。 次に出来高。 次にボラティリティ。 次にサポートとレジスタンス。 そして、1つのトレードアイデアを作るた
BTMM State Engine Pro by G-Labs — Beat The Market Maker indicator for MetaTrader 5. Asian session range, London and New York kill zones, level progression (L1/L2/L3), peak formation detection (PFH/PFL), entry signals, and a multi-pair scanner from one chart. Stop scanning charts one pair at a time. The State Engine tracks the BTMM daily cycle automatically — Asian box, room boundaries, level blocks, peak formations, and filtered entries — while the scanner dashboard shows level, peak status, d
The Oracle Pro
Ottaviano De Cicco
5 (1)
The Oracle Pro:MT5向け合成マルチタイムフレーム・バイアスエンジン ️ サマー・ローンチ・オファー — The Oracle Pro を 199 USD で(早期購入者向け)。価格は普及に応じて上昇します。最終価格 399 USD。 The Oracle Pro は、要求の高いプロのトレーダーのために作られた MetaTrader 5 向けのプレミアム・マルチタイムフレーム バイアスエンジン です。ひとつの問いに規律をもって答えます。すなわち、各タイムフレームの現在の方向バイアスは何か、その強さはどれほどか、そしてタイムフレーム同士はどれだけ一致しているか。すべては確定足のみで計算され、リペイントはありません。 The Oracle Pro はマルチファクター・コンセンサス・システムです。独自のインジケーターと最適化されたアルゴリズムを単一の高度なコンセンサス・ベクトルに統合し、それを単一のインジケーター・インスタンス内で現在足と上位足のスタックにわたって読み取ります。複数のチャートにばらばらのツールを積み重ねる代わりに、です。 これは Oracle コンセンサス手法
通貨強さウィザードは、取引を成功させるためのオールインワン ソリューションを提供する非常に強力な指標です。このインジケーターは、複数の時間枠のすべての通貨のデータを使用して、このまたはその外国為替ペアのパワーを計算します。このデータは、使いやすい通貨インデックスと通貨パワーラインの形式で表され、特定の通貨のパワーを確認するために使用できます。 必要なのは、取引したいチャートにインジケーターを接続することだけです。インジケーターは、取引する通貨の実際の強さを示します。このインジケーターは、トレンドに合わせて取引するときに有利に利用できる売買高の圧力の極値も示します。このインジケーターには、フィボナッチに基づく可能なターゲットも表示されます。 このインジケーターは、PUSH 通知を含むあらゆるタイプのアラートを提供します。 購入後ご連絡下さい。私の取引のヒントをあなたと共有し、素晴らしいボーナスインジケーターを無料で提供します! 幸せで有益な取引をお祈りします。
Quantum TrendPulse を ご紹介します。これは、   SuperTrend   、   RSI   、および Stochastic のパワーを 1 つの包括的なインジケーターに組み合わせて、取引の可能性を最大限に引き出す究極の取引ツールです。精度と効率を求めるトレーダー向けに設計されたこのインジケーターは、市場のトレンド、勢いの変化、最適なエントリー ポイントとエグジット ポイントを自信を持って特定するのに役立ちます。 主な特徴: SuperTrend 統合: 現在の市場動向に簡単に追従し、収益性の波に乗ることができます。 RSI精度: 買われすぎと売られすぎのレベルを検出し、市場の反転のタイミングに最適で、SuperTrendのフィルターとして使用されます。 確率的精度: 確率的振動を活用して、変動の激しい市場で隠れたチャンスを見つけます。SuperTrend のフィルターとして使用されます。 マルチタイムフレーム分析:   M5 から H1 または H4 まで、さまざまなタイムフレームで市場を常に把握します。 カスタマイズ可能なアラート: カスタム取引条件が満たされ
Bill Williams Advanced is designed for automatic chart analysis using Bill Williams' "Profitunity" system. The indicator analyzes four timeframes at once. Manual (Be sure to read before purchasing) Advantages 1. Analyzes the chart using Bill Williams' "Profitunity" system. Signals are displayed in a table in the corner of the screen and on the price chart. 2. Finds all known AO and AC signals, as well as zone signals. Equipped with a trend filter based on the Alligator. 3. Finds "Divergence Bar
現在33%オフ 初心者にもエキスパートトレーダーにも最適なソリューション このインジケーターは独自の機能と新しい公式を多数内蔵しており、ユニークで高品質かつ手頃な取引ツールです。このアップデートでは、2つの時間枠ゾーンを表示できるようになります。より長いTFだけでなく、チャートTFとより長いTF(ネストゾーンを表示)の両方を表示できます。すべてのSupply Demandトレーダーの皆さんのお気に召すはずです。:) 重要情報の公開 Advanced Supply Demandの可能性を最大化するには、 https://www.mql5.com/ja/blogs/post/720245 にアクセスしてください。   エントリーまたはターゲットの正確なトリガーポイントを正確に特定できれば取引がどのように改善されるか想像してみてください。新しい基盤となるアルゴリズムに基づいて構築されているため、買い手と売り手の間の潜在的な不均衡をさらに簡単に特定できます。これは、最も強い需要と供給のゾーンと、過去のパフォーマンス(古いゾーンを表示)がグラフィカルに表現されるためです。これらの機能は、最適な
ARICoin is a powerful trading companion designed to generate high-probability entry signals with dynamic TP/SL/DP levels based on volatility. Built-in performance tracking shows win/loss stats, PP1/PP2 hits, and success rates all updated live. Key Features: Buy/Sell signals with adaptive volatility bands Real-time TP/SL/DP levels based on ATR Built-in MA Filter with optional ATR/StdDev volatility Performance stats panel (Success, Profit/Loss, PP1/PP2) Alerts via popup, sound, push, or email Cust
Azimuth Pro
Ottaviano De Cicco
5 (7)
Azimuth Pro V2:MT5向けシンセティック・フラクタル構造分析と確認済みエントリー 概要 Azimuth Pro は Merkava Labs によるマルチレベルスイング構造インジケーターです。4つのネストされたスイングレイヤー、スイングアンカーVWAP、ABCパターン検出、3タイムフレーム構造フィルタリング、そして確定バーでの確認済みエントリー — 1つのチャートで、ミクロスイングからマクロサイクルまでを網羅するワークフロー。 これはブラインドシグナル製品ではありません。ロケーション、コンテキスト、タイミングを重視するトレーダーのための構造ファーストワークフローです。 ️ サマーセール — 夏至とThe Oracle Proの発売を記念して、Azimuth Proが30%オフ。現在279 USD(通常399 USD)。期間限定の夏季オファー。 1. V2での変更点 シンセティック・マルチタイムフレームエンジン 上位タイムフレーム分析をMeridian Proと同じ独自のシンセティックアーキテクチャで一から再構築。よりクリーンなHTFコンテキスト、安定したライブ動作、
この指標は、突然の変動と市場のノイズを無視することにより、比類のない信頼性で市場動向を追跡します。これは、日中のチャートと小さな時間枠をトレンドトレードするように設計されています。その勝率は約85%です。 [ インストールガイド | 更新ガイド | トラブルシューティング | よくある質問 | すべての製品 ] 驚くほど簡単に取引できます 売られ過ぎ/買われ過ぎの状況を見つける 常にノイズのない取引をお楽しみください 日中チャートでむち打ちされるのを避ける この指標は、独自の品質とパフォーマンスを分析します 複数時間枠のダッシュボードを実装します このインディケータは、低価格帯での取引に適しています。なぜなら、平均価格の周りの市場ノイズを減らすことにより、突然の価格の急上昇や修正を無視するからです。 インディケーターは最適化をまったく必要としません 複数時間枠のダッシュボードを実装します 電子メール/サウンド/プッシュアラートを実装します インジケーターは再描画および非バックペインティングではありません この指標は、より高い時間枠で非常に長い傾向に浸透する可能性のある小さな時間枠に適
Smart Market Structure Pro by G-Labs — ICT and Smart Money Concepts toolkit with built-in multi-symbol scanner for MetaTrader 5. Break of structure, change of character, order blocks, fair value gaps, liquidity sweeps, premium and discount zones, ICT sessions, confluence scoring, AI trade ideas, and a traffic-light scanner across up to 30 pairs and four timeframes from one chart. Map SMC and ICT on the active chart while the built-in scanner monitors your full watchlist. Each cell shows BUY, S
ZAB Supply Demand MTF automatically detects institutional supply and demand zones across up to 9 timeframes and draws them directly on your chart. Based on Sam Seiden's methodology, this indicator identifies the exact zones where banks and institutions placed their orders. Why This Indicator? Unlike basic support/resistance tools, ZAB Supply Demand MTF classifies every zone by its formation pattern and merges overlapping zones from different timeframes into high-probability confluence areas. Key
SkyHammer Signal Pro Entry、SL、TP レベルを固定表示する、プロ仕様のノーリペイント・トレンドシグナルインジケーター SkyHammer Signal Pro は、明確で固定され、検証可能なシグナルを求めるトレーダー向けに設計された、構造的なトレンド・モメンタム系シグナルインジケーターです。 特に M1 と M5 などの短期時間足で最も効果を発揮します。 このインジケーターは、天井や底を予測するためのものではありません。シグナルを出す前に、確認された市場構造、トレンド方向、モメンタムの強さ、健全なボラティリティ、そしてターゲットまでの十分な値幅を確認します。 主な機能 固定シグナルメカニズム シグナルが確認されると、矢印、Entry、Stop Loss、TP1、TP2 の各レベルはチャート上に永久的に固定されます。 その後のローソク足の動きによって、シグナルが消えたり、移動したり、変更されたりすることはありません。 これにより、トレーダーは各シグナルを明確に確認でき、リアルタイム相場中にシグナルが消えるという一般的な問題を避けることができます。 完全な過去シ
Gartley Hunter Multi - An indicator for searching for harmonic patterns simultaneously on dozens of trading instruments and on all possible timeframes. Manual (Be sure to read before purchasing) | Version for MT4 Advantages 1. Patterns: Gartley, Butterfly, Shark, Crab. Bat, Alternate Bat, Deep Crab, Cypher 2. Simultaneous search for patterns on dozens of trading instruments and on all possible timeframes 3. Search for patterns of all possible sizes. From the smallest to the largest 4. All fou
ご紹介     Quantum Breakout PRO は 、ブレイクアウト ゾーンの取引方法を変革する画期的な MQL5 インジケーターです。 13年以上の取引経験を持つ経験豊富なトレーダーのチームによって開発されました。     クォンタム ブレイクアウト プロ   は、革新的でダイナミックなブレイクアウト ゾーン戦略により、あなたのトレーディングの旅を新たな高みに押し上げるように設計されています。 クォンタム ブレイクアウト インジケーターは、5 つの利益ターゲット ゾーンを備えたブレイクアウト ゾーン上のシグナル矢印と、ブレイクアウト ボックスに基づいたストップロスの提案を提供します。 初心者トレーダーにもプロのトレーダーにも適しています。 量子EAチャネル:       ここをクリック 重要!購入後、インストールマニュアルを受け取るためにプライベートメッセージを送ってください。 推奨事項: 時間枠: M15 通貨ペア: GBPJPY、EURJPY、USDJPY、NZDUSD、XAUUSD アカウントの種類: ECN、Raw、またはスプレッドが非常に低い R
M1 Arrowは、ボラティリティとボリューム分析を含む市場の自然な取引原理に基づいたインジケーターです。このインジケーターは、あらゆる時間枠と通貨ペアで使用できます。インジケーターに搭載された使いやすいパラメーター1つで、取引したい通貨ペアと時間枠に合わせてシグナルを調整できます。 買いと売りのシグナルに基づくメインアルゴリズムに加え、入力欄で選択できる複数の追加戦略も内蔵されています。これらの戦略は設定不要で、インジケーターで選択した戦略モードに基づいて自動的に設定されます。 アルゴリズムは、追加フィルターを用いたボリュームと価格波動の分析に基づいています。このインテリジェントなアルゴリズムは、2つの市場要因が1つに組み合わさった場合にのみシグナルを発します。インジケーターは一定範囲の波動を計算し、ボリューム分析を用いて波動を確認します。 ご購入後、私の取引ヒントと素晴らしいボーナスインジケーターを無料で入手するには、ご連絡ください!
作者のその他のプロダクト
Gold Burger
Gayathiri Gopalakrishnan
GOLD BURGER M1,M5,M15,M30,H1 GOLD BURGER EA FULLY BASED ON SCAN MODE. SO AFTER PURCHASE PLEASE TEXT IN PRIVATE MESSAGE FOR EA SETUP GOLD BURGER Market Edition is an Expert Advisor designed for automated trading based on price action, market structure, chart confirmation and configurable trade management. The EA provides a combination of signal analysis, market filters, level detection and risk controls. The available settings allow traders to configure the trading behaviour according to their p
Hurdles
Gayathiri Gopalakrishnan
5 (1)
HURDLES EA Refined Gold Trading for XAUUSD on M30 Built with structure. Designed for control. HURDLES EA is an automated trading system for XAUUSD on M30, created for traders who prefer a more refined and structured approach to Gold trading. The EA checks price action, market structure, Murrey Math levels, Gator Oscillator, and trade filter conditions before opening a trade.HURDLES EA Refined Gold Trading for XAUUSD on M30 OVERVIEW HURDLES EA is an automated trading system created for XAUUSD on
Prop Firm Os
Gayathiri Gopalakrishnan
5 (1)
PROP FIRM OS Structured Trading Assistant for MetaTrader 5 PROP FIRM OS is a structured trading assistant designed for MetaTrader 5 users who prefer rule-based market analysis and organized trading workflows. The Expert Advisor combines market analysis tools, scanner functions, dashboard monitoring, alerts, risk-control settings, and trade management features inside one system. PROP FIRM OS is designed to help traders follow selected rules, filters, and monitoring conditions during trading activ
Double X Trade
Gayathiri Gopalakrishnan
5 (2)
DOUBLE X TRADE  SIGNAL MULTIPLIER DOUBLE X TRADE is a MetaTrader 5 Expert Advisor designed to operate alongside existing Expert Advisors and provide additional trade-management functionality. The EA can monitor trading activity on the account and perform actions according to user-defined settings, risk parameters, and operating mode configuration. DOUBLE X TRADE is intended for traders who want an additional management layer while continuing to use their existing Expert Advisors. The product doe
Pattern Detect
Gayathiri Gopalakrishnan
"You can watch the product, too." Double X Trade Hedging Assistant XEROX MT5 Hyper Vision TRADE TODAY HURDLES NEXUS APEX TRADE MANAGER The Elite Algorithmic Pattern & Smart Money Terminal for MetaTrader 5 1. Product Overview Quantum AI - Institutional Pro   is an elite, quantitative technical analysis terminal designed to replace cluttered retail indicators with a sleek, hedge-fund-grade interface. It does not blindly alert you every time a pattern forms. Instead, it utilizes a multi-layer
FREE
Welcome to Scalper Oscillator , a MetaTrader 5 indicator created for traders who want a cleaner and more organized way to study short-term market movement. This indicator brings multiple visual elements into one workspace: oscillator pressure, bull and bear scoring, signal line, chart zones, arrows, projection area, reference SL and TP levels, and dashboard information. The goal is to help traders observe market behavior with better structure instead of reading many separate indicators one by on
FREE
Hyper Vision
Gayathiri Gopalakrishnan
Hedging Assistant MT5 Hedging Assistant MT5 is an Expert Advisor panel for MetaTrader 5. It is designed to help traders prepare and manage hedging-style trades from an on-chart dashboard. The product provides manual trade execution and trade management tools. It can be used to prepare lot size, stop loss, take profit, and pending order distance before placing trades. This tool does not guarantee profit and does not predict future market movement. The trader is responsible for checking market con
Hedging Assistant MT5 is an Expert Advisor panel designed to help traders organize hedging-based trade execution and trade management inside MetaTrader 5. The panel provides a visual dashboard where the user can prepare lot size, stop loss, take profit, and pending order distance values before placing trades. It includes instant execution, limit order workflow, stop order workflow, pending order management, break-even tools, partial close tools, and close controls. The purpose of this tool is to
FREE
Signalbridge Ai
Gayathiri Gopalakrishnan
SignalBridge AI is an Expert Advisor for MetaTrader 5 that helps traders receive Telegram trade commands, review a clear risk preview, and execute orders only after confirmation. It is designed for traders who want a simple Telegram-to-MT5 workflow with safety checks, automatic missing SL/TP preparation, and optional AI chat support. Supporting Files This product does not guarantee profit and does not replace the trader's own decision. Always test on a demo account first and use proper risk ma
FREE
Trade Copier Pro MT4/MT5 Trade Copier Pro MT4/MT5 is a professional trade copying application developed for MetaTrader users who need to synchronize trading activity between multiple accounts. The product supports trade copying between MetaTrader 4 and MetaTrader 5, allowing communication across MT4 and MT5 terminals as well as within the same platform. It can be used for MT4 to MT4, MT5 to MT5, MT4 to MT5 and MT5 to MT4 trade copying. The application is designed for traders who manage multiple
Trade Today
Gayathiri Gopalakrishnan
TRADE TODAY — Advanced Pattern Recognition Indicator for MetaTrader 5 TRADE TODAY is a chart pattern recognition indicator that detects price structures in real time, scores each signal using trend and momentum filters, and displays entry, stop-loss, and take-profit levels directly on the chart. Push notifications, email, and sound alerts are supported. How It Works The indicator scans recent price action for swing points at multiple depths and identifies the following structures: Double Top, Do
Nexus Apex System is a professional MetaTrader 5 trade assistant for visual trade planning, position sizing, risk management and multi-target analysis. It helps traders prepare trades with clear Entry, Stop Loss, Take Profit, lot size, risk amount, reward estimate and account-currency information directly on the chart. The product is designed for traders who want a structured way to review trades before execution. It provides a dashboard with trade direction, entry mode, stop-loss method, posit
Trade Copier Pro MT4/MT5 Trade Copier Pro MT4/MT5 is a professional trade copying application developed for MetaTrader users who need to synchronize trading activity between multiple accounts. The product supports trade copying between MetaTrader 4 and MetaTrader 5, allowing communication across MT4 and MT5 terminals as well as within the same platform. It can be used for MT4 to MT4, MT5 to MT5, MT4 to MT5 and MT5 to MT4 trade copying. The application is designed for traders who manage multiple
フィルタ:
レビューなし
レビューに返信