FootPrint Chart MT5
- Indicateurs
-
Gayathiri Gopalakrishnan
 I am an independent MQL5 developer focused on creating practical trading tools for MetaTrader 5.
My work includes Expert Advisors, trading indicators, analytical tools and trading utilities designed to help traders analyze the market, manage trades and automate specific trading tasks. - Version: 18.0
- Mise à jour: 30 septembre 2026
- Activations: 5
imbalance zones and a scored setup engine that prints entry, stop and target
Order Flow Footprint Chart Pro
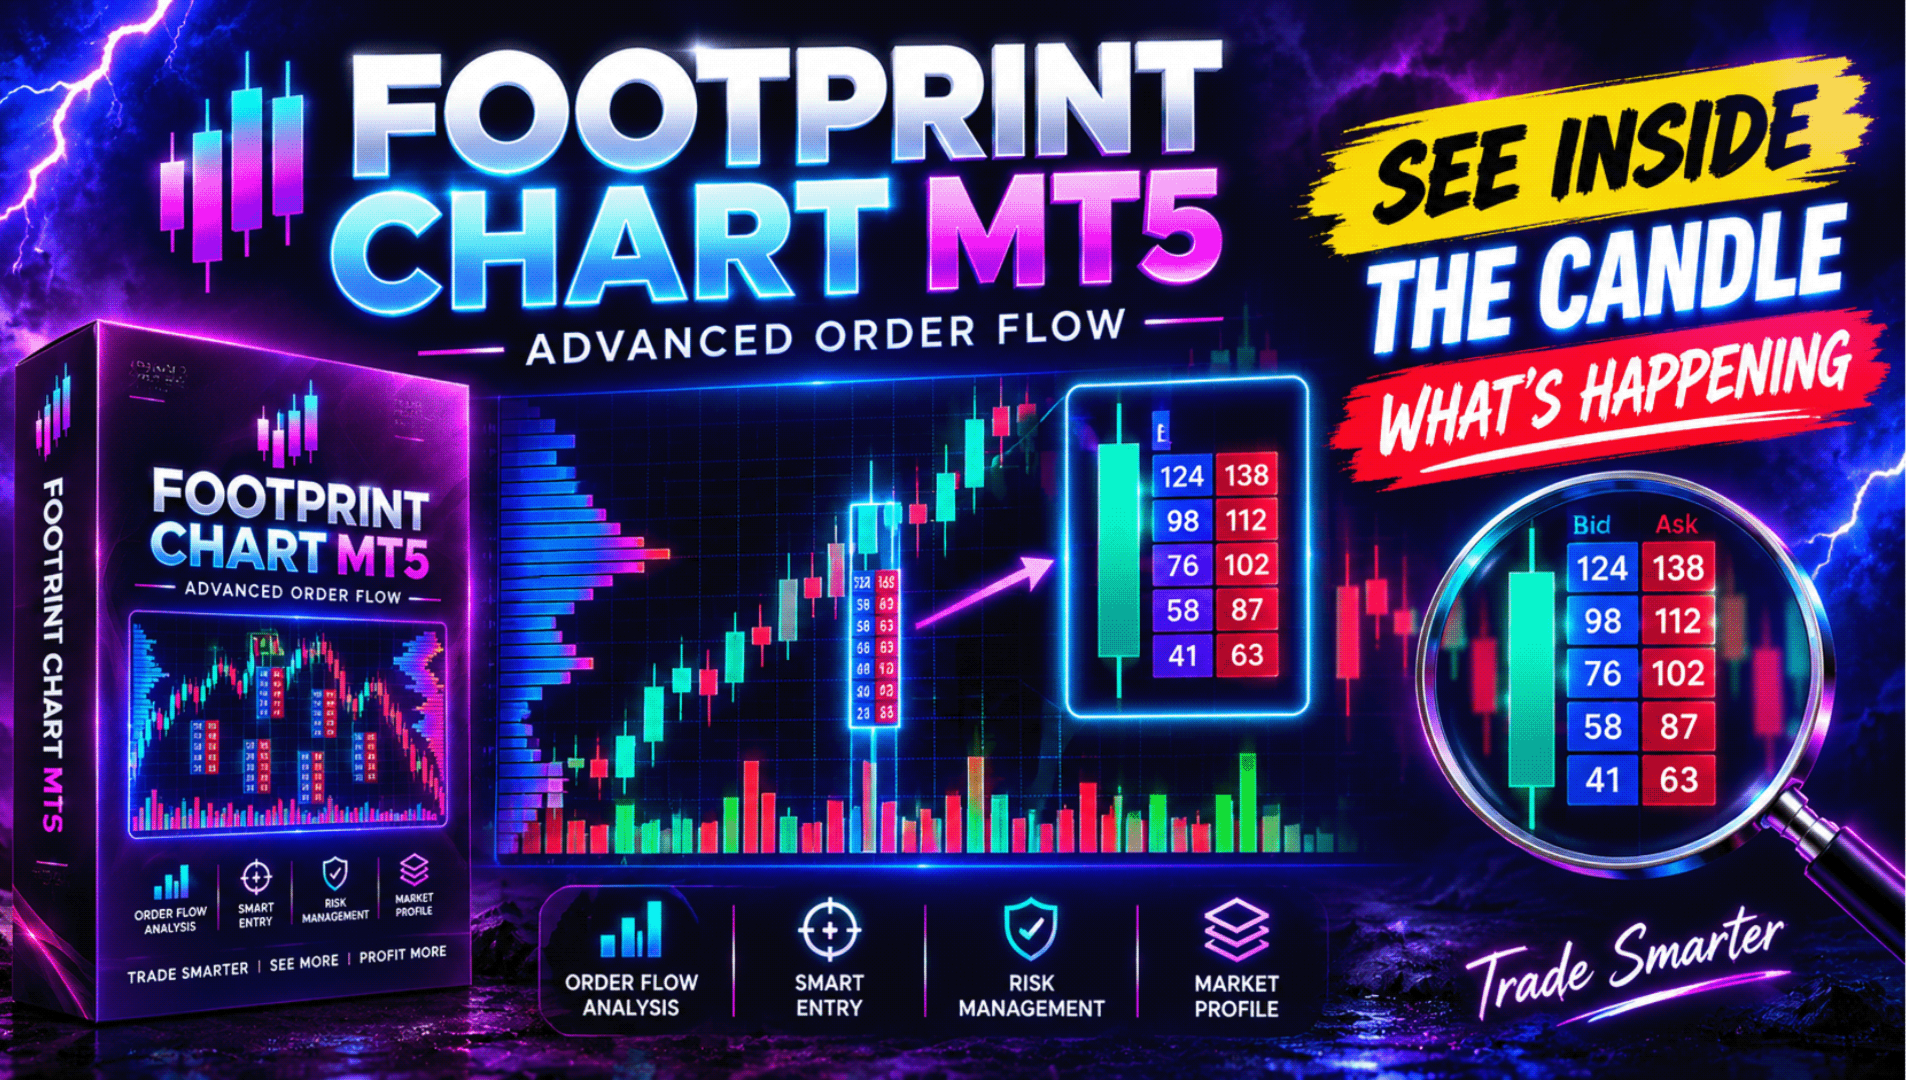
Most indicators tell you what price did. This one tells you who did it.
Order Flow Footprint Chart Pro rebuilds every candle on your chart from raw tick
data and shows you the volume that traded at each individual price inside it,
split into the amount sold at the bid and the amount bought at the ask. That
split is the footprint, and it is the closest a MetaTrader 5 chart can get to
watching the order book work.
What you see on the chart
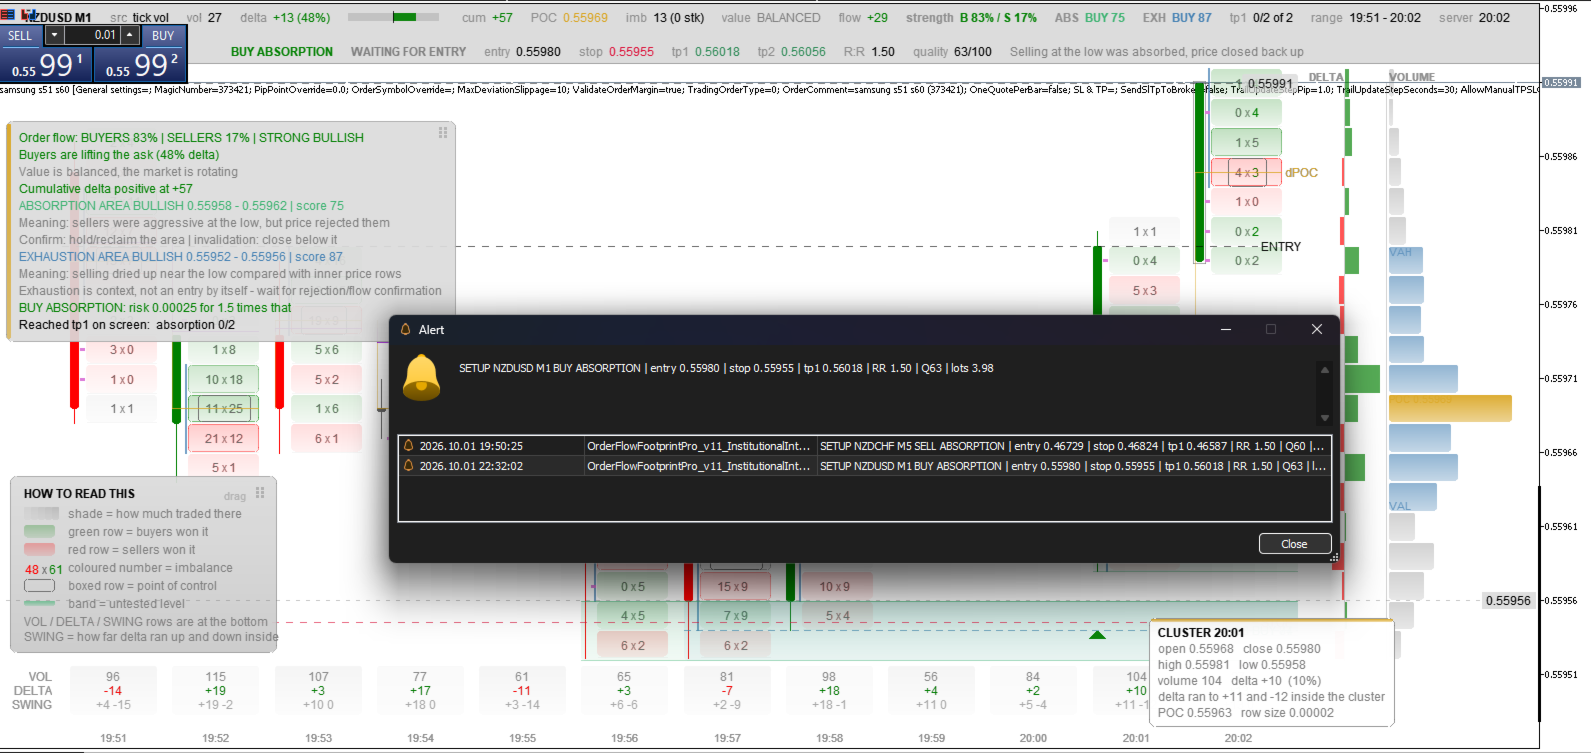
Each candle is drawn as a price bar with its footprint beside it. Every row of
that footprint is one price level, showing the bid volume on the left and the
ask volume on the right, separated so the imbalance between them is obvious at a
glance. The heaviest traded price of the candle, its point of control, is boxed.
Numbers turn red or green only where a genuine diagonal imbalance exists, so
colour on the chart always means something rather than being decoration.
Behind the footprint sits the context you need to read it. A developing point of
control path traces where value is migrating candle by candle. A volume weighted
average price line is built from actual traded volume at price rather than an
approximation from candle highs and lows. A range volume profile on the right
side shows the point of control, the value area high and low, and optionally the
high and low volume nodes across everything on screen. A delta profile beside it
shows net buying and selling at each price rather than total volume alone.
Where several imbalances stack in a row, the level is drawn as a zone that
extends to the right and stays on the chart until price trades back through it.
Untested zones remain visible, tested ones disappear automatically, so what is
left on your chart is always what still matters.
The setup engine
Reading a footprint takes practice, so the indicator also does the reading for
you and shows its work.
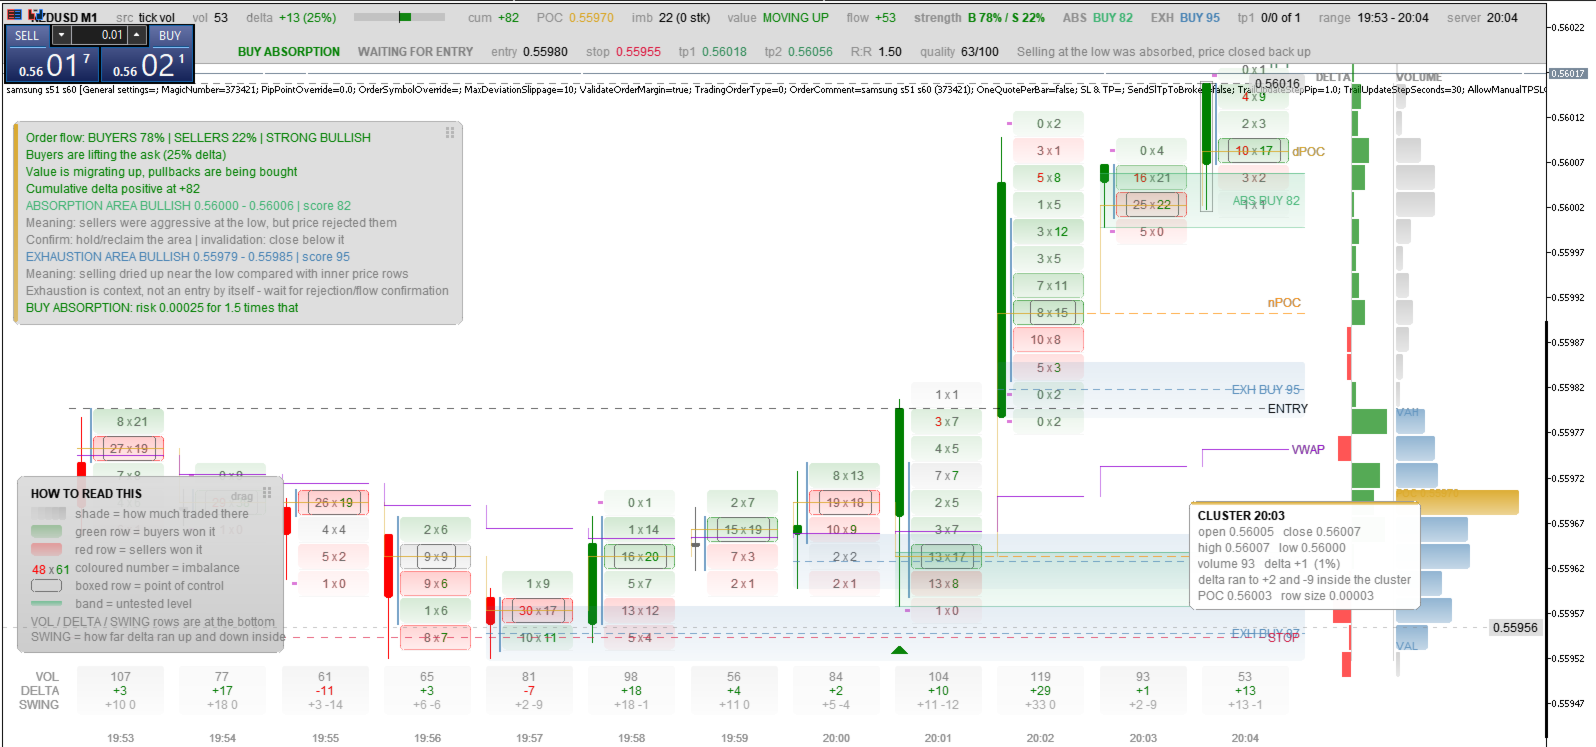
On every closed candle it looks for four situations. Absorption is heavy
aggression at a high or a low that failed and closed back inside, which is the
classic reversal read. Stacked imbalance is three or more consecutive imbalances
in one direction, which marks initiative and gives a level worth retesting.
Trapped traders is a candle that closed one way while delta went the other. Each
of these produces a direction, an entry, a stop placed beyond the signal candle
extreme with a buffer, a first target taken from the nearest high volume node or
the range point of control, a second target at the value area edge, the resulting
reward to risk ratio, and a quality score out of one hundred.
Setups are filtered before they are shown. A setup that disagrees with the
recent net flow is rejected. So is one outside your chosen session hours, one
where the spread is abnormally wide, one below your minimum reward to risk, and
one built on a candle with no tick history. When a setup is filtered out the
status bar tells you which filter removed it, so nothing happens silently.
Once a setup is live the indicator tracks it. It tells you when price reaches
the entry, and again when the stop or the target is hit. The entry line is
removed from the chart at the moment price gets there, because after that it is
no longer information. A running scorecard across the candles you have loaded
shows how many past setups reached their first target before their stop.
Alerts that reach you
Push notification to the MetaTrader mobile app, email, on screen popup and
sound. Messages carry the symbol, the setup name, entry, stop, target, reward to
risk, quality score and the calculated lot size. Notifications are queued and
paced deliberately below the MetaQuotes rate limit, so the indicator can never
get your push notifications disabled.
Alerts fire on a new setup, when price reaches the entry, when the stop or
target is hit, and optionally when price touches an untested imbalance zone.
Risk calculator
Give it the percentage of balance you are willing to risk and it returns the lot
size for that specific stop distance on that specific symbol, using the broker's
own tick value, and shows it on the chart and inside every alert. It never
places an order.
Reading the chart without training
Hover the mouse over anything and it explains itself. Over a footprint cell you
get the price, the volume sold at bid and bought at ask, the delta, what
percentage of the candle it represents, and whether it is imbalanced or part of
a stacked zone. Over a candle you get open, high, low, close, volume, delta,
point of control and row size. Over any line you get what that line is and why
it is there. A crosshair shows the exact price under the cursor.
Works at any zoom
Set it to a dozen candles and you get full footprint numbers. Widen it and it
switches automatically to a volume bar for each price row. Widen it further and
each candle becomes a delta candle whose body is coloured by who won it, so a
long history still reads as a chart rather than a smear. Merge several chart
candles into one cluster if you want hourly footprints while sitting on a
fifteen minute chart.
What you should know before buying
This indicator reads tick data, so it needs tick data. Brokers keep tick history
for a limited period, usually weeks to months. Beyond that no footprint can
exist, and rather than showing you a gap the indicator draws those candles as
faded plain candles and clearly marks them as estimated. Estimated candles never
produce imbalances, zones, setups or alerts.
On symbols that report real exchange volume the bid and ask split comes straight
from the tick flags. On forex and CFDs there is no such flag in the feed, so the
split is inferred from price direction, which is the standard method every
MetaTrader footprint uses and is an approximation rather than exchange data. The
status bar always tells you which source is in use. For this reason the
indicator is at its most useful on liquid symbols from the five minute timeframe
upward, where there are enough ticks per candle for the numbers to mean
something. It will tell you when volume per candle is too low to be useful.
This is an analysis tool. It does not open, modify or close any position, and no
result it displays is a prediction. The scorecard measures whether the levels it
printed were reached, with no spread, slippage or position sizing applied, and is
not a strategy backtest.
Setup
Attach it to a liquid symbol on M5 or higher, leave the defaults, and let the
tick history load. The status bar shows the progress. For the cleanest view use
a maximised chart window.
Full details of every setting are in the comments of the parameter list, and the
Blog and Comments sections here are the fastest way to reach me with a question.