Optimization Cluster Analzyzer
- ユーティリティ
- バージョン: 1.75
- アップデート済み: 10 9月 2026
- アクティベーション: 5

Optimization Cluster Analyzer
Stop selecting only the best pass. Find parameter regions that actually deserve validation.
An outstanding optimization result may be nothing more than an isolated peak. Optimization Cluster Analyzer — OCA transforms raw MetaTrader 5 optimization reports into a structured analysis of clusters, neighborhoods, parameter stability, recurrence and representative sets.
The objective is not simply to find the highest profit. OCA investigates whether strong results belong to a supported parameter region or represent an isolated configuration with a higher risk of overfitting.
Easy to use
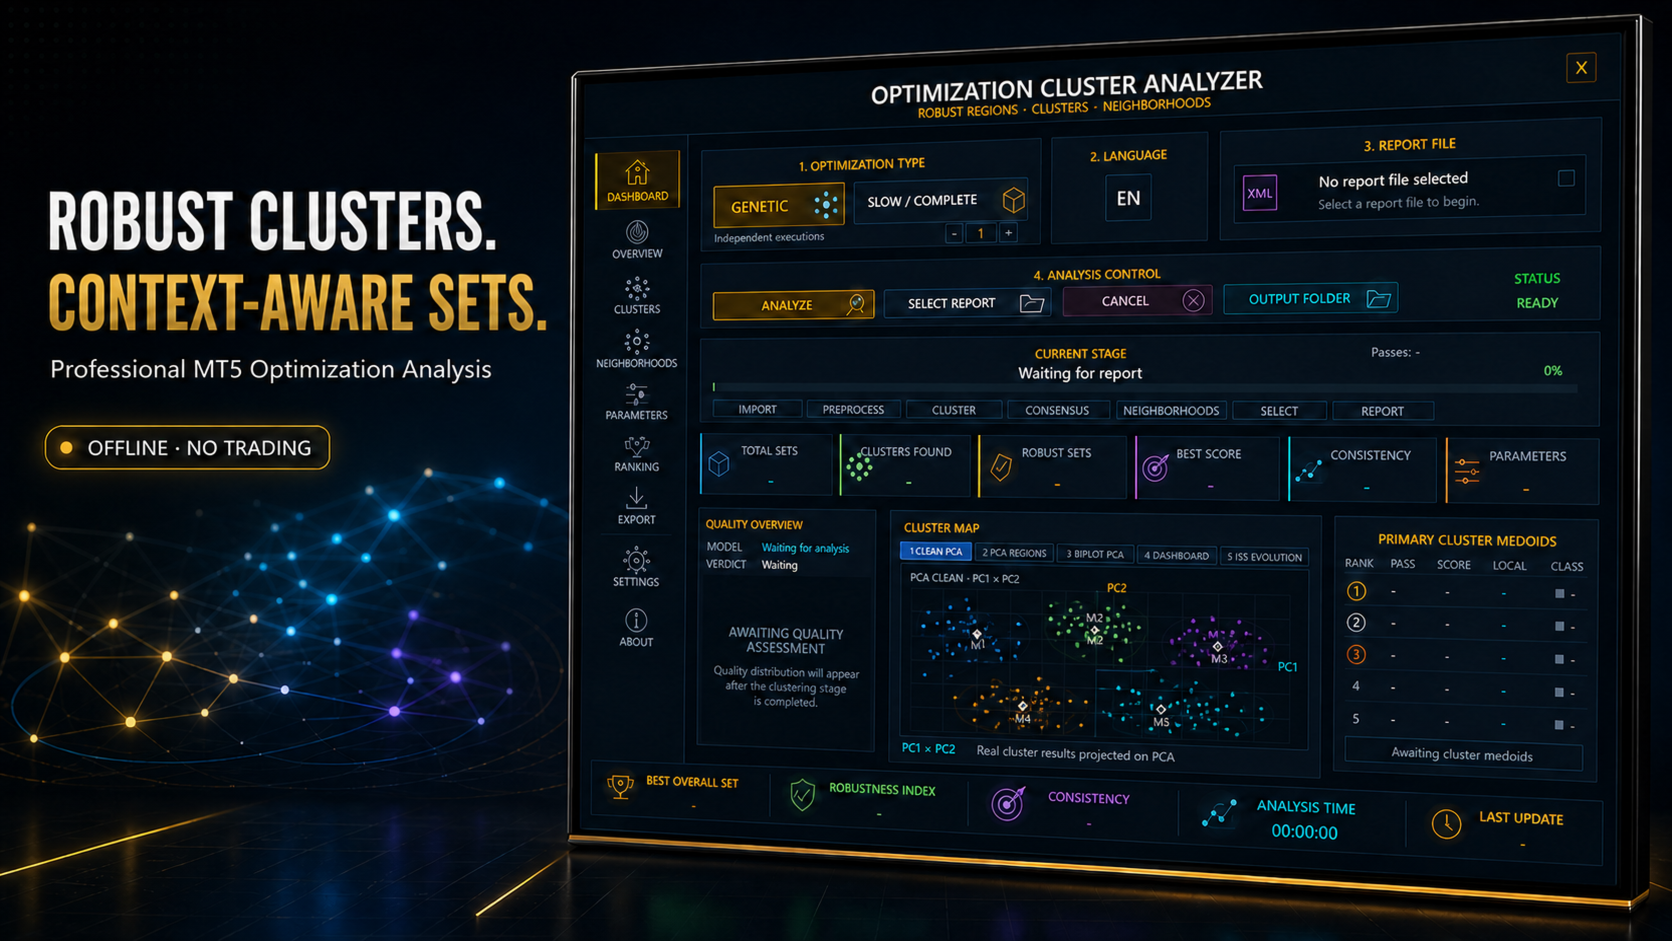
OCA runs directly inside MetaTrader 5.
Install the EX5 file, attach it to a chart and use the graphical interface to select your optimization reports.
All analysis is performed offline. OCA does not execute trades, provide trading signals or modify the strategy being analyzed.
Complete and genetic optimizations
OCA is designed to respect the differences between the main optimization surfaces.
For complete/slow optimizations, the analyzer can work with denser parameter grids and study local continuity.
For genetic optimizations, where only a fraction of the total parameter space is visited, OCA uses an approach designed for sparse and irregularly sampled surfaces.
It can also analyze multiple independent genetic runs performed over the same period.
OCA can:
- merge runs into a global optimization surface;
- remove exact parameter duplicates when required to prevent artificial geometric weighting;
- preserve the origin of independent runs;
- measure cross-run recurrence;
- evaluate regional coverage;
- detect excessive single-run dominance;
- compare local representatives with global medoids;
- analyze neighborhoods without confusing visit frequency with structural robustness.
A region repeatedly rediscovered by independent genetic searches can therefore be distinguished from one mainly supported by a single search trajectory.
Multidimensional clustering
OCA combines analytical tools including K-Medoids, K-Means, HDBSCAN, hierarchical methods, model consensus, neighborhood analysis and sparse/dense region diagnostics.
K-Medoids has an important advantage for optimization analysis: its representative is an actually observed optimization pass, rather than an artificial centroid.
The goal is not simply to create clusters, but to identify regions with enough structure to produce candidates worthy of further validation.
PCA Visual Explorer
The multidimensional structure can be explored through:
PCA Clean · PCA Regions · PCA Biplot · Dashboard · ISS Evolution
These views help inspect separation, overlap, regions, medoids, parameter contributions and evolution across windows.
PCA is used only for visualization. Clustering, medoid selection, neighborhood calculations and robustness diagnostics remain based on the original multidimensional parameter space.
Neighborhood and robustness analysis
OCA does not use cluster size alone as evidence of robustness.
It also evaluates:
- local support;
- parameter continuity;
- density;
- neighborhood stability;
- isolated peaks;
- representative quality;
- regional coverage;
- recurrence across independent runs.
This is particularly important for genetic optimization, where a region may contain many passes simply because the genetic algorithm explored it more frequently.
More points do not automatically mean greater robustness.
Representative sets and refinement
Approved regions can generate two types of files:
Fixed Set — a frozen observed candidate, normally associated with the selected medoid or representative.
Refine Set — a small parameter region around that candidate for subsequent local investigation.
The workflow can therefore progress as:
exploration → clustering → region → medoid → refinement → external validation
Refinement does not replace the original representative. It investigates whether a consistent local plateau exists around the identified region.
MetaTrader 5 Global Optimizer integration
The Export page includes:
Adapt to MetaTrader 5 Global Optimizer
When enabled, OCA organizes candidates for the workflow:
ISS → OCA → local refinement → OOS
OCA can analyze ISS results, select representatives and export fixed and refine files. In the integrated workflow, refinement grids can be validated again on the matching ISS before any new candidate is frozen and forwarded to OOS validation.
Availability at launch
When Optimization Cluster Analyzer is released, this export and adaptation option will already be available inside OCA.
However, the version of MetaTrader 5 Global Optimizer designed to automatically consume this new integration structure will not yet have been released.
That version will be published later.
OCA can therefore be used from launch as a fully independent analyzer, while automated integration with the upcoming Global Optimizer version will become available after that version is released.
Five-language interface
The complete interface is available in:
English · Português · Español · Русский · 中文
The language can be changed directly from the panel.
Reports and export
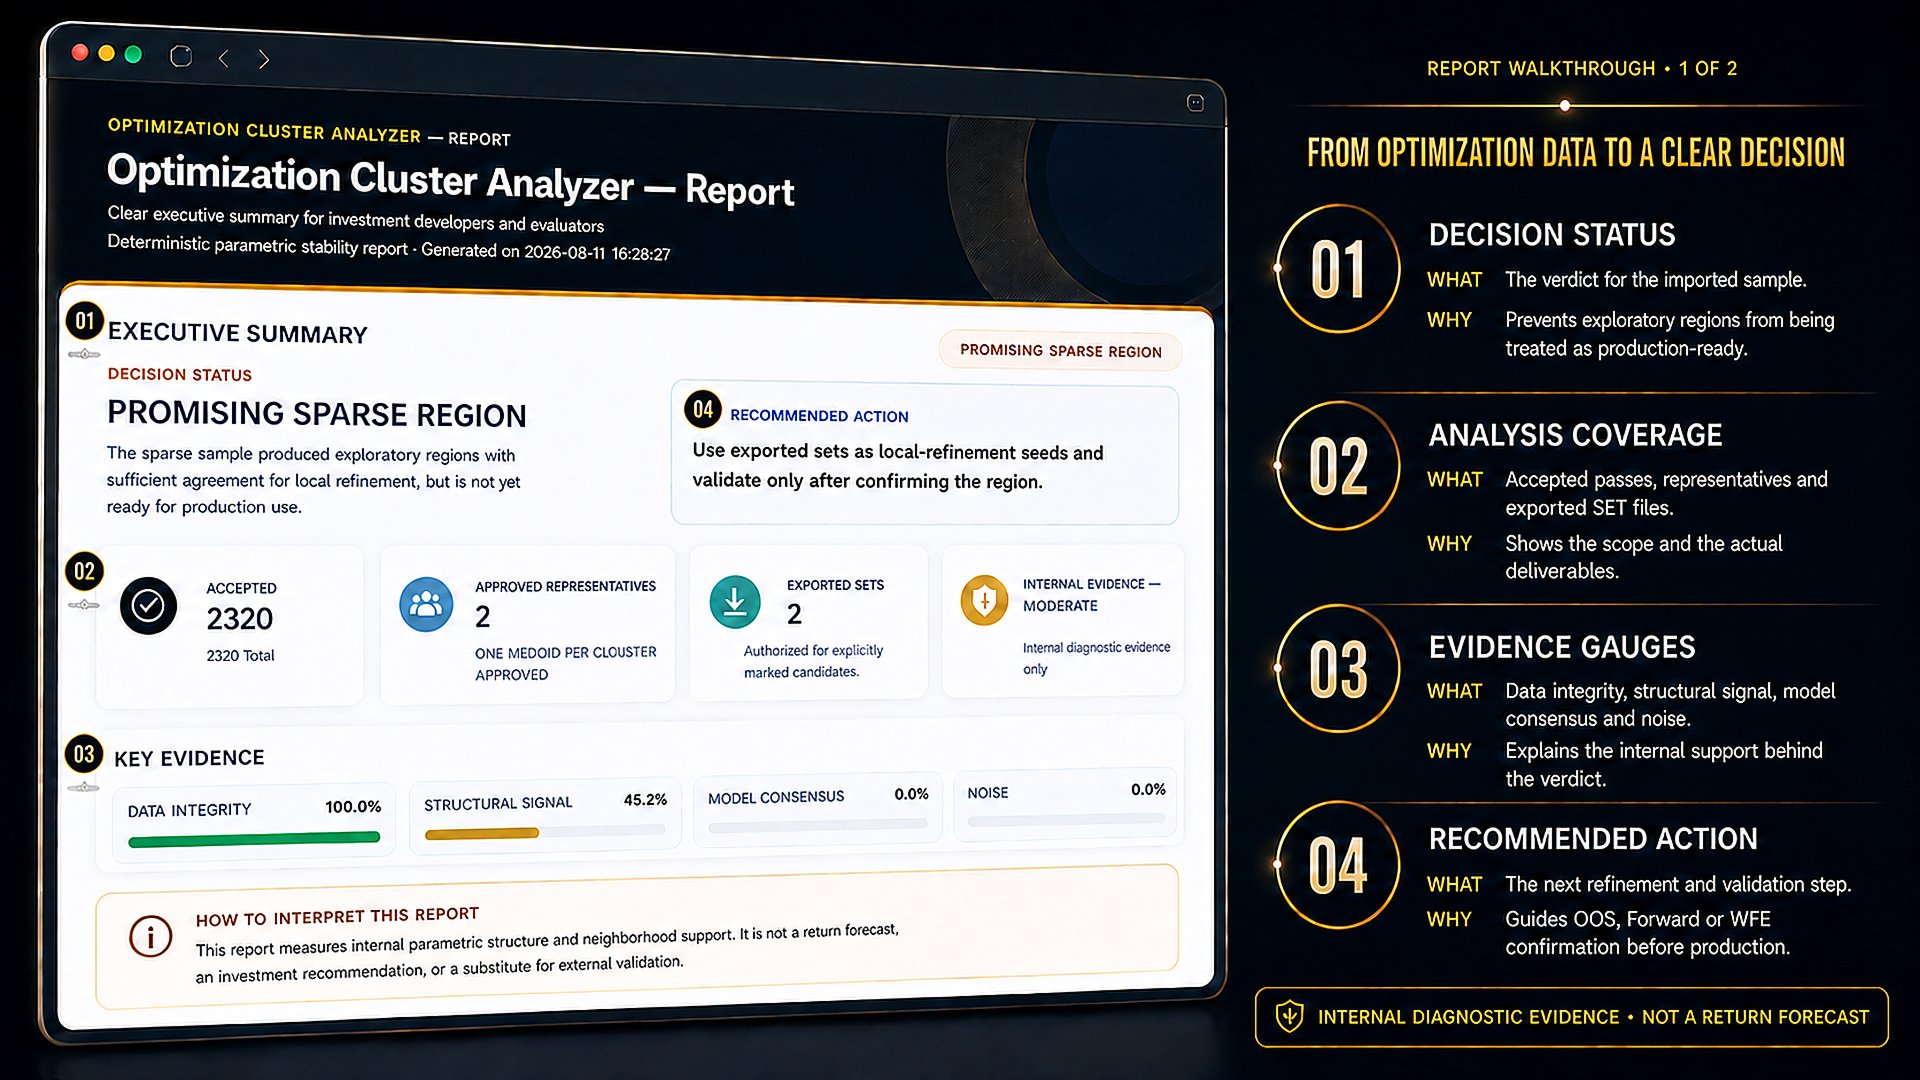
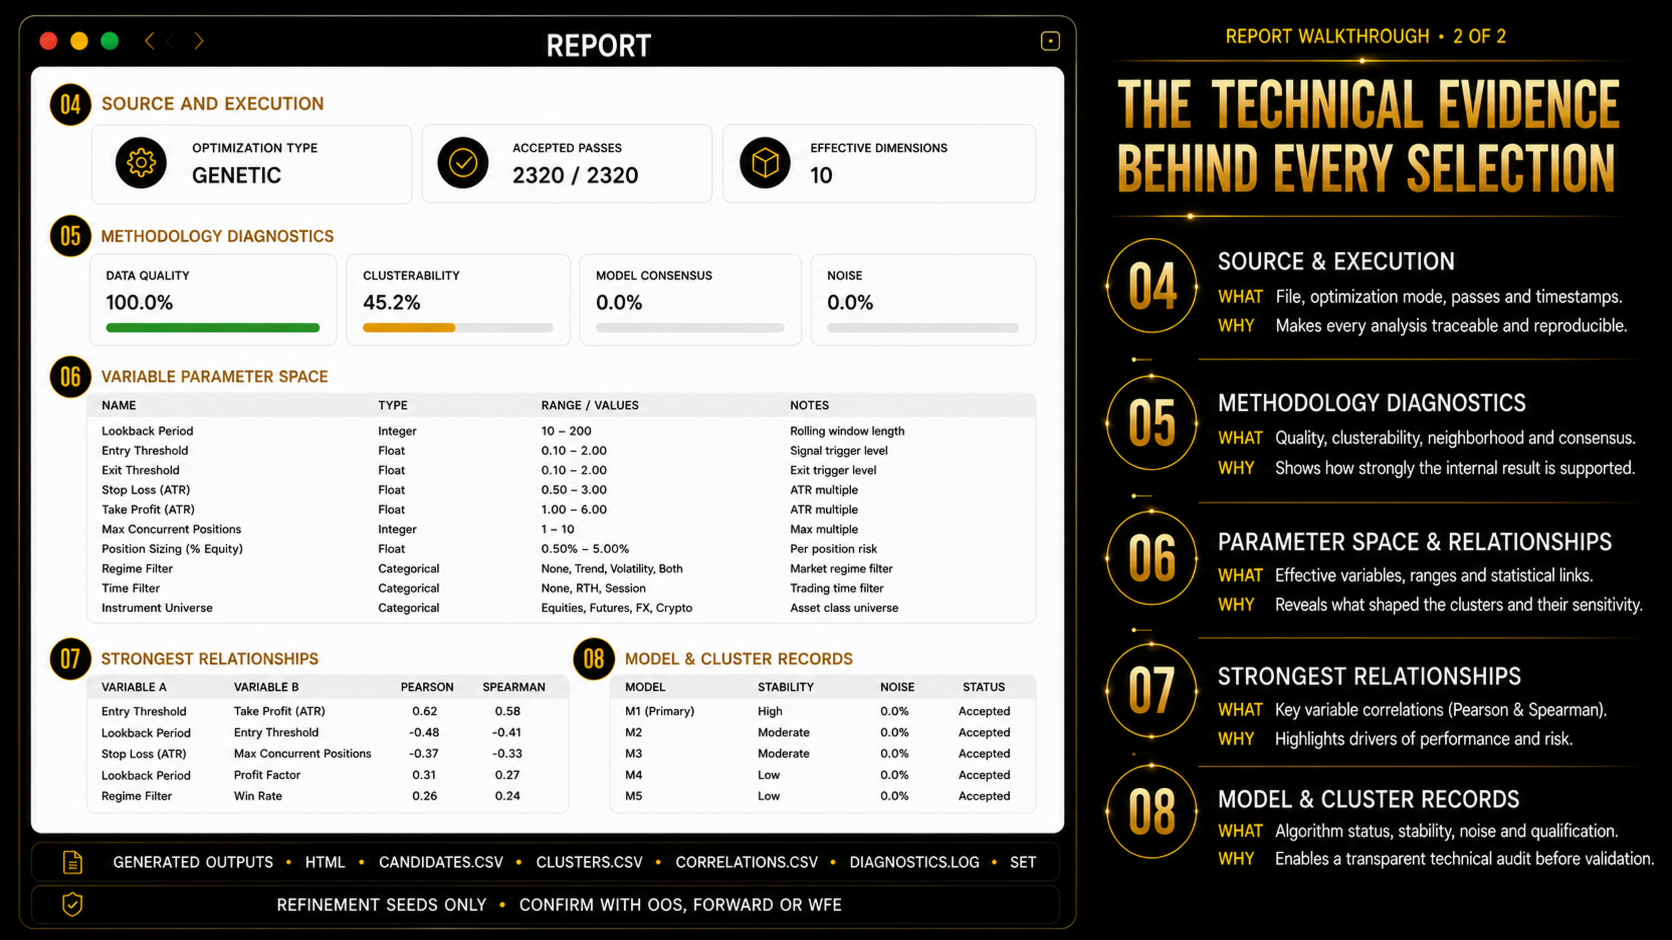
OCA provides structured information about:
- clusters;
- medoids;
- regions;
- neighborhoods;
- parameters;
- cross-run recurrence;
- stability diagnostics;
- selected representatives;
- refinement candidates;
- files prepared for subsequent validation stages.
The purpose is to transform large optimization reports into a more organized, traceable and reproducible analytical process.
Built for serious robustness analysis
OCA is designed for Expert Advisor developers, quantitative researchers and MetaTrader 5 users who want to replace subjective “best pass” selection with analysis based on parameter-space structure.
Instead of asking only:
“Which combination produced the highest result?”
OCA helps investigate:
“Is there a supported parameter region around that result?”
Important
Optimization Cluster Analyzer is an offline analytical tool.
It does not execute trades, provide trading signals or guarantee future performance.
Clustering identifies structure inside the analyzed sample. Real robustness must still be evaluated through external validation such as OOS, Forward Testing and Walk-Forward Analysis.
Launch offer
The promotional price will be available only for the first 10 purchases.
After the tenth sale, the price will be adjusted to reflect the analytical features, multilingual interface and future product updates.
Add professional cluster, neighborhood and parameter-recurrence analysis to your MetaTrader 5 development workflow.