StructureScope
- インディケータ
-
Kohei Takahashi
 MQL5 developer focused on verified, test-driven delivery.
I build MetaTrader 5 Expert Advisors, indicators and utilities with an
engineering-first workflow:
- Published on MQL5 Market — 6 products: a news-event risk utility, - バージョン: 1.0
- アクティベーション: 10
StructureScope - The chart's structure, drawn only once it is confirmed.
WHAT IT DRAWS
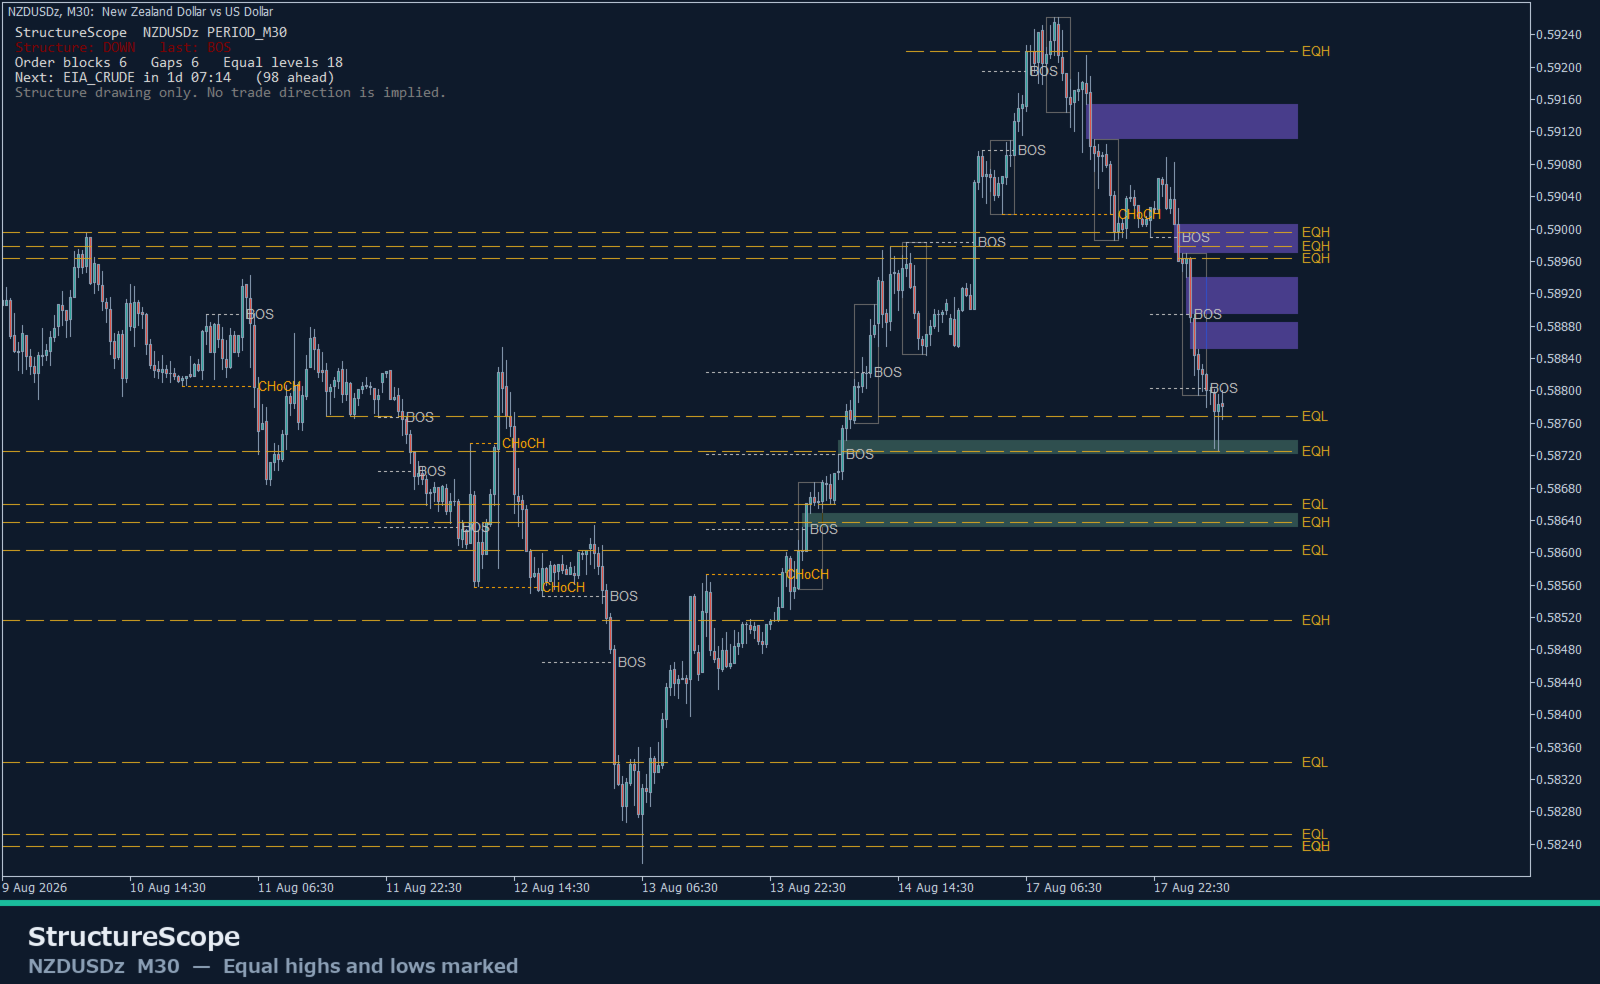
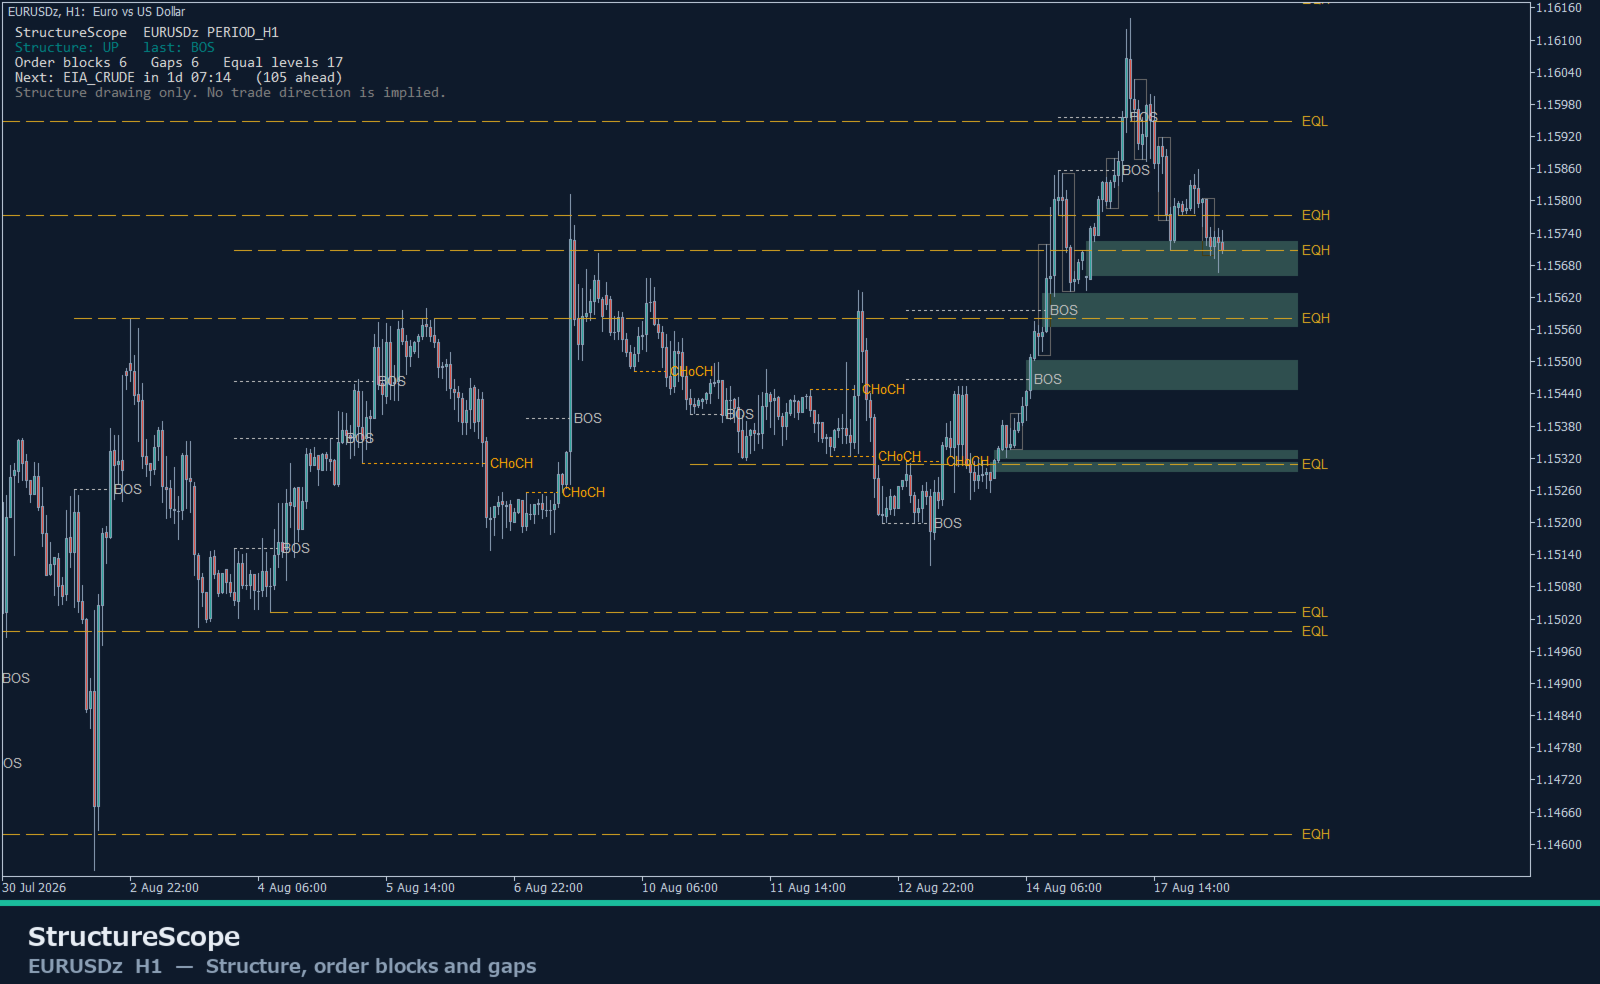
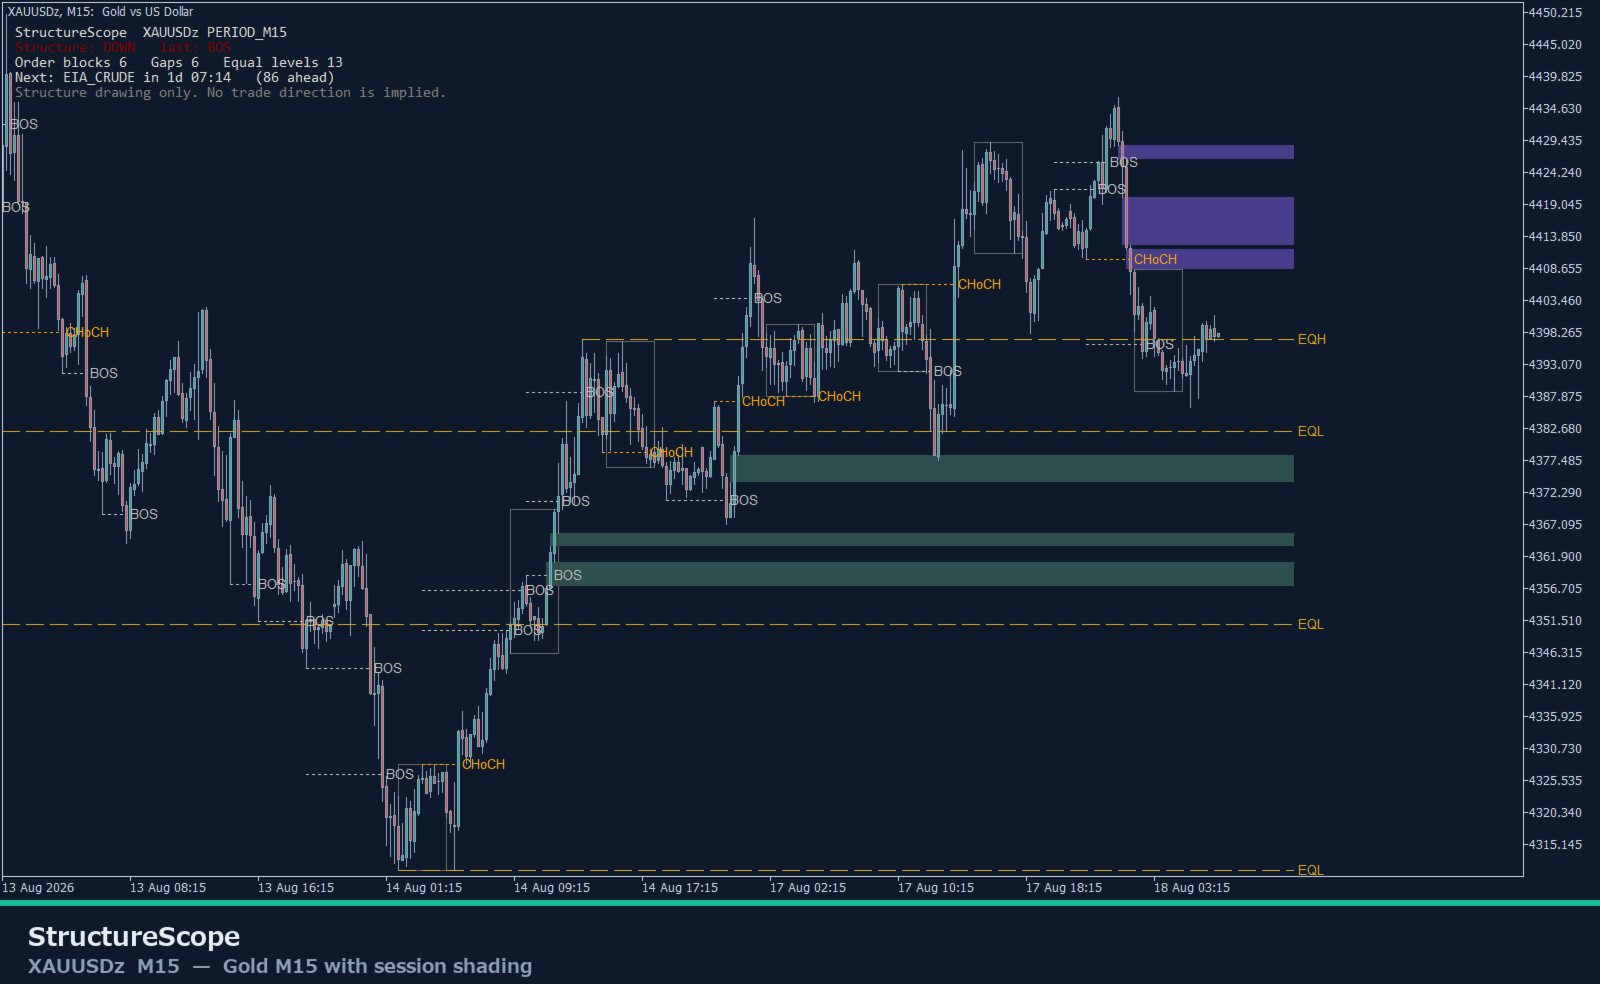
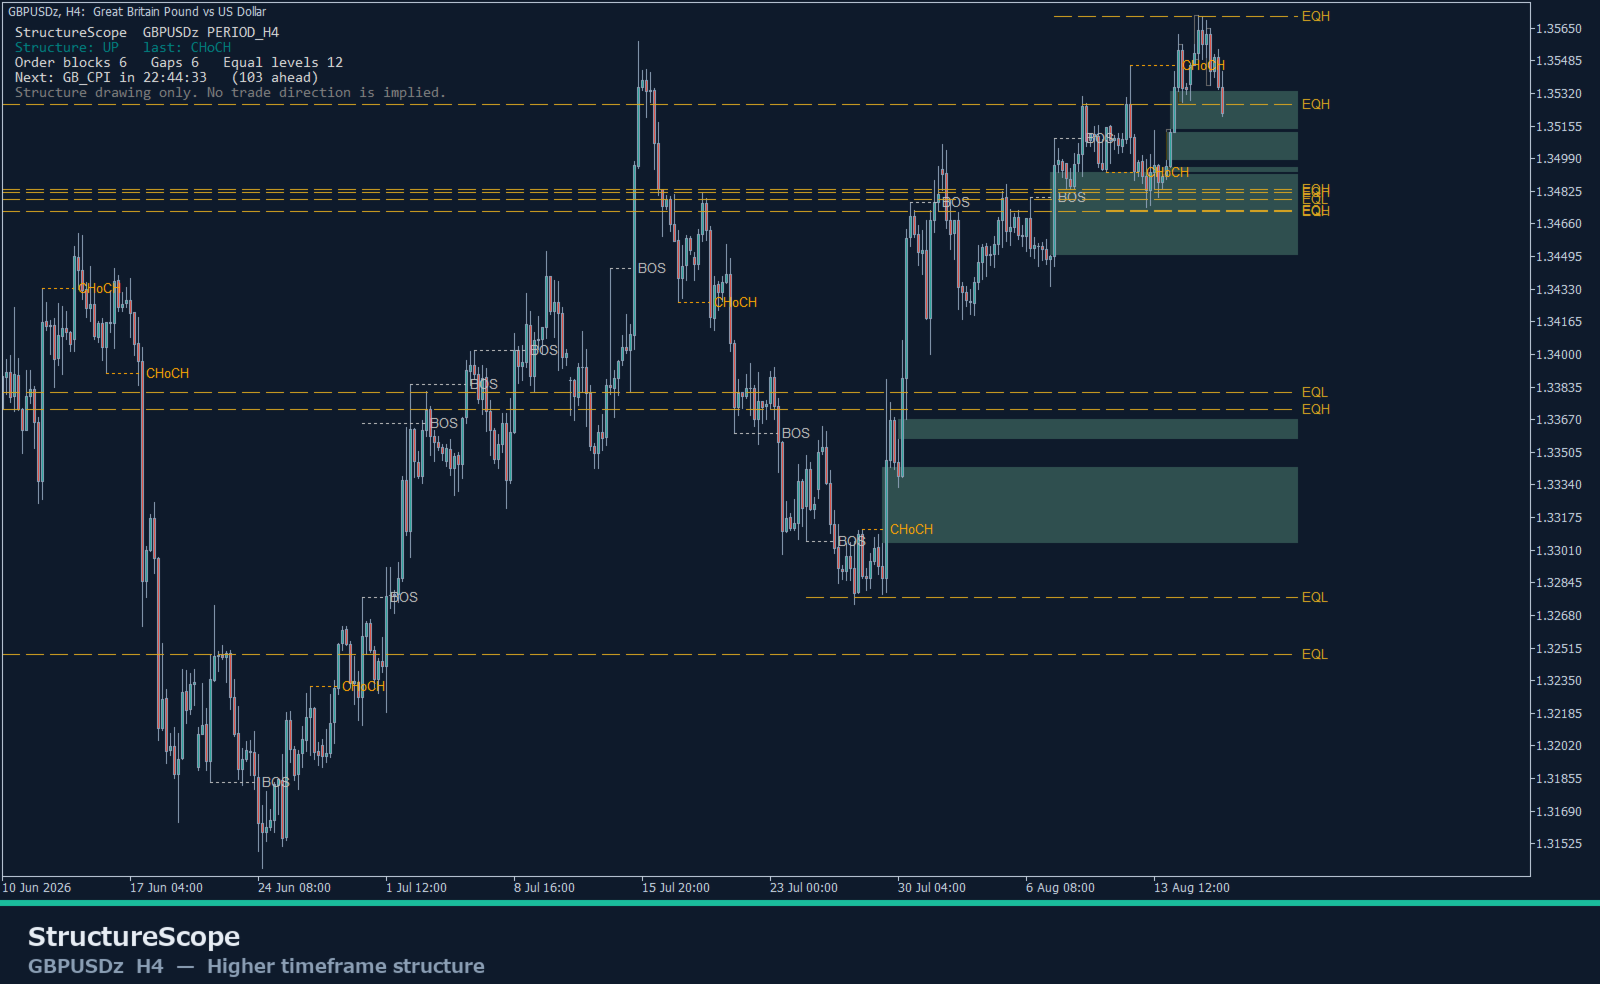
Market structure Break of Structure and Change of Character, labelled
at the level that was broken.
Order blocks The last opposing candle before the leg that broke
structure. Shaded while unmitigated, closed off once
price has traded back through it.
Fair value gaps Three-bar imbalances that have not been filled.
Filled gaps are removed rather than left as clutter.
Liquidity Equal highs and equal lows, within a tolerance you
set in ATR.
Sessions Up to three session ranges shaded per day, in server
hours so you can align them with your broker's clock.
A swing high is not a swing high until the required number of bars have
closed on BOTH sides of it. Everything above is therefore confirmed a few
bars late - and that lateness is exactly why the drawing stays put.
DOES NOT REPAINT - AND YOU CAN CHECK IT YOURSELF
Every condition is evaluated on CLOSED bars. The bar still being built is
never written to, and a value written to a closed bar is never written
again.
Attach it, let a few bars pass, then reload the chart or restart the
terminal. Nothing moves.
IT GIVES NO DIRECTION
This tool draws no arrows and never tells you to buy or sell. It reports
where price is - the zone it has reached - and leaves the decision to
you. If you want an entry rule, that is a different kind of tool.
ECONOMIC EVENT COUNTDOWN
4101 releases are built in (2005-01-07 to 2028-12-07), filtered to the
chart symbol's currencies, with the next one counted down on the panel:
FOMC, NFP, US_CPI, ECB, BOE, GB_CPI, BOJ, RBA, RBNZ, BOC, CH_CPI, EIA_CRUDE, USD_JOBLESS, US_RETAIL_SALES, AUCTION_LONG.
In live trading the terminal's Economic Calendar extends the list.
PRESETS INCLUDED
Intraday_M15 - M15 day trading. Short swings, few zones on screen.
Swing_H1 - H1 swing trading. The default starting point.
HigherTF_H4 - H4 and above. Longer swings, zones extended further right.
Clean_ZonesOnly - Order blocks and gaps only. No labels, no session shading - for a chart that is already busy.
WHAT THIS IS NOT
It is not a trading system and it does not predict anything. It is a way
to state a discretionary rule precisely enough to be measured, and then
to measure it on your own data. The statistics panel shows how the
drawing rule behaved in the past on your broker's feed; past behaviour is
not a forecast, and the numbers will differ on your symbol and settings.
Use it as one input to your own decision, with your own risk management.
REQUIREMENTS
MetaTrader 5, any symbol, any timeframe. 30 inputs. Structure state and
the nearest zone boundaries are exposed as indicator buffers for use from
an Expert Advisor. No DLL calls, no external files, no internet access.