Zones ZST indicator
- インディケータ
- バージョン: 1.14
- アクティベーション: 10

ZST Zones Indicator – Multi Timeframe Smart Zones
Subtitle
Smart price reaction zones with a multi-timeframe panel for MetaTrader 5.
Description in English
ZST Zones Indicator was created from a tool that I have personally used on my trading charts for more than 3 years. During all that time, this type of zone analysis has always been part of my charts because it helps me identify important areas where price often reacts, pulls back, takes liquidity, or makes key decisions.
This logic was originally coded and used in TradingView, where it became a very useful visual tool for my market analysis. Later, I decided to convert the idea into MetaTrader 5, creating a cleaner, more practical and professional version for traders who want to see these zones directly inside their execution platform.
The indicator detects relevant price zones and draws them directly on the chart. These zones can be used as references for entries, exits, trade management, visual confirmation, or simply as an additional analysis layer inside your own trading strategy.
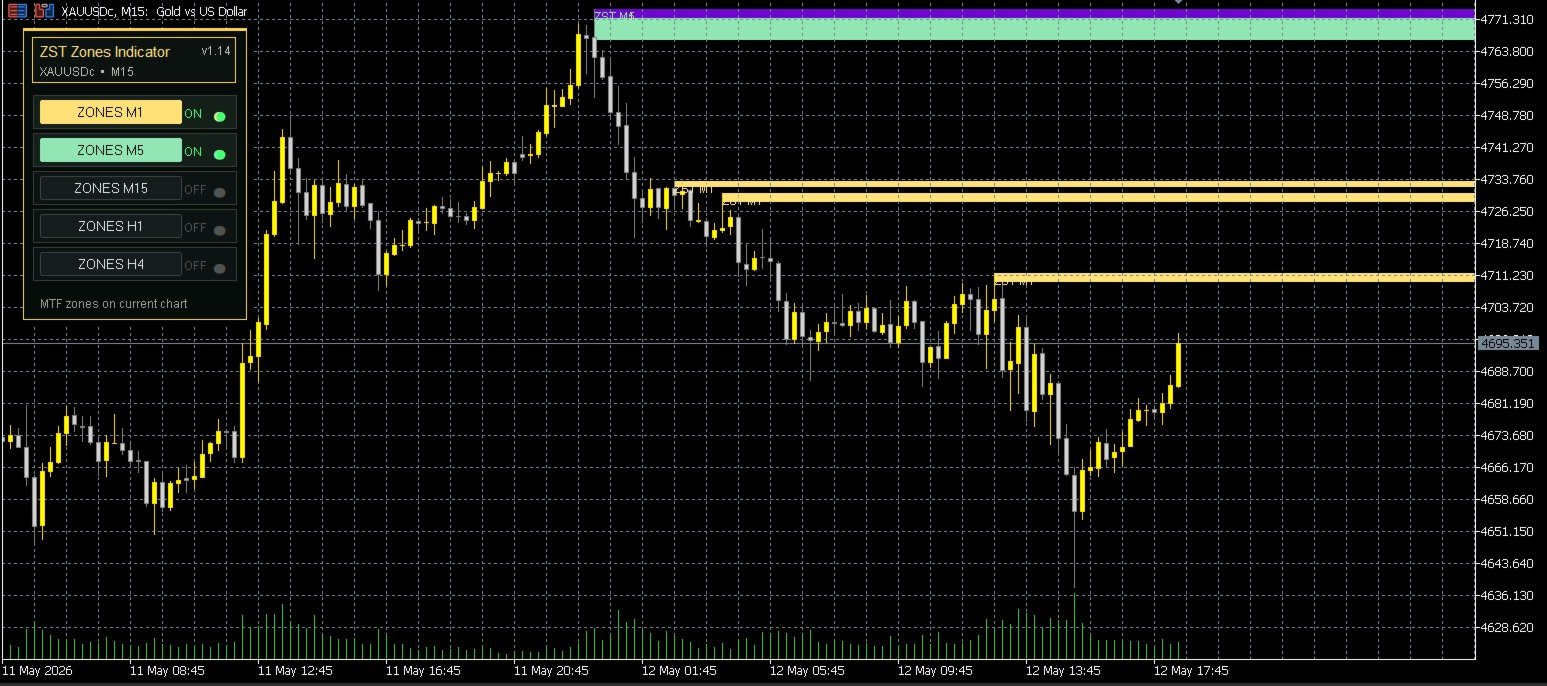
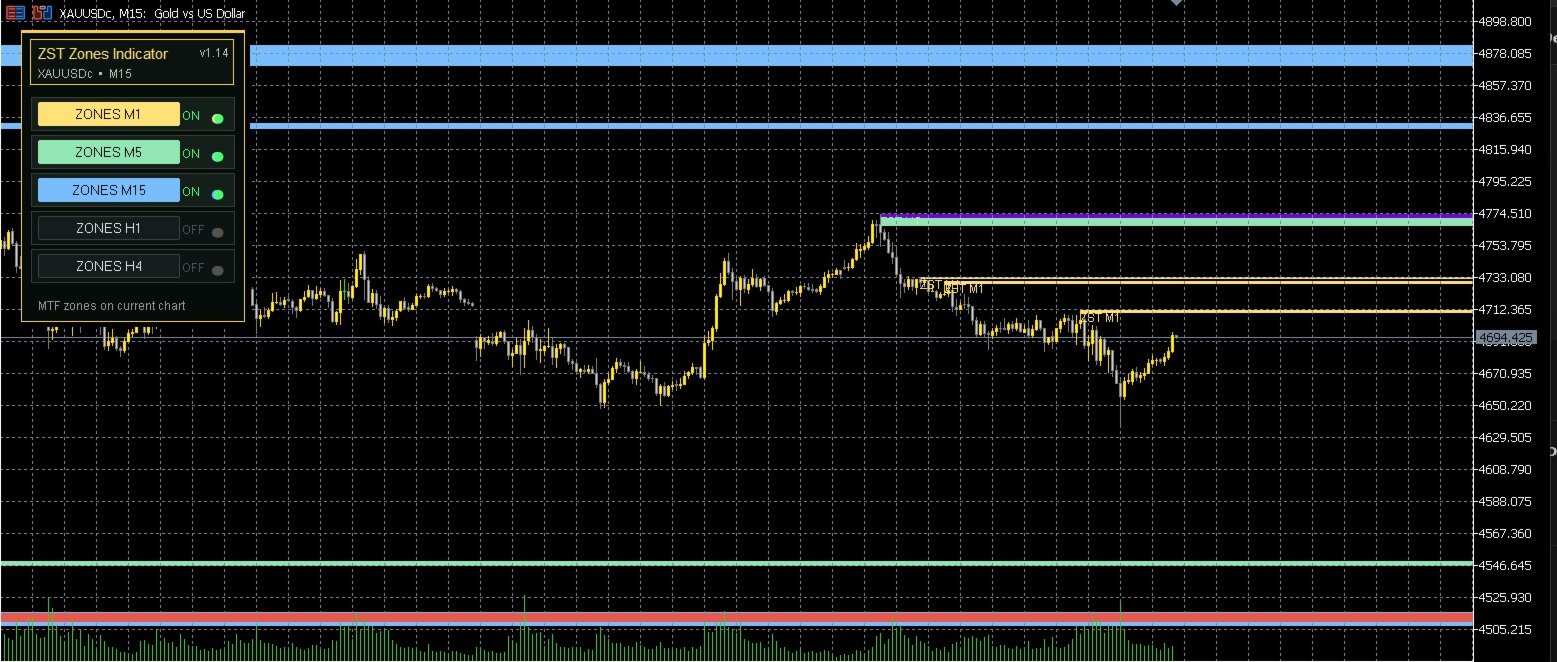
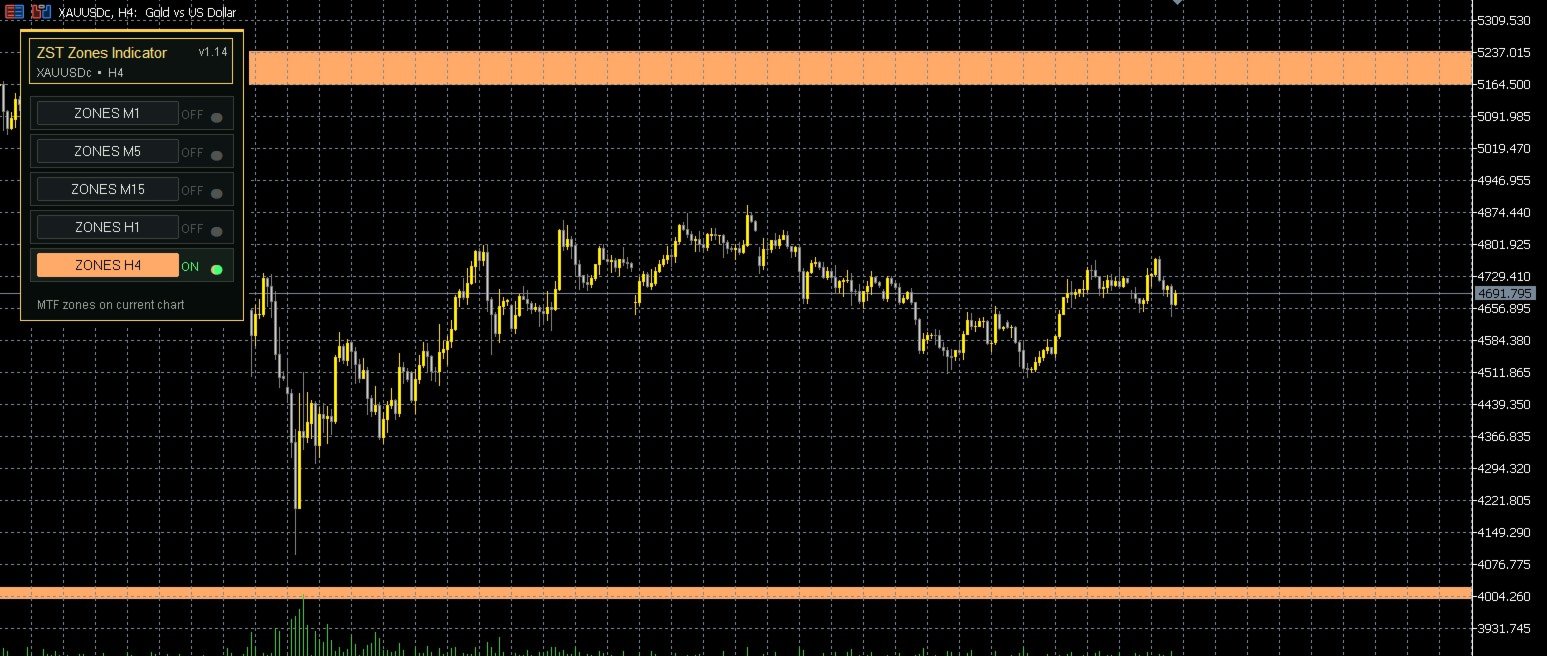
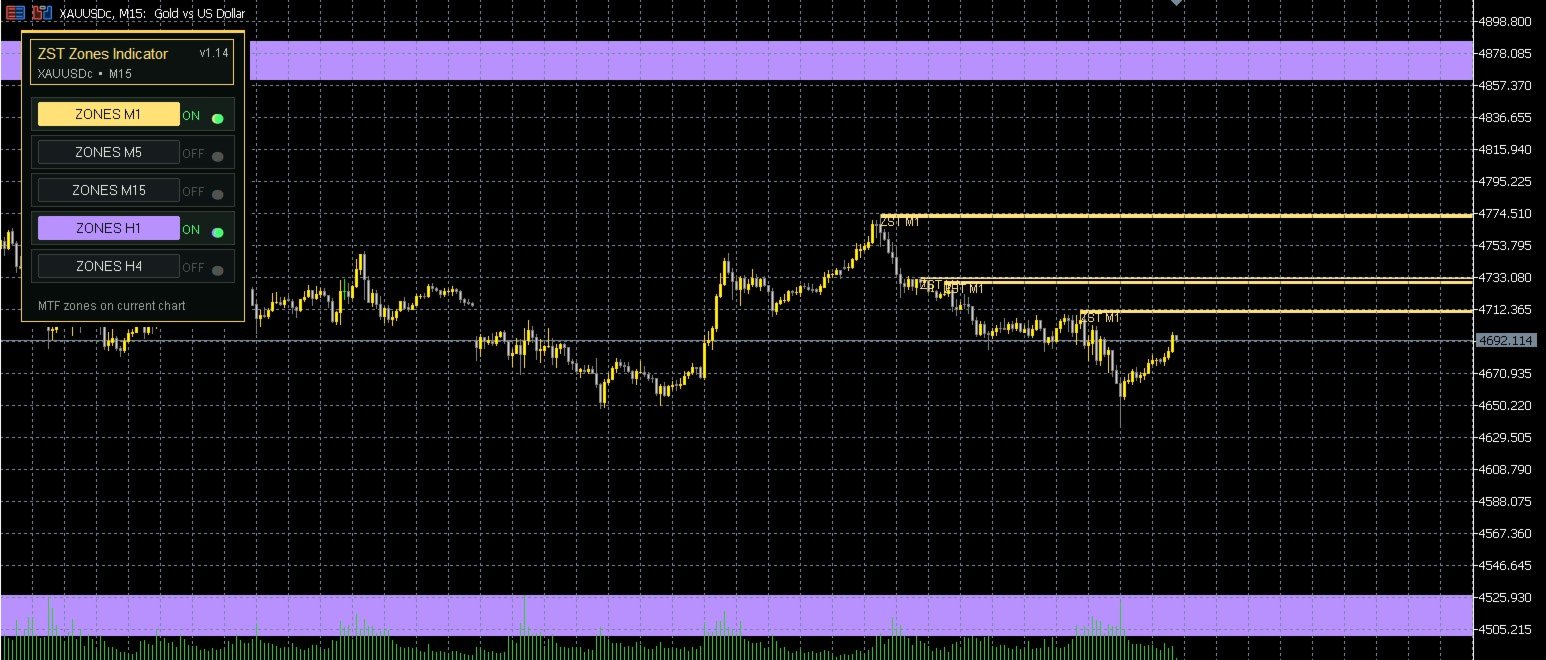
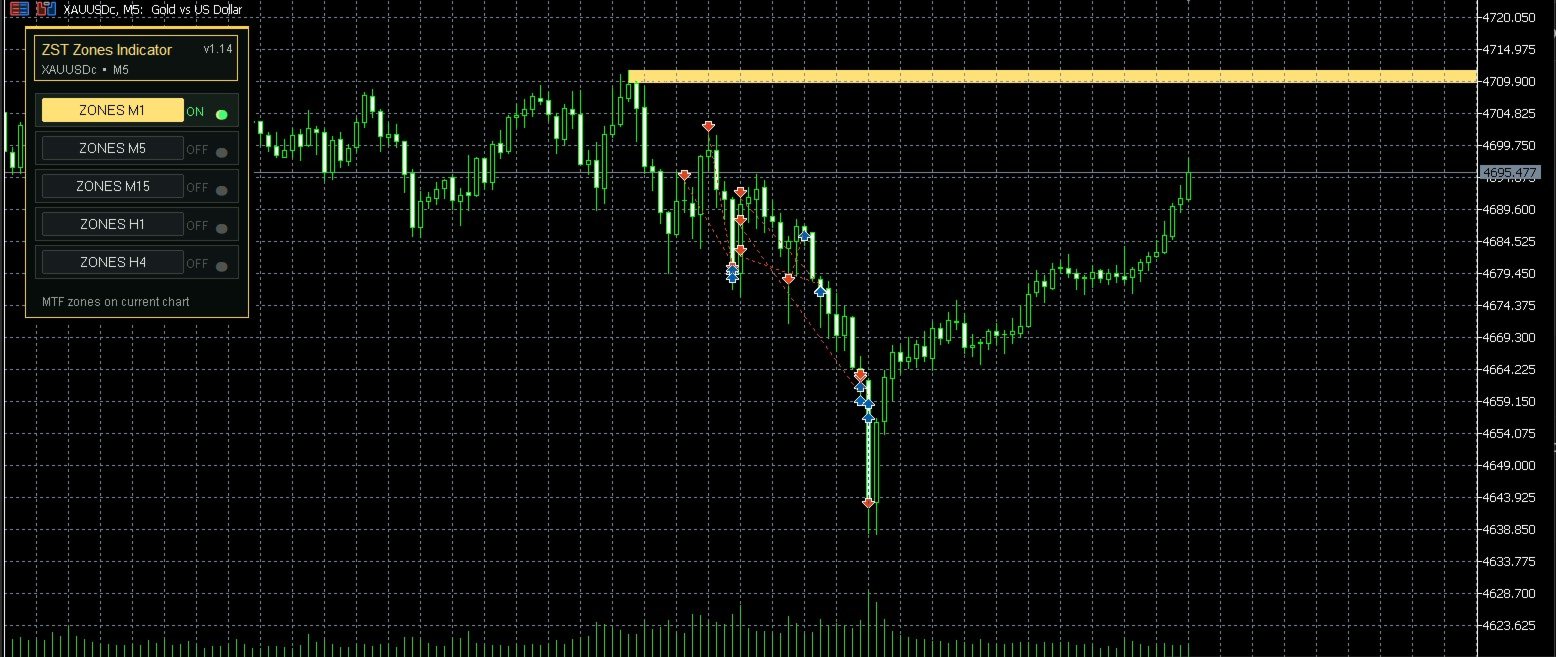
One of its key features is the multi-timeframe panel, which allows you to enable or disable zones from different timeframes without changing the current chart. For example, you can be trading on M1 and activate zones from M5, M15, H1 or H4 to see higher-timeframe levels directly on the same chart.
Each timeframe can generate different zones, and all of them can be important depending on the market context. Higher-timeframe zones may act as stronger reaction areas, while lower-timeframe zones can help you refine entries or manage more precise movements.
The indicator also visually separates fresh zones from mitigated zones. When price touches a zone, that zone becomes more opaque/gray, showing that it has already been mitigated. If a zone is broken according to the indicator logic, it can be automatically removed from the chart to keep the view clean and organized.
ZST Zones Indicator is not an Expert Advisor and does not open trades automatically. It is a visual analysis tool designed to help you make better decisions inside your own trading system.
It does not promise guaranteed results, because no indicator can do that. Its real value is in showing important price zones in a clean, structured and professional way, so you can combine them with your technical analysis, risk management and trading experience.
Main Features
- Automatic detection of relevant price zones.
- Professional side panel directly on the chart.
- Timeframe buttons to enable or disable zones:
- M1
- M5
- M15
- H1
- H4
- Multi-timeframe visualization on a single chart.
- Different colors for each timeframe.
- Mitigated zones displayed in a muted/gray color.
- Optional automatic removal of broken zones.
- Editable colors, panel position and visual style.
- Compatible with different symbols and timeframes.
- Designed for visual analysis, trade management and manual trading support.
- No DLL usage.
- No WebRequest usage.
- No automatic trading execution.
How You Can Use It
You can use ZST Zones Indicator in different ways:
- As a main reference for trading price reactions.
- As visual confirmation inside your own strategy.
- To identify possible pullback zones.
- To mark areas where price may react.
- To combine lower and higher timeframe zones.
- To manage entries, exits, stop losses or partial profits more clearly.
- To keep your chart organized without manually drawing every zone.