Candlestick Pattern Analytics MT5
- インディケータ
-
Lim Wei Liang
 Algo Theory Studio | 高性能アルゴリズムトレードツール
____________________________________________________
Algo Theory Studio の MQL5 公式ストアへようこそ。 - バージョン: 1.89
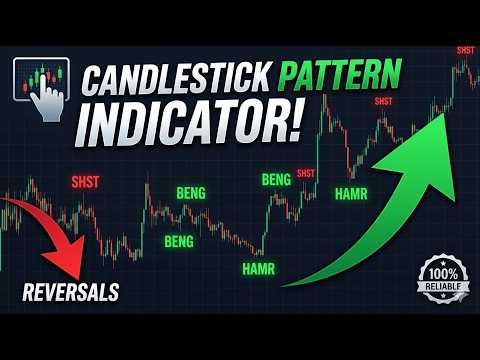
Stop chasing every flickering candle. Most candlestick indicators fail because they treat a "Hammer" in the middle of a trend the same as a "Hammer" at a major reversal point. Candlestick Pattern Analytics changes that by filtering for structure, strength, and logic.
## Why This Indicator is Different
While common tools "spam" your chart with every pattern they find, this indicator focuses on Quality over Quantity.
-
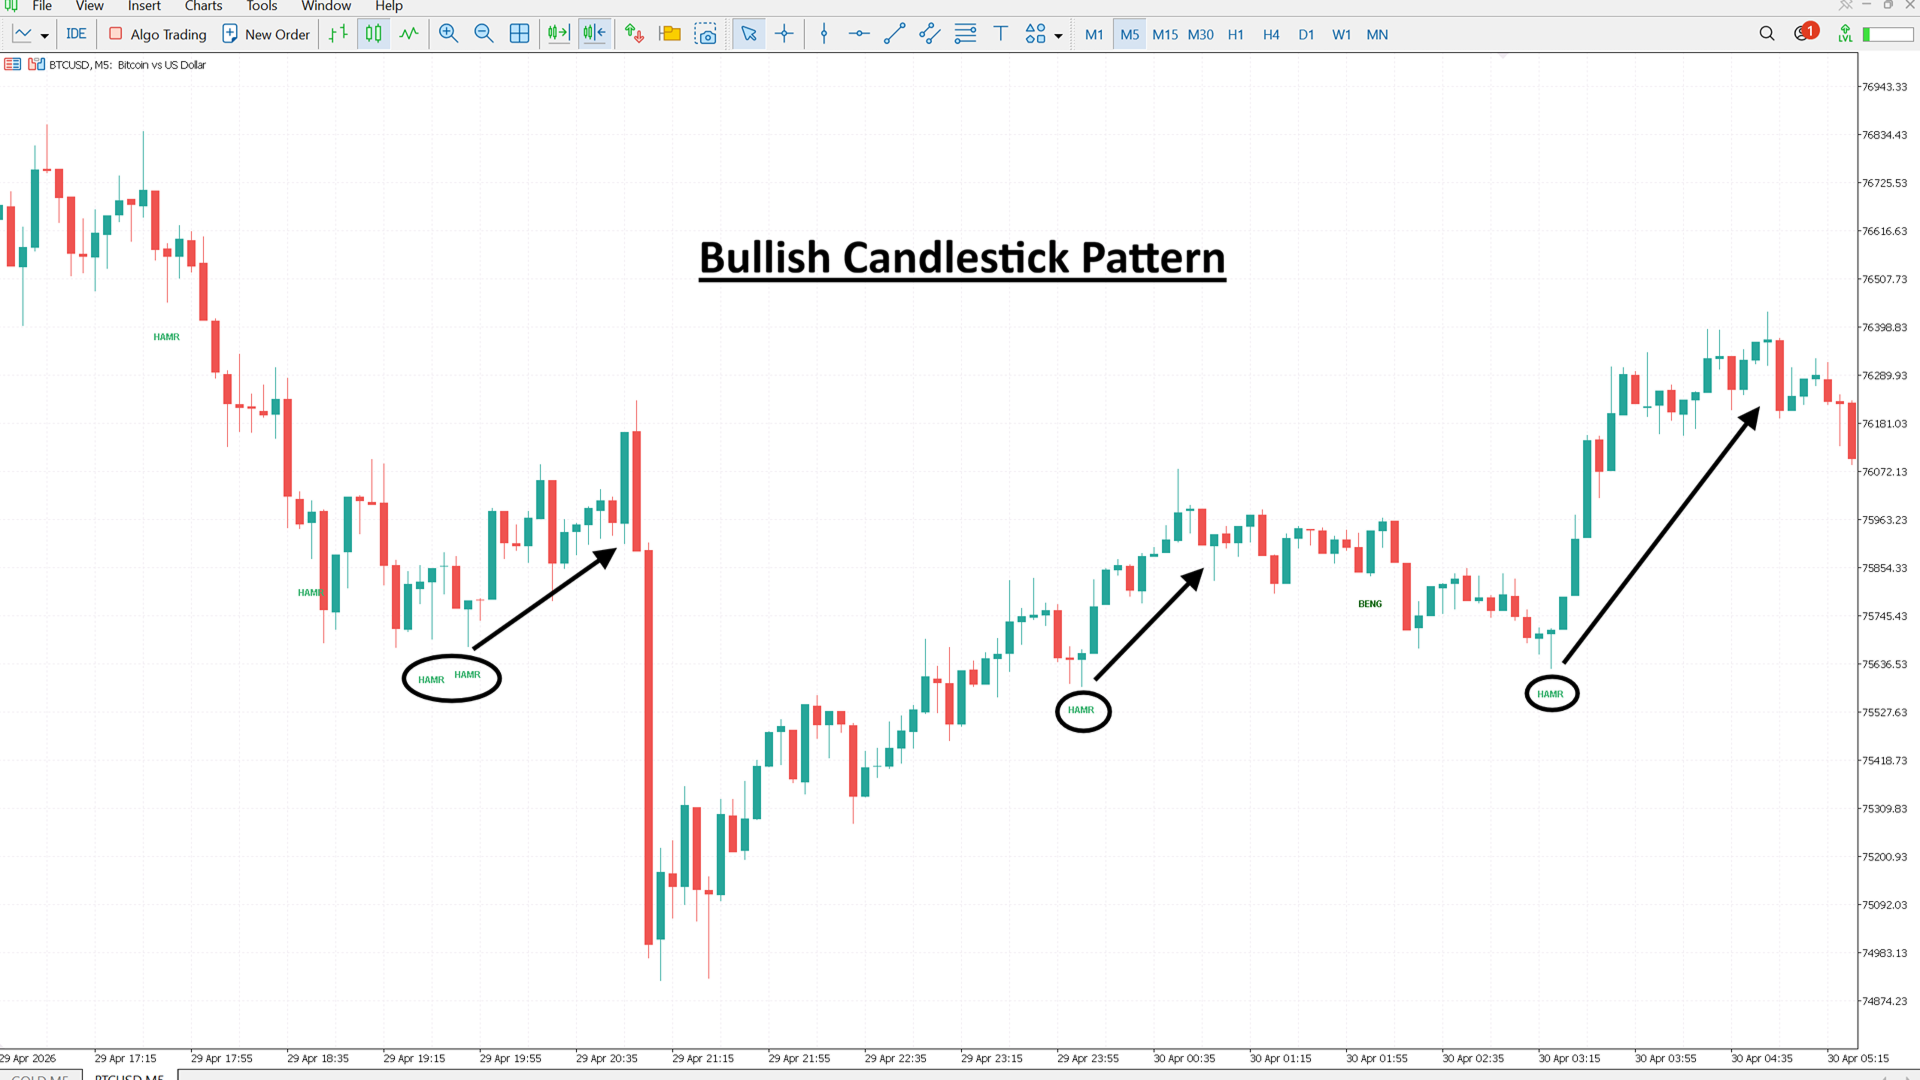
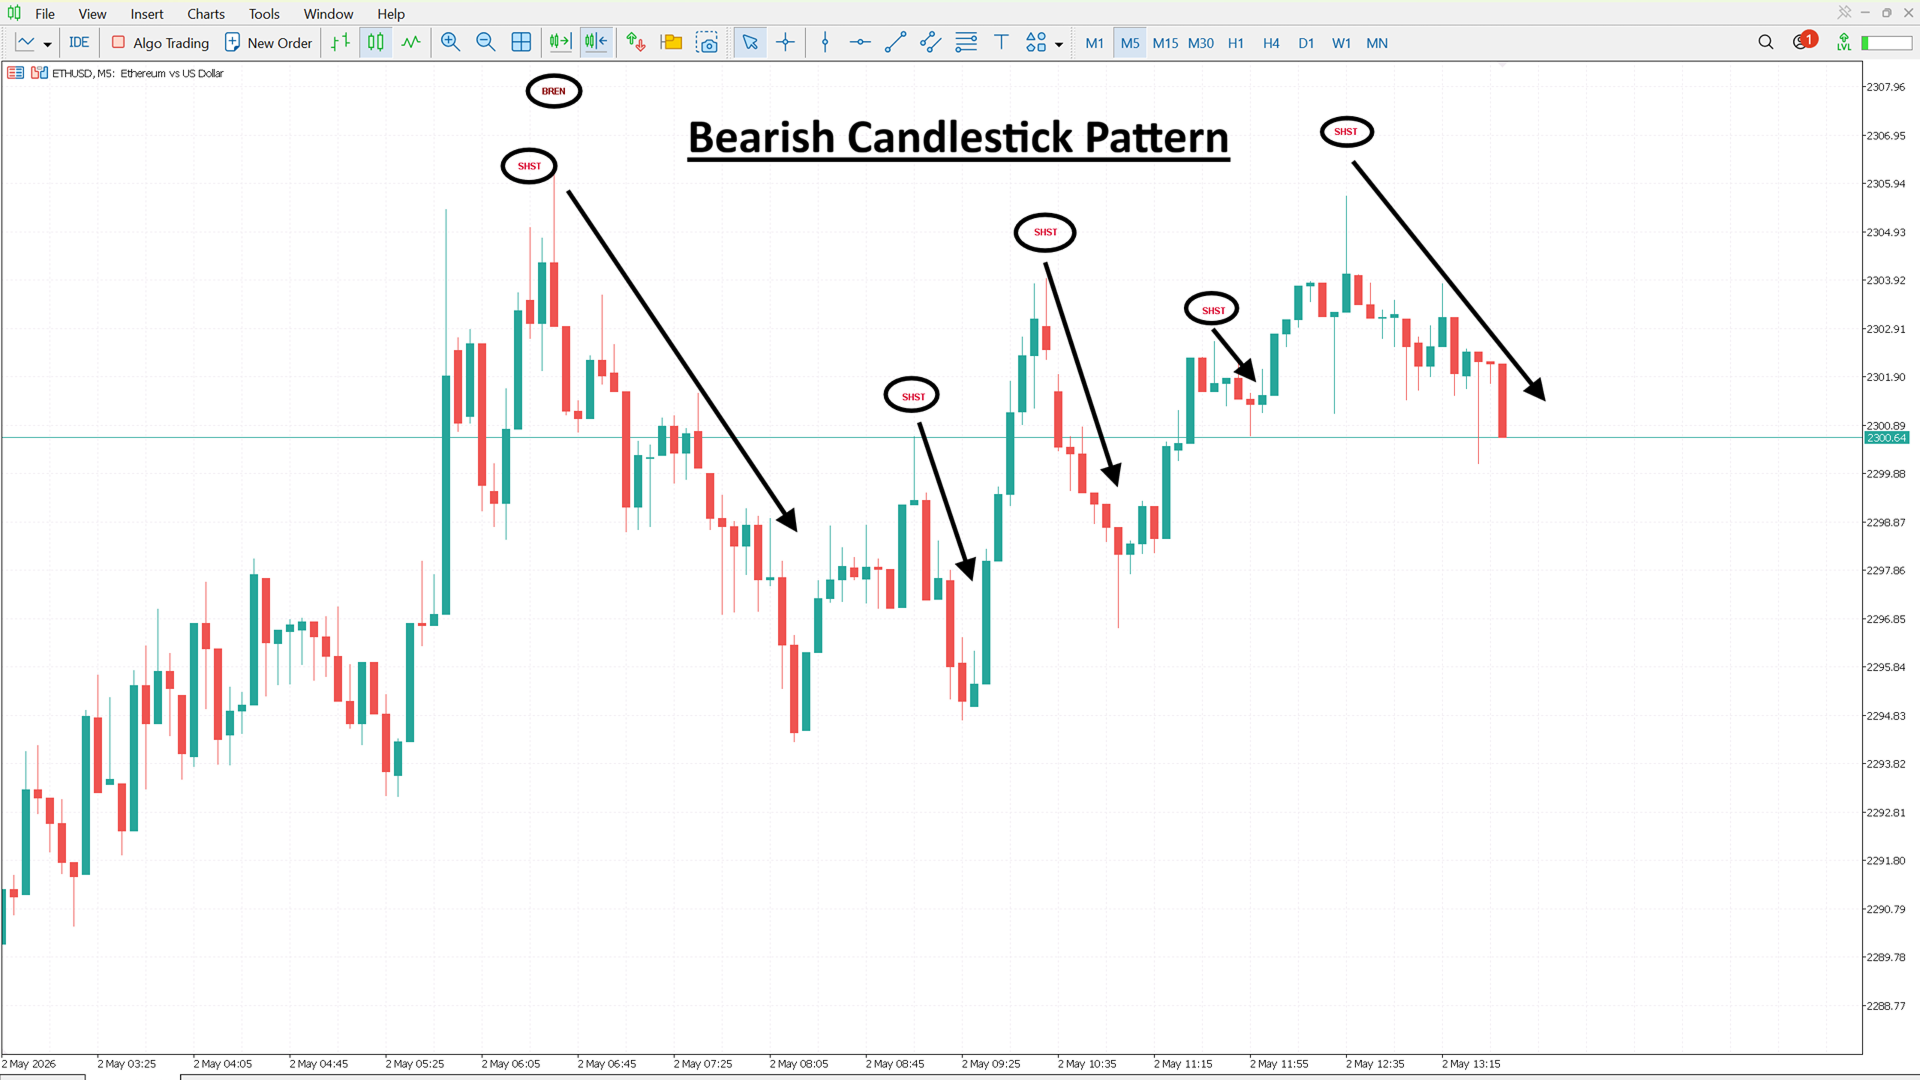
Swing-Based Intelligence: By default, signals only appear at local swing highs or lows. It ignores the "noise" in the middle of moves to focus on where the market is actually pivoting.
-
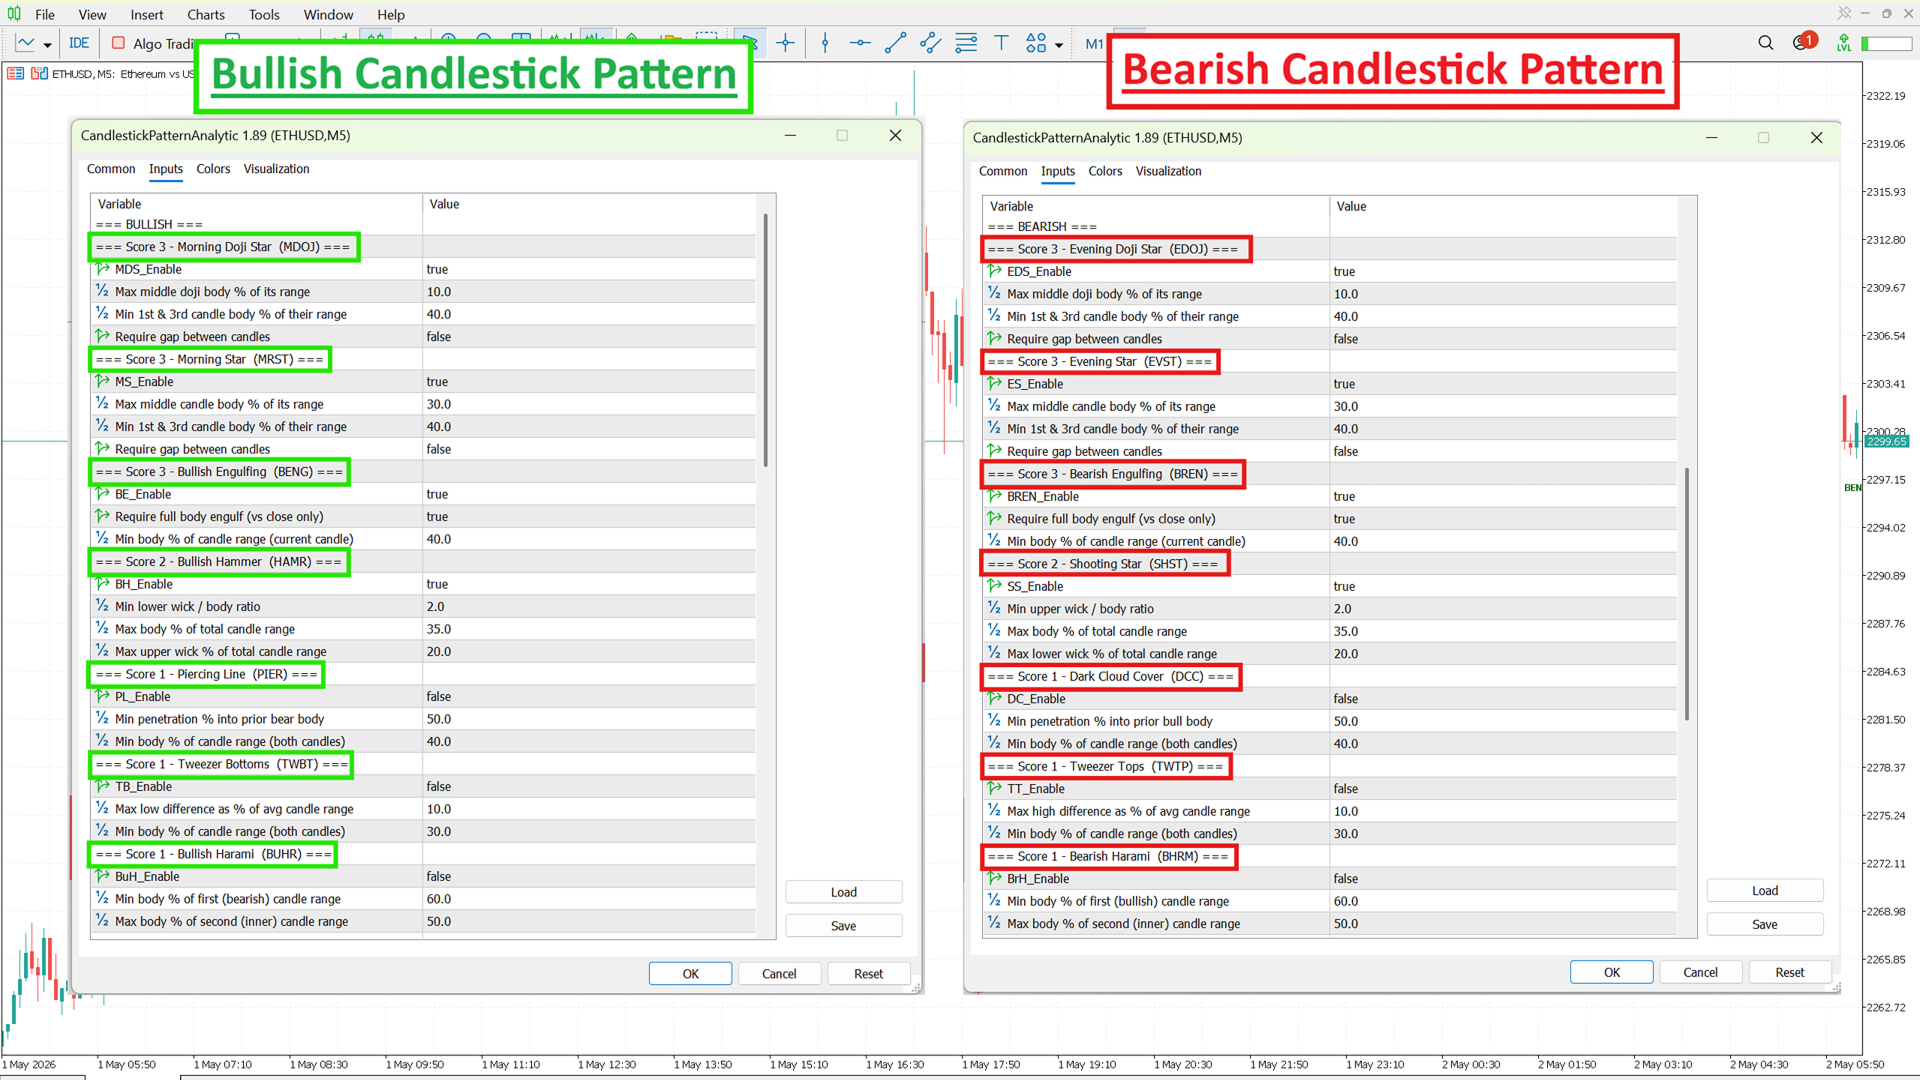
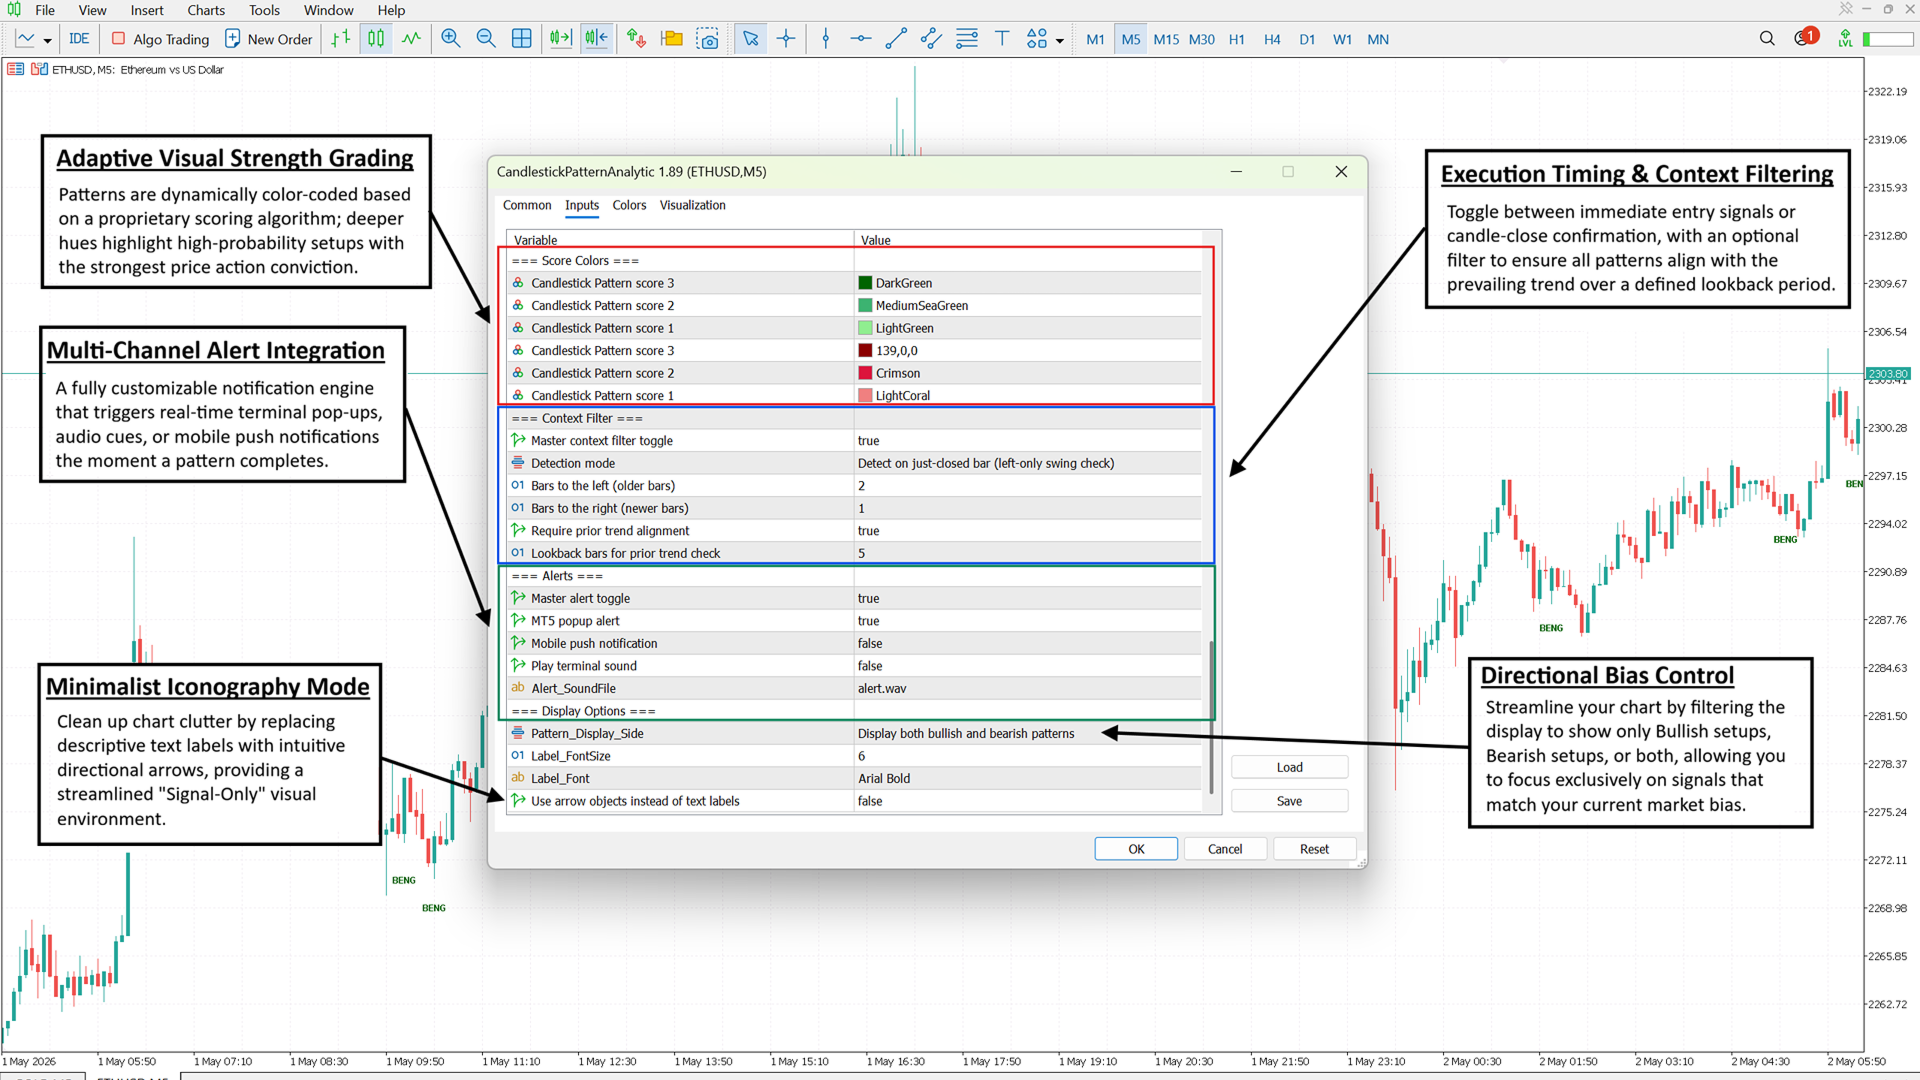
Weighted Strength Scoring: Not all patterns are equal. Signals are grouped into 3 Strength Tiers (Score 1 to 3) with customizable color-coding. Spot high-conviction setups (Score 3) instantly.
-
Precision Customization: You define what a "Hammer" or "Engulfing" bar looks like. Adjust body percentages, wick ratios, and gap rules to fit your specific asset and strategy.
## How It Makes Your Trading Easier
-
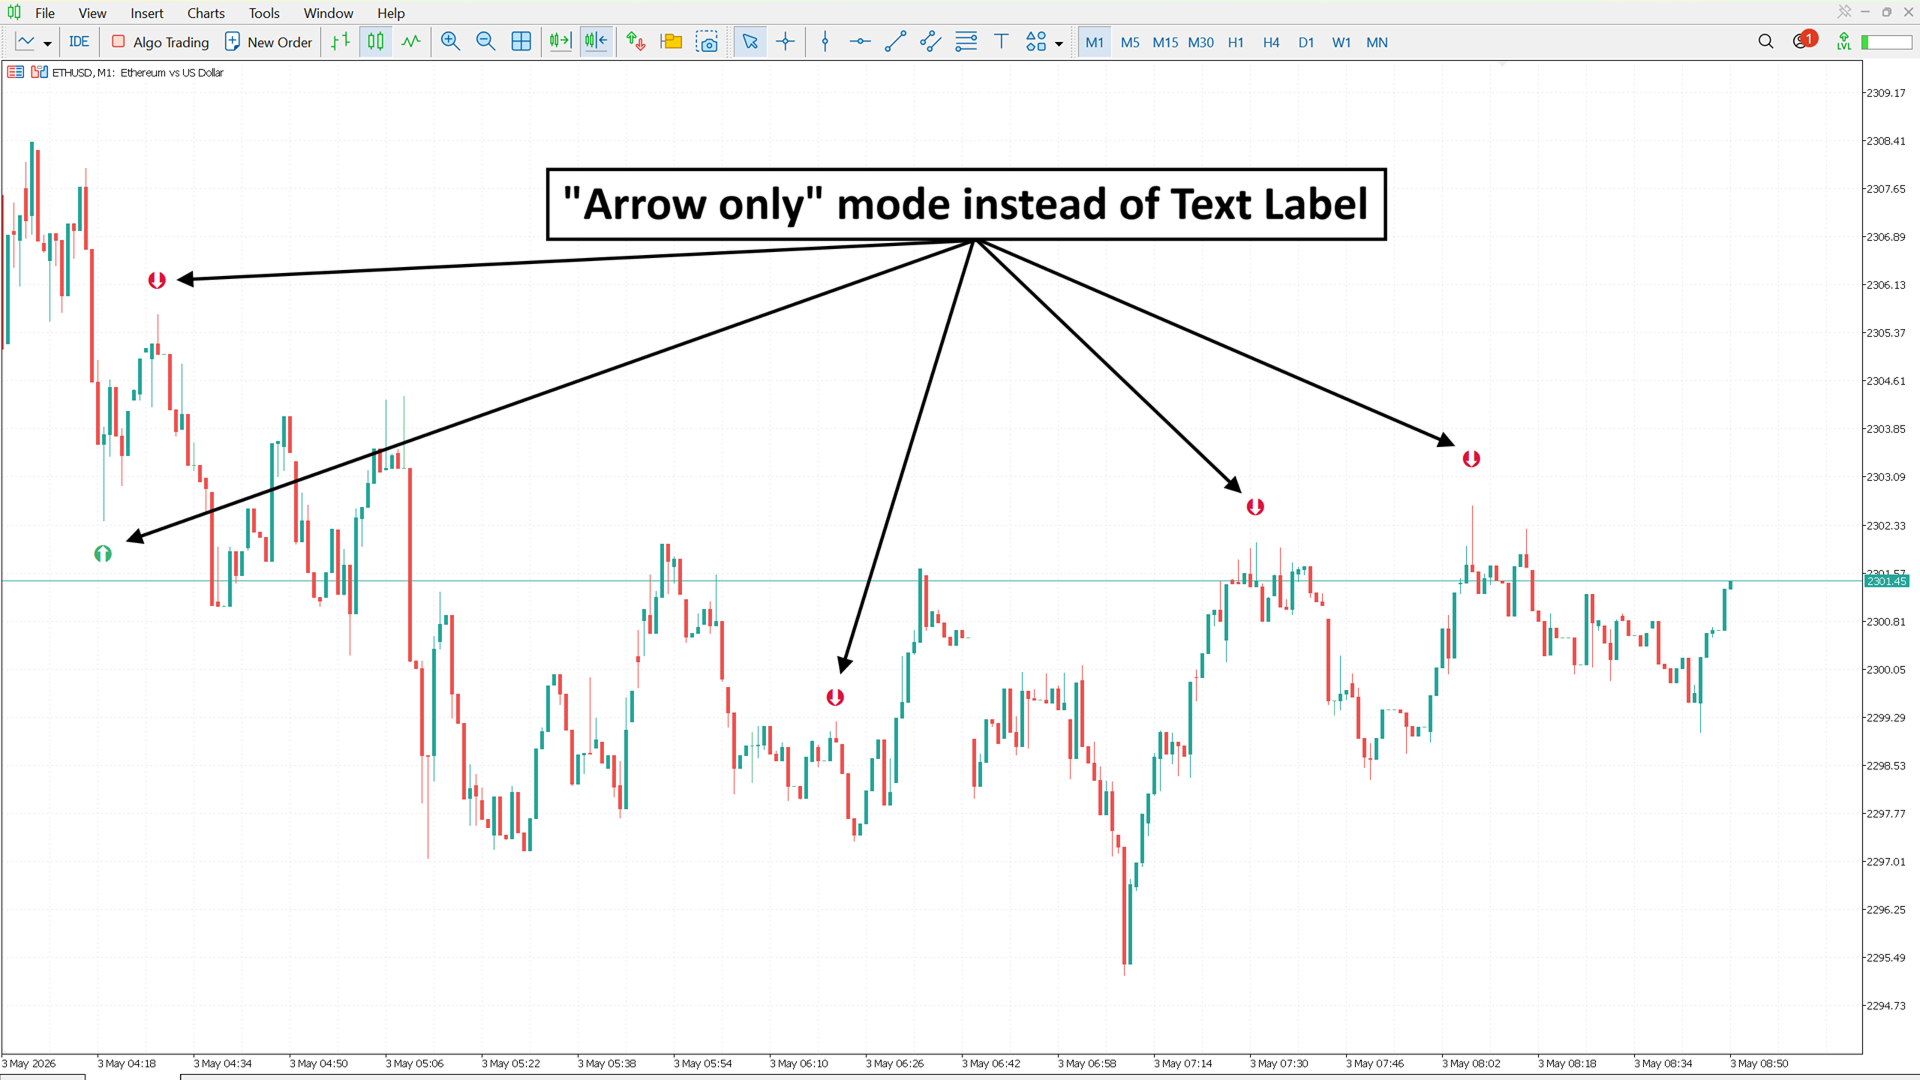
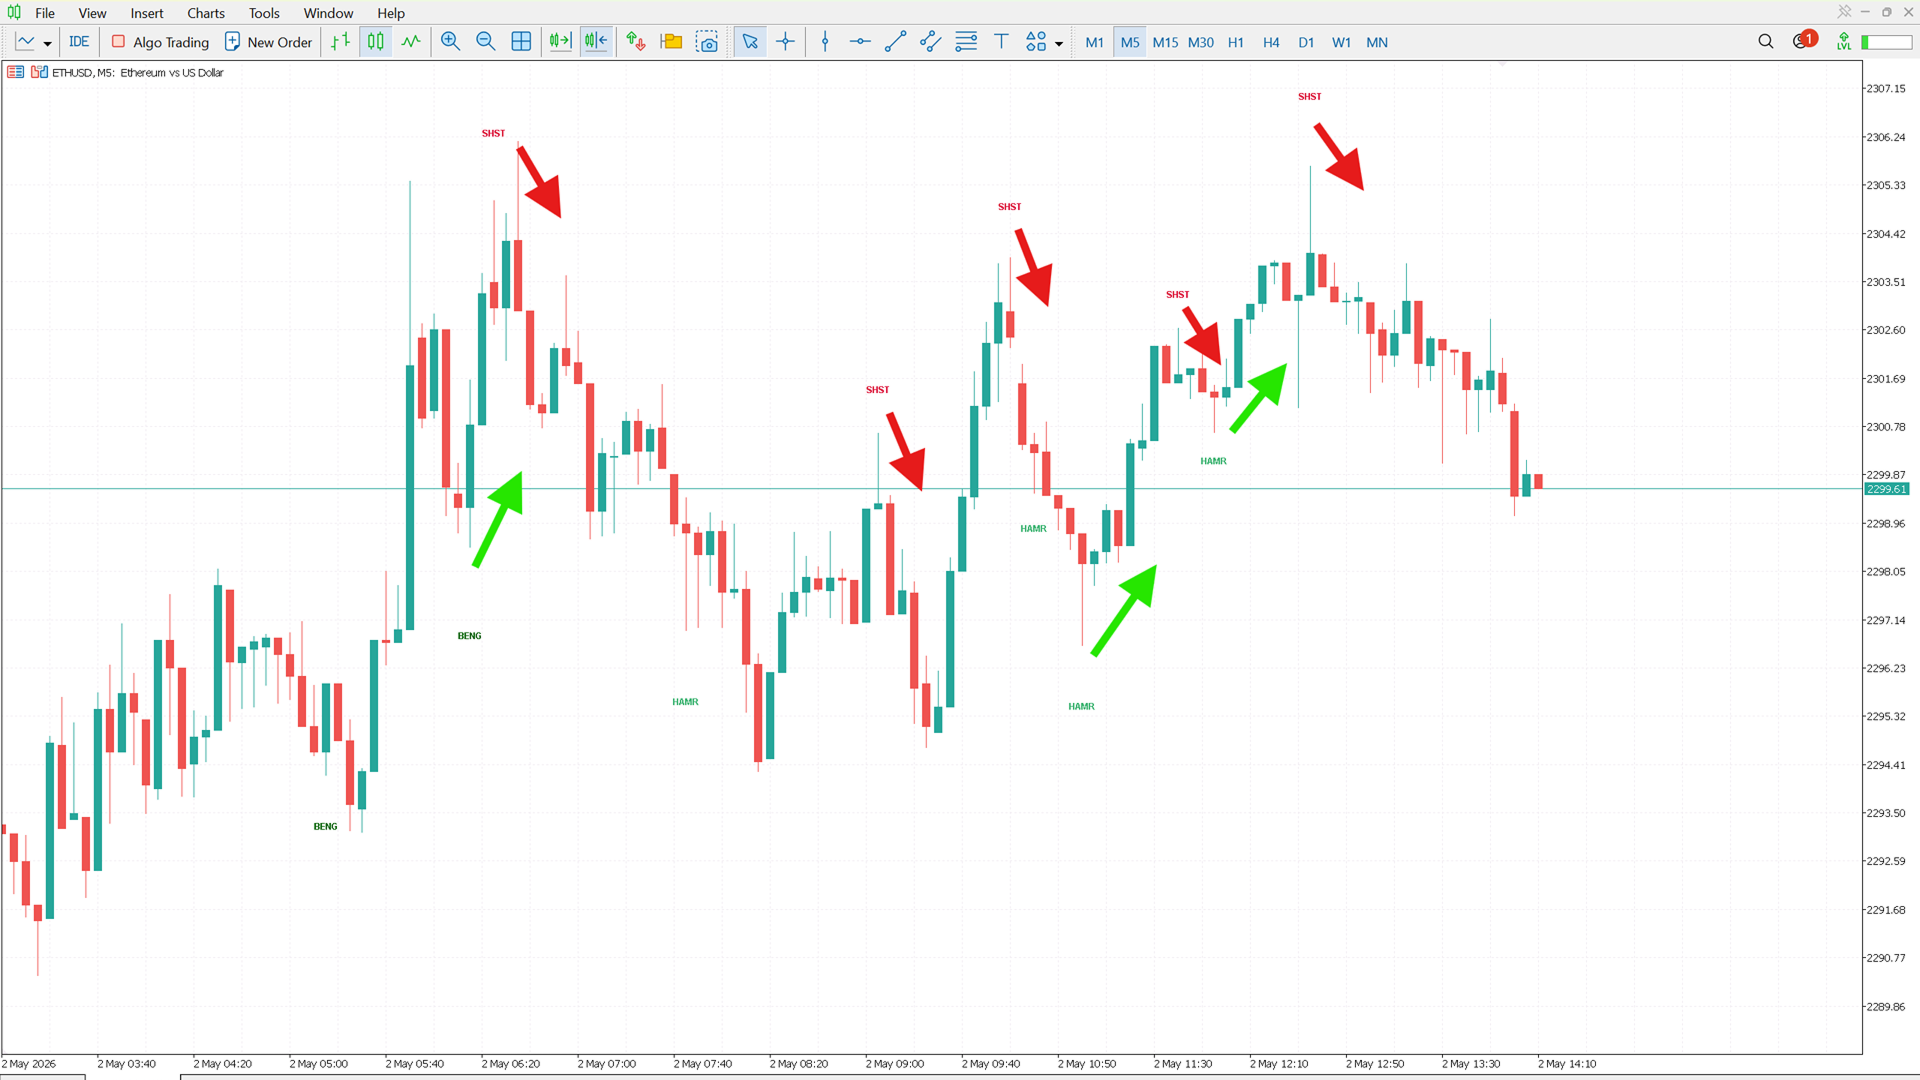
Instant Price Action Reads: Stop manual scanning. Get clear text labels or arrows for Morning Stars, Engulfing bars, and more, the moment they form.
-
Cleaner Charts: Use the Context Filter to keep your workspace professional. If you want to see everything for research, simply switch off the Context Filter.
-
Trend-Aligned Signals: Enable optional trend context so bullish reversals only show after a downtrend, ensuring you stay on the right side of the logic.
-
Alerts That Matter: Get popup alerts only when a pattern meets your specific strength and structure criteria.
## Tiered Pattern Examples
-
High Conviction (Score 3): Morning/Evening Stars, Engulfing Patterns.
-
Reliable (Score 2): Hammers, Shooting Stars.
-
Supplementary (Score 1– off by default): Harami, Piercing Lines, Tweezer Tops/Bottoms.
## Important Notes
This is a confirmation tool, not a "magic button" strategy. This indicator is designed to confirm price action at key Support and Resistance levels.
It performs best when used with:
- Support & resistance
- Market structure
- Trend awareness
- Proper risk management
Before You Buy
Note: Like most indicators, the default Strategy Tester demo may not reflect real market conditions or allow parameter customization.
For a complete evaluation experience with full parameter access, feel free to reach out via private message here on MQL5 — I’m happy to assist serious traders in getting the most out of this tool before committing to a purchase
ユーザーは評価に対して何もコメントを残しませんでした