Opening Range Pro

Opening Range Pro


WHAT DOES THIS INDICATOR DO?


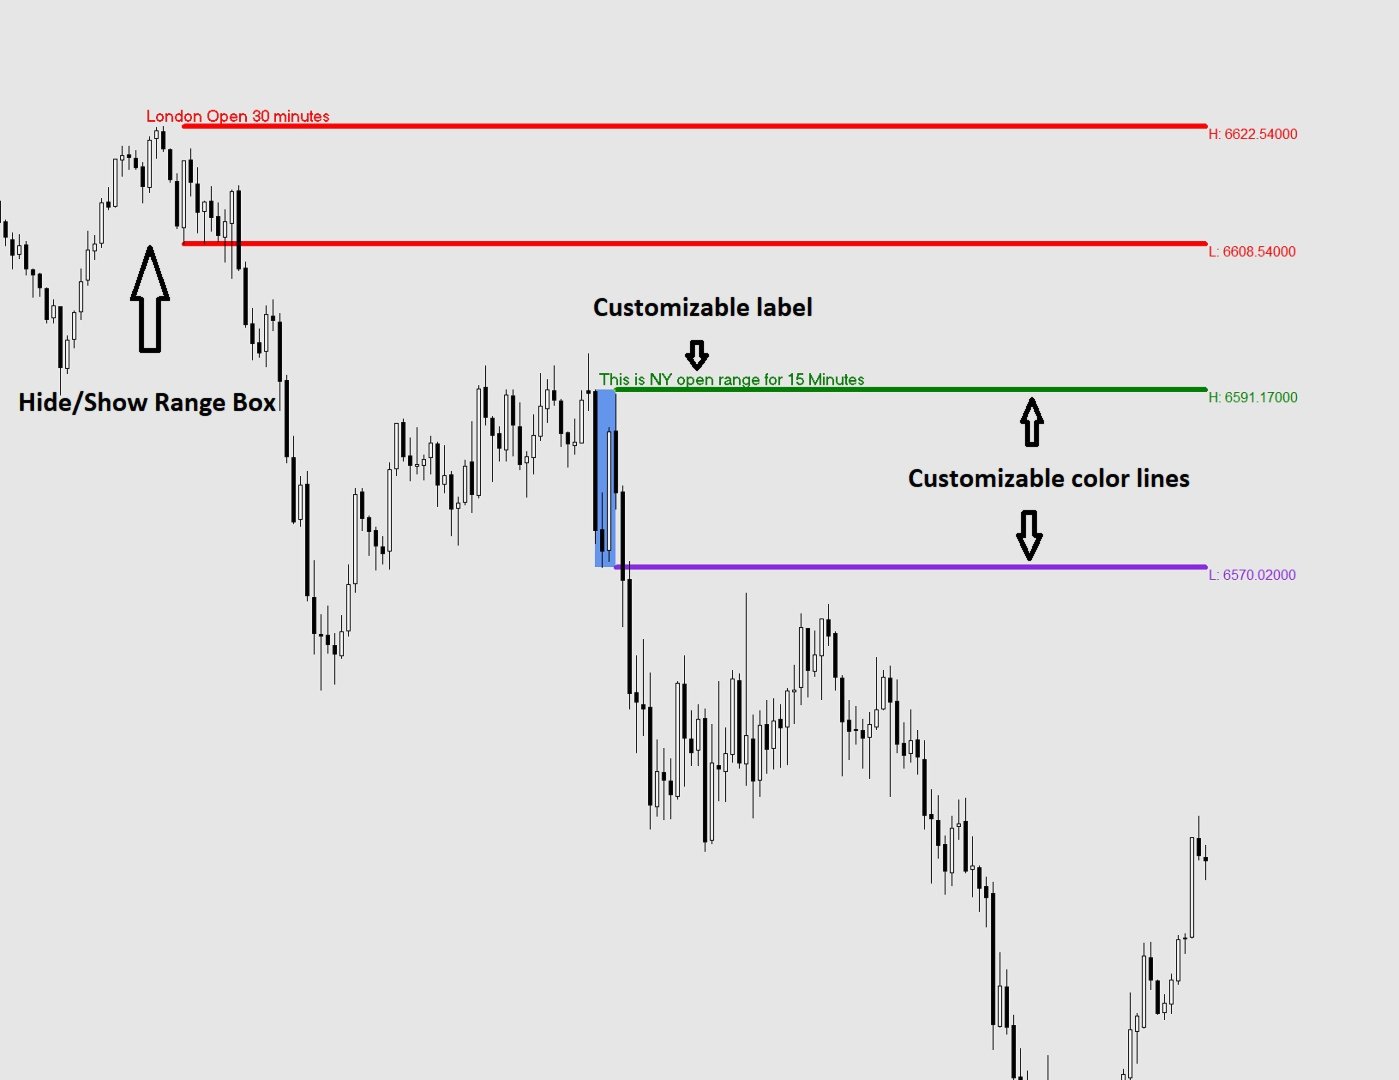
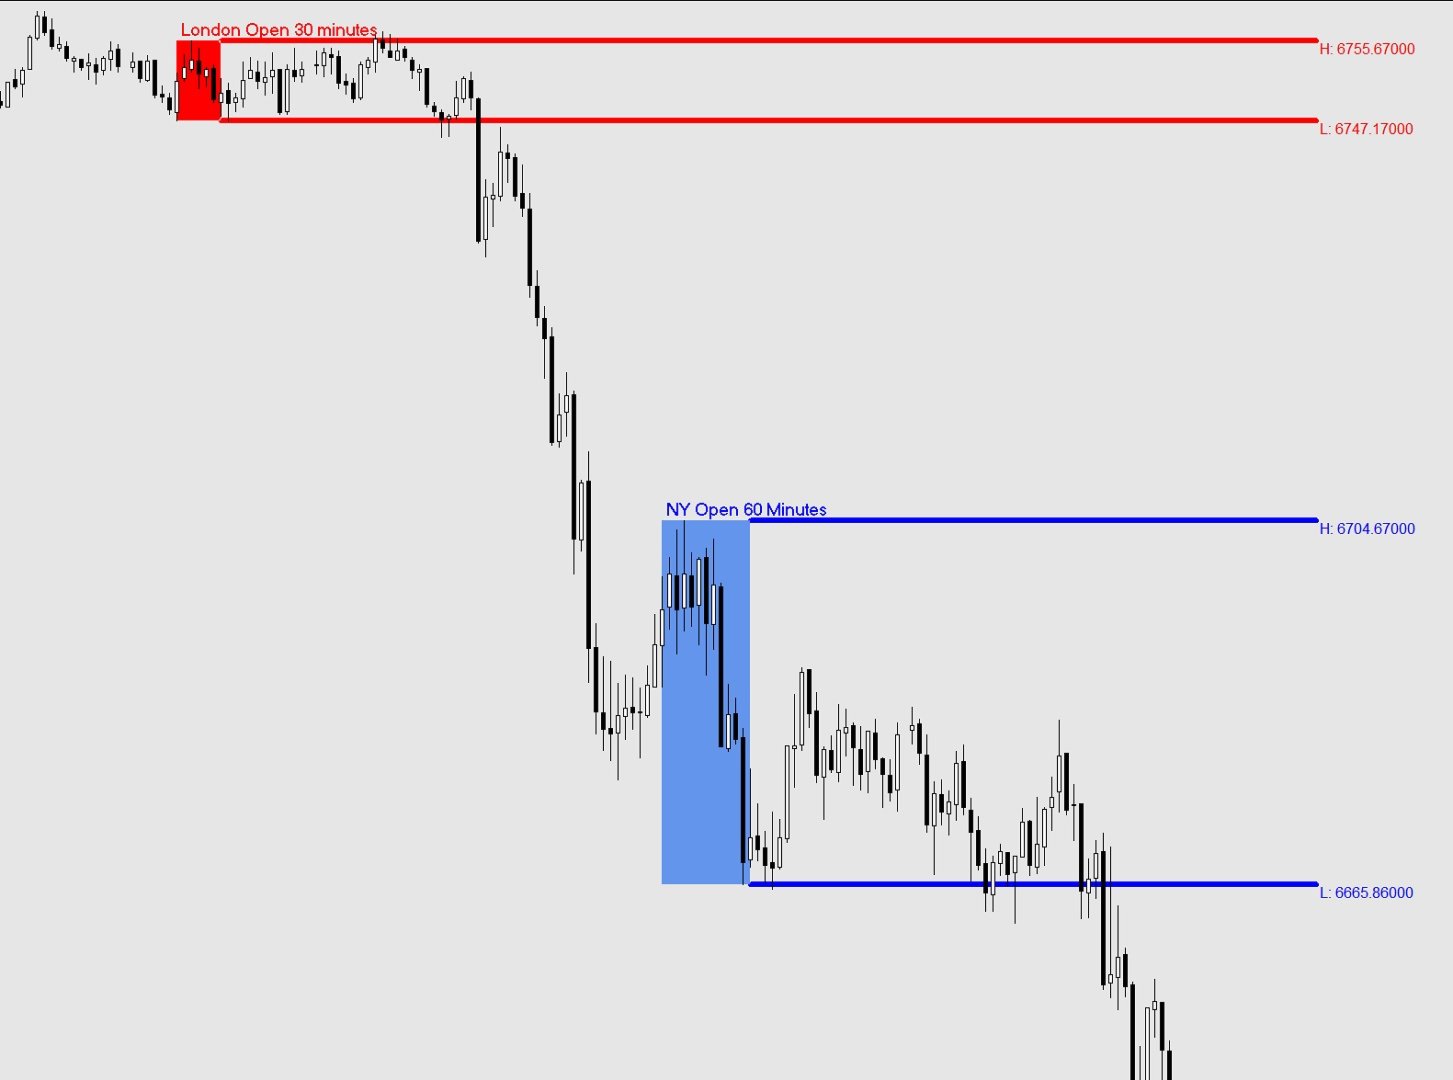
The Opening Range indicator marks the highest and lowest price reached during a

specific time window that you define (for example, the first 15 minutes of the

New York session). Once that window closes, it draws two horizontal lines — one

at the high and one at the low — extending across the rest of the trading day,

so you can see at a glance whether price is above or below the range, and use

those levels as reference for your trading decisions.


The indicator also draws a shaded box covering the formation period, and can

display the exact price of each level right on the chart.


All times used by the indicator are your broker's server time, which you can

see at the bottom of your MetaTrader platform.


SETTINGS REFERENCE


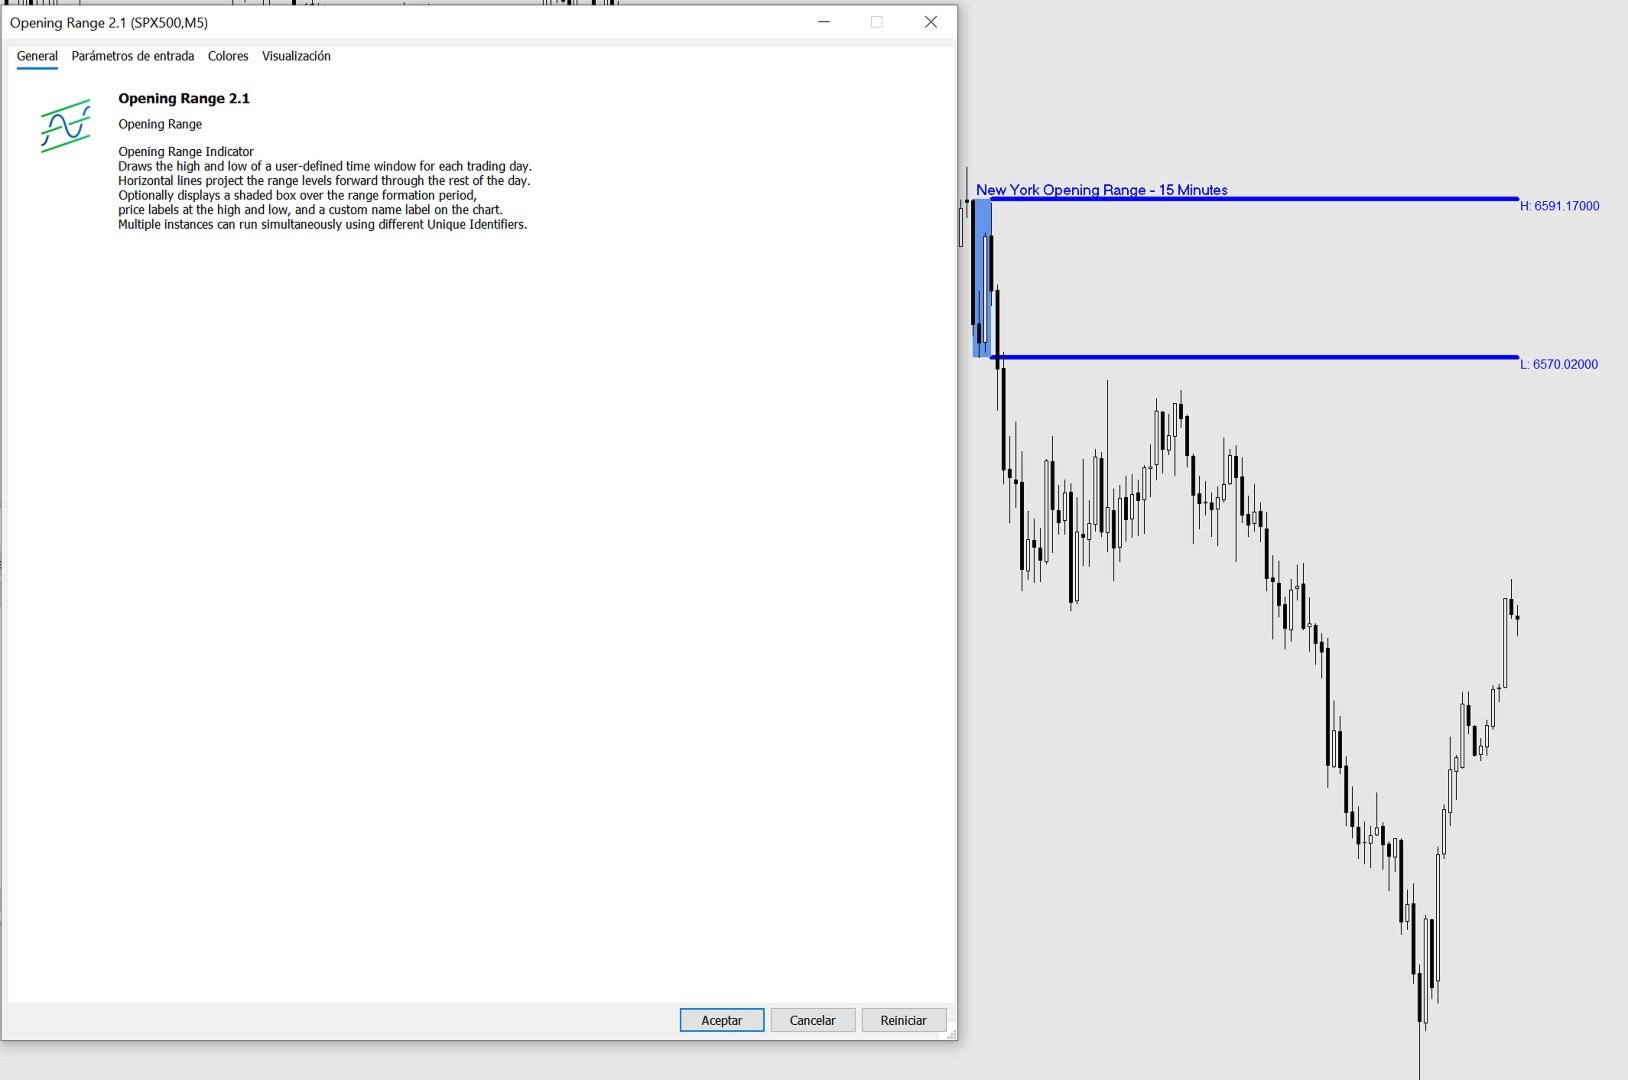
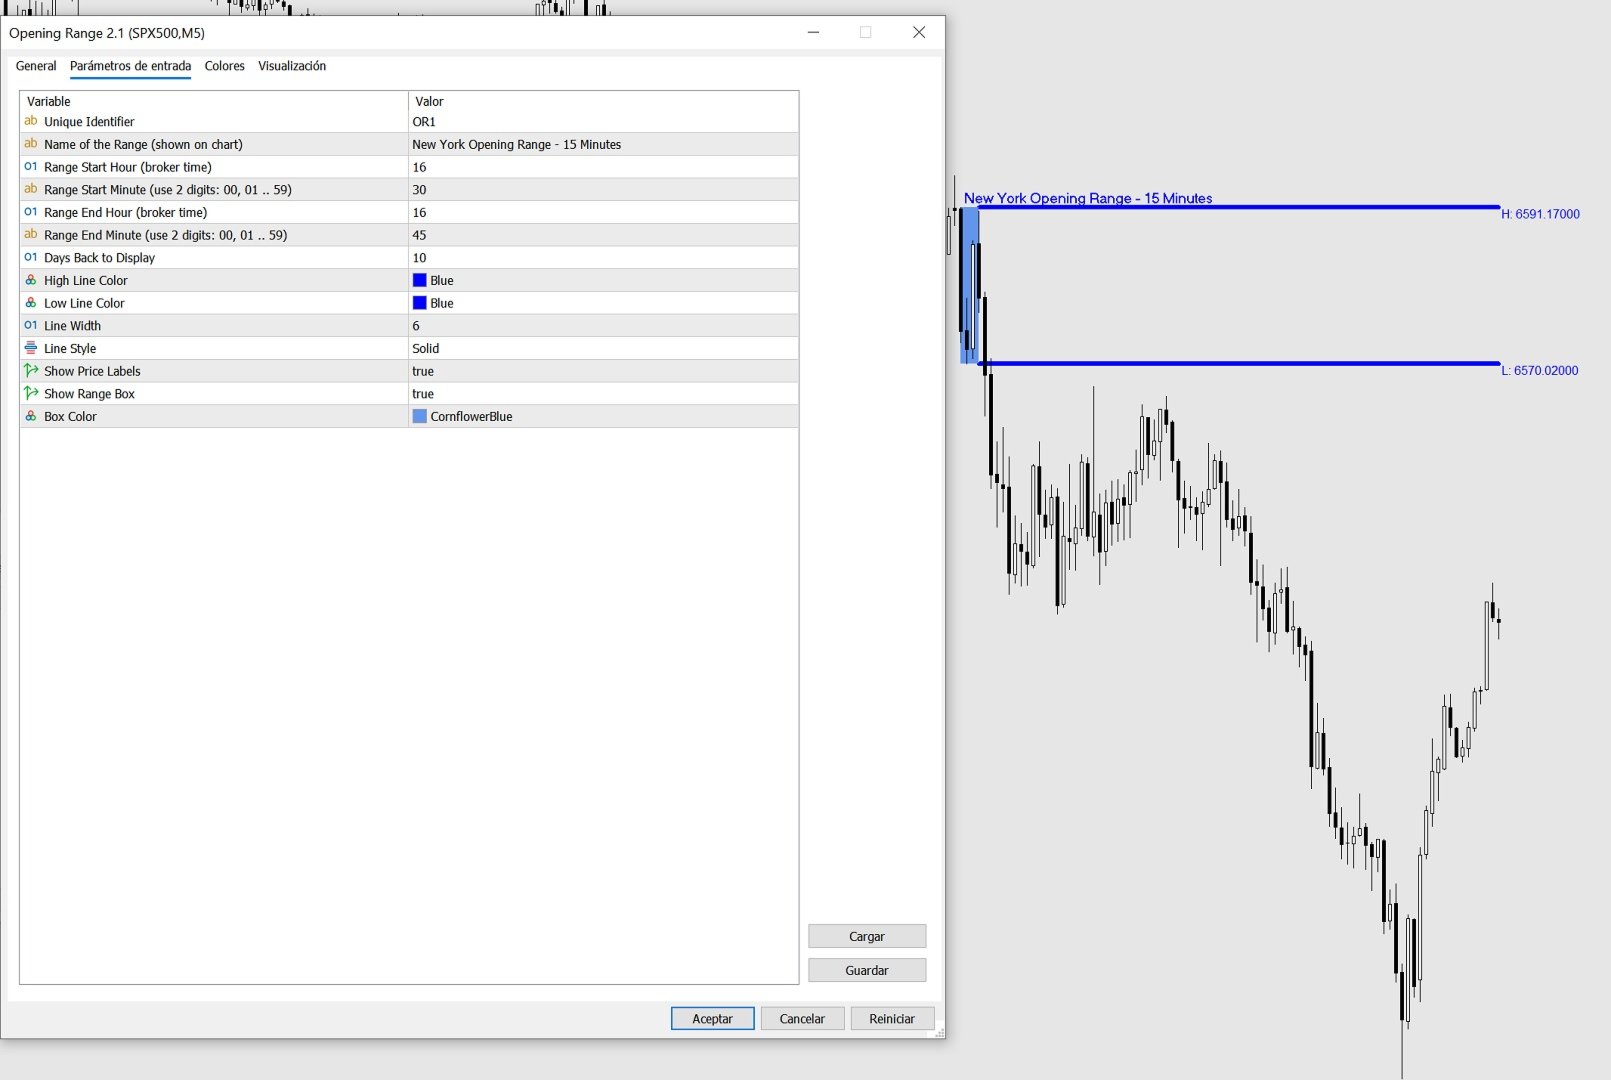
When you attach the indicator to a chart, a settings window will appear with

two tabs: General (description) and Inputs (your settings). All settings are

found in the Inputs tab.


-- IDENTIFICATION --


  Unique Identifier

      A short label used internally to tell apart multiple instances of the

      indicator running on the same chart. If you only use one instance, leave

      this as the default (OR1). If you add a second instance for a different

      session, change this to OR2 (or any unique text) to avoid conflicts.

      Example: OR1, OR2, London, NY


  Name of the Range (shown on chart)

      Optional. Whatever you type here will appear as a bold label directly on

      the chart at the top-left corner of the range box and at the start of the

      high line. Leave it blank if you do not want a label.

      Example: "London Open", "NY Open", "Asia Range"


-- TIME SETTINGS --

  All times refer to your broker's server time (shown at the bottom of MT4/MT5).


  Range Start Hour

      The hour at which the range formation period begins.

      Enter a number from 0 to 23 using the 24-hour clock.

      Example: 9 means 9:00 AM broker time.


  Range Start Minute

      The minute at which the range formation period begins.

      Always enter 2 digits: 00, 01, 05, 15, 30, 45, etc.


  Range End Hour

      The hour at which the range formation period ends.

      Enter a number from 0 to 23 using the 24-hour clock.


  Range End Minute

      The minute at which the range formation period ends.

      Always enter 2 digits: 00, 01, 05, 15, 30, 45, etc.


  Example — to capture the first 15 minutes of a session starting at 09:30:

      Range Start Hour   = 9

      Range Start Minute = 30

      Range End Hour     = 9

      Range End Minute   = 45


-- DISPLAY --


  Days Back to Display

      How many past trading days to draw on the chart. Higher values give you

      more history but may slow things down on low-powered computers.

      Recommended: 5 to 20.


  High Line Color

      The color of the horizontal line drawn at the top of the range.


  Low Line Color

      The color of the horizontal line drawn at the bottom of the range.


  Line Width

      Thickness of the high and low lines. Enter a number from 1 (thinnest)

      to 6 (thickest).


  Line Style  (MT5 only — dropdown)

  Line Style  (MT4 — enter a number: 0=Solid, 1=Dash, 2=Dot, 3=DashDot, 4=DashDotDot)

      The style of the high and low lines.


  Show Price Labels

      True = display the exact price of the high and low at the right end of

             each line, next to the last candle of the day.

      False = hide the price labels.


  Show Range Box

      True = draw a shaded rectangle covering the range formation period

             (between Range Start and Range End) showing you exactly where

             the high and low were established.

      False = hide the box. The high and low lines are still drawn.


  Box Color

      The fill color of the range box. Choose a color that is visible but

      not distracting on your chart background.


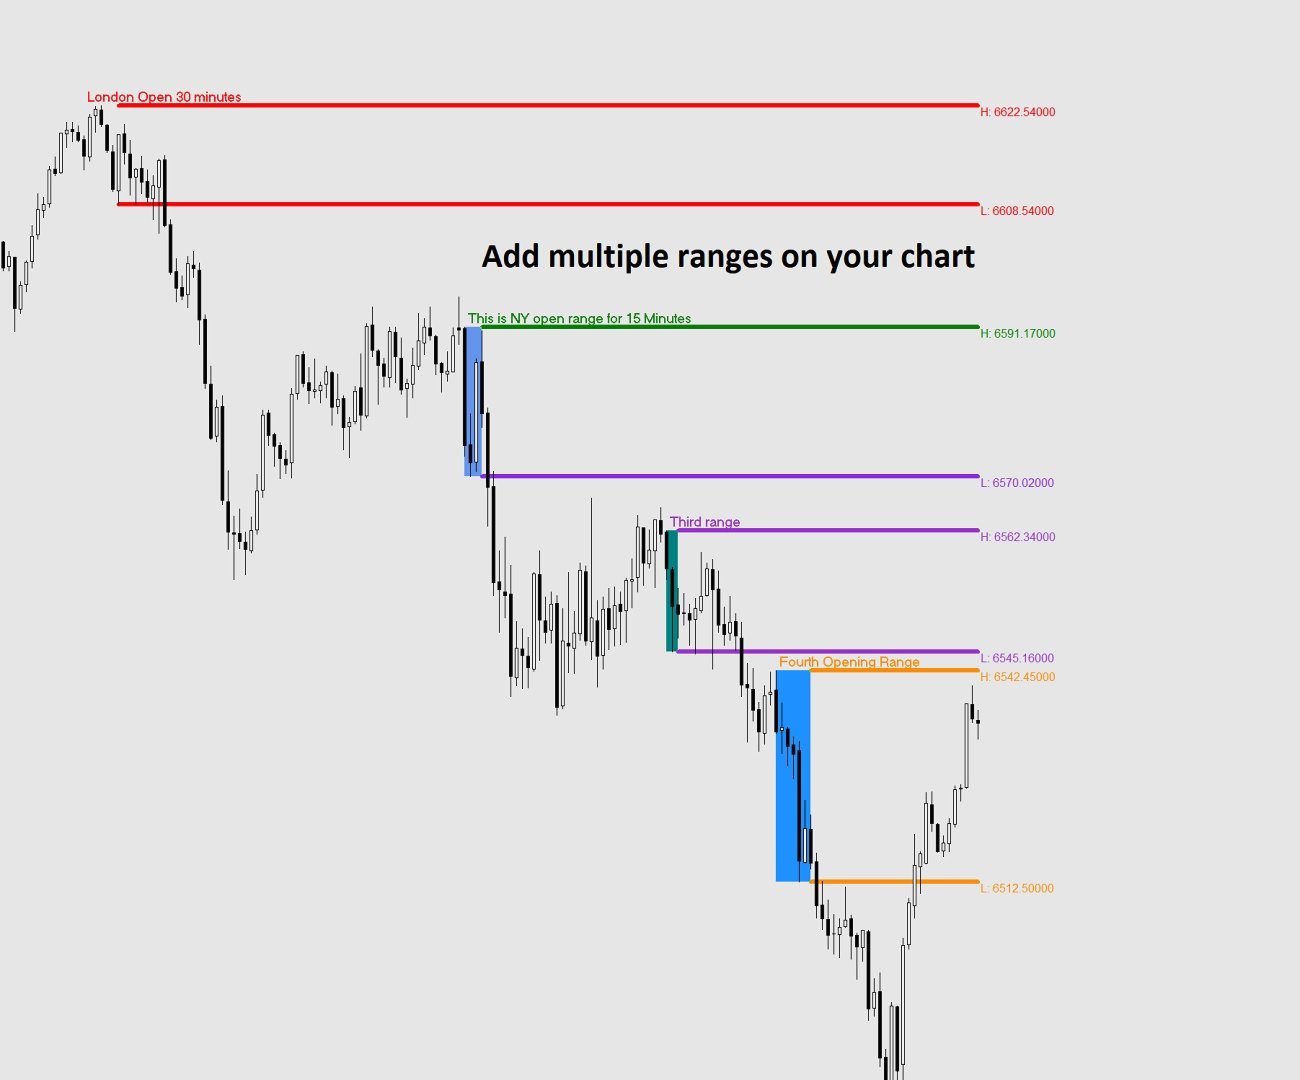
USING MULTIPLE RANGES ON THE SAME CHART


You can add the indicator more than once to study different session ranges

simultaneously (e.g. London open and New York open on the same chart).


To do this:

  1. Attach the indicator a first time and configure it for the first session.

     Set Unique Identifier to OR1.

  2. Attach the indicator a second time and configure it for the second session.

     Set Unique Identifier to OR2.


Each instance must have a different Unique Identifier. If two instances share

the same identifier, their objects will overlap and produce incorrect results.


TIPS

- The lines only appear AFTER the range formation period has closed. During the

  formation period you will see the shaded box building in real time, but the

  extending lines appear once the End Hour/Minute is reached.


- If no lines appear for today, it may be that the range end time has not yet

  passed on the current day. Historical days will still show correctly.


- If lines appear at the wrong time, double-check your broker's server time

  (visible at the bottom of your MetaTrader window) and adjust the start and

  end hours accordingly.


- Weekend days (Saturday and Sunday) are automatically skipped.


- Removing the indicator from the chart will cleanly delete all lines, boxes

  and labels it created.
Produits recommandés
QuantEx Pivot Indicator MT5
Savia Forex Software Solutions
QuantEx Pivot Indicator   is a practical MT4 technical analysis tool designed to help traders identify important Fibonacci-based pivot, support, and resistance levels directly on the chart. The indicator monitors price action and plots key levels using a structured calculation framework, giving traders a clearer view of potential reaction zones across different market conditions. QuantEx Pivot Indicator can be used on compatible currency pairs, indices, commodities, stocks, metals, and cryptocur
DYJ WITHDRAWAL PLAN : Système de Trading sur Renversement de Tendance 1. Qu'est-ce que DYJ WITHDRAWAL PLAN ? DYJ WITHDRAWAL PLAN   est un   système de trading intelligent basé sur le renversement de tendance , conçu pour   ouvrir et clôturer automatiquement les positions   lorsque le marché change de direction. Ce système est   compatible avec tous les instruments financiers et tous les courtiers , qu'il s'agisse de   Forex   ou d' Indices Synthétiques , il s'adapte facilement à tous types de
MTF Market Structure ZigZag is a multi-timeframe structure indicator for MetaTrader 5. It maps ZigZag-based swing structure from up to four selected timeframes onto the active chart and helps traders read trend continuation and structural shifts more clearly. The indicator can display: ZigZag swing lines market structure labels: HH, HL, LH, LL BOS (Break of Structure) events CHoCH (Change of Character) events optional horizontal break lines shifted to the right BOS and CHoCH are confirmed by can
FREE
Cet indicateur multi-périodes et multi-symboles identifie le moment où la ligne de signal stochastique croise la ligne principale stochastique. Comme alternative, il peut également alerter lorsque la stochastique quitte (sans ligne de signal traversant la ligne principale) une zone de surachat/survente. En prime, il peut également rechercher les bandes de Bollinger et les croisements de surachat/survente RSI. Combiné avec vos propres règles et techniques, cet indicateur vous permettra de créer (
Indicador Maestro del Trader Características Principales: Spread del Mercado en Tiempo Real : Visualiza el diferencial entre el precio de compra y venta directamente en tu gráfico.  Cuenta Regresiva del Cierre de Vela : No más sorpresas al final de la vela. El indicador muestra un cronómetro que te informa cuánto tiempo queda antes de que se cierre la vela actual. ¡Actúa con precisión en los momentos cruciales! Ganancias o Pérdidas en Tiempo Real : ¿Estás en verde o en rojo? El Indicador Maest
FREE
Lumin Chart
John John Gutierrez Vivas
LUMIN Chart reads the market structure for you and draws the zones that matter. It finds support, resistance and Order Blocks, scores each one from 0 to 12 and rates it WEAK, MEDIUM or STRONG, so you can see at a glance which levels deserve your attention. This is an indicator only. It does not open, close or modify trades, and it does not need Algo Trading enabled. Key features Scored zones (0–12). Every zone is rated on: impulse leaving the zone rejection wick respected bounces (exhausted zone
Round levels for XAUUSD
Antonio Chrispus Mpanga Ntege
RoundLevels is an XAUUSD indicator designed to display psychological round-number price levels on the chart. These levels can be used as reference points when analyzing price movement, support and resistance, breakouts, retests, and reactions around commonly observed price intervals. The indicator automatically presents selected round levels on the chart, reducing the need to mark these levels manually. Traders can use the displayed levels together with their existing market structure, volatili
Product Title Multi-Stage Fibonacci Structure – Wave-Based Support & Resistance English Description A Fibonacci structure designed to identify high-value price levels by preserving the Fibonacci relationships created during previous market waves. Instead of drawing Fibonacci levels only from the most recent high and low, this method keeps the important levels created during previous 1st to 5th wave structures and uses them as reference points for future price action. The key concept is simple: P
TA Prop Prime XAUUSD
Rajendra Prasad Tripathi
Introduction. https://youtu.be/KdE8kqWv84Y   Introduction. TA Prop Prime XAUUSD v1.35 Final is an automated trading solution for MetaTrader 5, designed for the XAUUSD (Gold) currency pair. This Expert Advisor utilizes a specific set of technical parameters to identify entries and exits based on predefined market conditions. Key Functionality Symbol/Timeframe: Optimized for XAUUSD on the M5 & for Trend H1 timeframes. Risk Management: Includes configurable parameters for position sizing and risk c
Heiken Ashi Suavizado
Juan Manuel Rojas Perez
4 (3)
El **Heiken Ashi Smoothed** es una versión suavizada del indicador técnico Heiken Ashi, que se utiliza en el análisis de gráficos de velas para identificar tendencias del mercado y pronosticar movimientos de precios. Este indicador se basa en el promedio de datos de precios para formar un gráfico de velas que ayuda a los traders a filtrar el ruido del mercado. **¿Para qué sirve?** Este indicador se utiliza para identificar cuándo los traders deben permanecer en una operación y cuándo está por
FREE
La **Media Móvil de Tercera Generación (TGMMA)** es una versión avanzada del indicador estándar de **Media Móvil (MA)**. Fue descrita por primera vez por Manfred G. Dürschner en su artículo "Gleitende Durchschnitte 3.0" (en alemán). Aquí están las características clave de la TGMMA: 1. **Reducción del Retraso**:    - A diferencia de las MAs tradicionales, la TGMMA reduce significativamente el retraso. Se adapta más rápidamente a los cambios de precios, lo que la hace ideal para traders que busc
FREE
Smart Confluence Pro
Louis Wessels Breeschoten
PRODUCT TITLE: Smart Confluence Pro - FVG, VWAP, S/R and Momentum Dashboard CATEGORY: Indicators -> Trend / Information / Levels PRICE: Free SHORT SUMMARY: Multi-factor technical analysis indicator combining Fair Value Gaps (FVG), Anchored Session VWAP with Standard Deviation Bands, Dynamic S/R pivots, and dual momentum verification on a unified chart interface. -------------------------------------------------------------------------------- WHAT'S NEW IN VERSION 2.10 (Copy into the "What's
FREE
Bodhi EW EA Community Version
Bitcityz Innovative Startup Capital Joint Stock Company
BODHI Elliott Wave EA — Free Edition Automatic Elliott Wave trading robot for MetaTrader 5 This EA  BODHI Elliott Wave EA   is only free for the next two months; after August 31 , 2026 , it will sell for $ 499 and will increase by $ 10 for every 10 licenses sold.  Follow us & Support Chanel  https://t.me/tradewithme179 No manual analysis. No complex setup. Rule-validated Wave 3 and Wave 5 entries — free, forever.   Overview BODHI Elliott Wave EA Free is a fully automated Expert Advisor that det
FREE
Introduction à ADELIO Aperçu ADELIO est un système de trading automatisé puissant et précis, conçu pour l' Or (XAU/USD) . Il utilise la volatilité et les tendances du marché à travers une stratégie d’entrées multiples pour gérer le risque. ADELIO EA utilise des ajustements de prix momentanés et la force de la volatilité pour le trading, et est conçu pour être facile à utiliser pour tous les traders. Caractéristiques de l'ADELIO EA   : ADELIO EA exploite les caractéristiques de tendance unidirec
Voorloper MT5
Pradana Novan Rianto
5 (3)
Voorloper Expert Advisor: Revolutionizing Trading with DDR System Introducing Voorloper, an innovative Expert Advisor that blends Moving Average (MA) and Relative Strength Index (RSI) indicators to redefine your trading experience. Voorloper stands out from the crowd with its unique feature: the Drawdown Reduction (DDR) System. Key Features: MA and RSI Integration: Voorloper utilizes a powerful combination of Moving Average and Relative Strength Index indicators to identify optimal entry and ex
FREE
Adaptive Trend Projection est un indicateur pour MetaTrader 5 conçu pour aider les traders à visualiser la possible continuation de la structure actuelle du marché. L’indicateur analyse le comportement récent du prix à l’aide de deux fenêtres de régression pondérée : une période plus longue pour comprendre la direction générale et une période plus courte pour capturer le mouvement le plus récent. Il combine ensuite la pente de la tendance, l’accélération récente, la volatilité et des limites bas
Multi Oscilador
Juan Manuel Rojas Perez
Un indicador técnico de múltiples osciladores es una herramienta de análisis que combina varios osciladores para proporcionar una visión más completa de la dinámica del mercado. Los osciladores son fórmulas matemáticas que se calculan a partir de los datos de los precios y se representan gráficamente para ayudar a identificar la tendencia actual, el sentimiento del mercado y posibles puntos de giro. **¿Para qué sirve?** Este indicador sirve para identificar condiciones de sobrecompra y sobreve
FREE
AuRatio Master EA — XAUUSD H1 IMPORTANT NOTICE — Please read before getting started The default parameters of the EA are not the optimal operating values. The EA comes with a base configuration for technical reference purposes only. To operate correctly, you must load the SET FILE corresponding to your broker, which includes: Risk management calibrated according to your capital and broker profile ATR (Average True Range) application to dynamically adapt to current market volatility Updated and o
Breakout MV
Emmanouil Bampalos
Breakout MV :  This Expert Advisor offers you one of the most fundamental trading strategy,  combining Moving Average and Volums indicators!  Key Features : Consistent Performance : Breakout strategy has demonstrated a robust performance across various market conditions, by capitalizing on significant price movements. Strategic Trade Execution : We select the desired range, and once the price approaches these levels and the indicators confirm our entry, we open a trade. The trade will close eit
FREE
Non Lag Ma
Juan Manuel Rojas Perez
El indicador técnico Non Lag MA (Non-Lagged Moving Average) es una variante de la media móvil que busca reducir el retraso inherente a las medias móviles tradicionales. Pros: - Menos retraso: Al estar diseñado para reducir el retraso, el Non Lag MA puede proporcionar señales más rápidas que las medias móviles tradicionales. - Tendencias claras: Las líneas del Non Lag MA muestran claramente las tendencias alcistas y bajistas, lo que facilita la interpretación de la dirección del mercado. - Pers
FREE
Dynamic Swing Anchored VWAP est un outil prix–volume de précision, conçu pour rester pertinent face aux conditions de marché en direct. Contrairement à un VWAP statique qui dérive avec le temps, cet indicateur s’ancre aux nouveaux swings hauts et bas et ajuste sa réactivité selon la volatilité. Résultat → Une trajectoire de valeur juste qui suit le prix de plus près, facilitant l’identification des pullbacks, retests et opportunités de retour à la moyenne. FONCTIONNALITÉS CLÉS Ancrage aux sw
In the Forex trading system, the Pivot Points trading method is a classic trading strategy. Pivot Points is a very simple resistance support system. Based on yesterday’s highest, lowest and closing prices, seven price points are calculated, including one pivot point, three resistance levels and three support levels. The resistance line and the support line are one of the tools that are often used in technical analysis, and the role of the support line and the pressure line can be mutually trans
HorizonMT5
Lasse Mathias Baagoe S Christensen
How to Read Horizon Horizon is designed to give you a structured overview of the market from one H1 chart. The multi-timeframe dashboard allows you to compare direction across: M5 M15 M30 H1 H4 D1 This makes it easier to see whether shorter and higher timeframes are generally aligned or showing mixed conditions. The two moving averages provide additional directional context directly on the chart, while Previous Day High and Previous Day Low provide important daily reference levels. The session d
FREE
L'indicateur Projection par BCB Elevate est un outil complet et professionnel d'analyse de la structure du marché et de suivi de tendance. Conçu pour les traders manuels, il combine un filtrage de la macro-tendance (EMA 100), des trailing stops dynamiques basés sur l'ATR et le suivi des pivots Swing High/Low pour fournir des signaux de graphique très précis. Plutôt que de repaint ou d'encombrer votre graphique, l'indicateur Projection attend l'alignement strict des conditions avant de tracer les
Read detailed blogpost here: https://www.mql5.com/en/blogs/post/772233 Features at a Glance Linear regression center line with statistically accurate curved deviation bands Three band calculation modes: RMA of High-Low Range, Standard Deviation, and True ATR Candle coloring in two modes: Heatmap (position inside the bands) and Volume-Weighted Colored Bars (VWCB) Straight regression channel (Channel 1) with up to 3 deviation levels Future projection channel (Channel 2) with optional Higher Timef
SX Sessions
Nikolett Gorjanacz Toth
SX Sessions draws the Asia, London and New York sessions as clean boxes on your chart, with the daily open and the high and low of the previous day. The session times follow the clock changes in summer and winter by themselves, so the boxes stay in the right place all year.  What you get: - Asia, London and New York boxes from the session high to the session low, with a light fill and the session name - The running session is drawn with a dashed border and grows with the price - Asia: its size
FREE
Send me a message so I can send you the setfile Robot robuste avec plusieurs configurations disponibles, À utiliser avec BTC sur une période de 10 minutes avec les paramètres de la capture d'écran ci-dessous. Lors de l'achat du robot expert, vous avez le droit de demander des modifications pour continuer à améliorer le robot. Caractéristiques principales Stratégie de croisement de moyennes mobiles : L'EA utilise deux moyennes mobiles (MA1 et MA2) pour générer des signaux de trading. Un cro
H4 CONTAINER MTF BOXES (MetaTrader 5)                           | //|                                                                  | //|  One H4 container box holds every H1, M30, M15, M5 and M1 box    | //|  that falls inside it. Each inner timeframe has its own on/off   | //|  switch.                                                         | //|                                                                  | //|  LEVELS                                                          | //|   
FREE
Slipstream
Octavian Doica
Slipstream is a trend-following expert advisor for   EURUSD H1 . It enters on a fast/slow SMA crossover confirmed by RSI momentum, and compounds aggressively, using   martingale-style lot scaling   to recover after a losing trade. Backtest 2020–2026 (1:500, $1,000 start, 99% history quality):   81 trades, 100% win rate, profit factor 12.1, +$132k net , Sharpe 1.86. Pair:  EURUSD - H1; Minimum initial deposit: $100; Leverage: 1:500; Recommended brokers: IC Markets, Fusion Markets, Dukascopy, FP M
FREE
Overview The Momentum Burst AI Engine is a fully automated, high-frequency breakout trading system engineered for MetaTrader 5. Designed with quantitative precision, the algorithm continuously monitors market volatility across a dynamic lookback period to capture explosive price movements. Once a high-probability breakout is detected, the system executes the trade and immediately activates a proprietary Global Lock Mechanism, ensuring strict risk control and preventing overlapping or redundant e
Les acheteurs de ce produit ont également acheté
Trend Sniper X
Sarvarbek Abduvoxobov
4.86 (43)
Trend Sniper X est un indicateur de suivi de tendance multi-unités de temps pour MetaTrader 5 qui aide les traders à identifier la direction de la tendance et les points d'inversion potentiels avec clarté et précision. pour MT4: https://www.mql5.com/en/market/product/193245 Informations sur le prix : Le prix actuel est un prix promotionnel et est susceptible de changer lors des prochaines mises à jour et nouvelles fonctionnalités. Offre bonus : Pour obtenir GRATUITEMENT l'Auto-Trade Assistant E
Smart Trend Trading System — MetaTrader 5 Après votre achat, envoyez-moi un message sur MQL5 pour recevoir GRATUITEMENT Smart Universal Expert Advisor, ainsi que le cours en ligne, le manuel PDF et l’accès au groupe privé. STTS réunit la direction de la tendance, les signaux d’entrée et de sortie, les zones de retournement et les niveaux de prix importants directement sur votre graphique. Suivez le système manuellement ou connectez un EA compatible distinct pour une exécution automatique selon l
Un nouveau Roi en ville - Indicateur + Gestion des ordres (TP1 + TP2 + TP3) + Envoi optionnel de signaux Telegram INCLUS (GRATUIT) (SYSTÈME COMPLET DE TRADING et DE SIGNAUX) Notre meilleur EA pour l’Or : Gold Slayer Cet indicateur inclut une stratégie avancée, un système de trading avec gestion des ordres personnalisable ainsi qu’un système de retour à la moyenne combinant des extensions d’enveloppes, soutenu par plusieurs filtres intelligents de confirmation comme le RSI afin de détecter des en
Zoryk Gold
Reda El Koutbane
4.78 (18)
ZORYK — Système avancé de signaux XAUUSD pour MetaTrader 5 Vous connaissez certainement cette sensation. Vous passez du temps à analyser l’or. Vous attendez le bon point d’entrée. Vous ouvrez enfin la position, puis le prix commence immédiatement à évoluer contre vous. Vous fermez trop tôt, déplacez le Stop Loss ou hésitez pendant quelques secondes. Ensuite, le marché atteint exactement l’objectif que vous aviez initialement prévu, mais sans vous dans la position. Le problème n’était pas toujour
Gardez votre avantage de trading dans votre ligne de mire ! M5 Sniper est un nouvel indicateur de MeanFX. Il combine des signaux de trading précis avec des niveaux de TP/SL adaptatifs — créant ainsi les meilleures opportunités de trading statistiques possibles ! Le prix augmente tous les 5 achats, le prochain prix est de 69$ Envoyez-moi un message après l’achat pour recevoir des conseils/un guide et un EA bonus Qu’est-ce qui le distingue ? Performance statistique éprouvée sur Gold XAUUSD ( fonct
SuperScalp Pro
Van Minh Nguyen
4.54 (37)
SuperScalp Pro - Professional Multi-Layer Confluence Scalping System SuperScalp Pro est un indicateur de scalping avancé qui améliore le Supertrend classique grâce à plusieurs filtres intelligents de confirmation. Il vous aide à identifier des opportunités de trading Buy/Sell présentant une probabilité de réussite plus élevée, tout en réduisant considérablement les faux signaux. Des flèches Buy et Sell bien visibles apparaissent directement sur le graphique, avec des niveaux de Stop Loss et de T
En 2019, j'ai montré au monde entier ce dont cet indicateur est capable. J'ai tradé ses signaux manuellement, sur un compte réel, en toute transparence — le compte était suivi sur Myfxbook, et je relatais cette expérience en détail sur Facebook. Résultat : en quatre mois, 10 000 dollars sont devenus 941 411. Le risque était délibérément extrême — le drawdown allait jusqu'à 54 %, car dans notre métier, le profit et le risque vont toujours de pair. La capture d'écran de Myfxbook est la première im
ULTRA est un indicateur technique « tout-en-un » : il analyse le marché de manière autonome, génère des signaux de trading, affiche les niveaux permettant de définir des ordres stop-loss et suggère le moment opportun pour clôturer les positions afin de sécuriser les bénéfices ou de minimiser les pertes. En d'autres termes, peu importe que vous ne sachiez pas analyser le marché, déterminer les niveaux (où placer votre stop-loss) ou que vous ayez du mal à gérer votre capital. ULTRA s'occupera de t
SMC Intraday Formula
VividMind Digital Solutions
5 (26)
Commençons par être honnêtes. Aucun indicateur ne vous rendra rentable à lui seul. Si quelqu’un vous dit le contraire, il vous vend un rêve. Tout indicateur qui affiche des flèches parfaites d’achat/vente peut être rendu impeccable — il suffit de zoomer sur la bonne partie de l’historique et de capturer uniquement les trades gagnants. Nous ne faisons pas cela.  SMC Intraday Formula est un outil. Il lit la structure du marché pour vous, identifie les zones de prix à la probabilité la plus élevée
GoldenX Entry MT5
VividMind Digital Solutions
5 (17)
GoldenX Entry est un indicateur MT5 doté d’un algorithme adaptatif Smart Entry Trend, d’un système de scoring des signaux, d’un détecteur de régime de marché et d’un filtre de volatilité. Chaque signal inclut un niveau d’entrée calculé, trois niveaux de Take-Profit (TP1, TP2, TP3) ainsi qu’un niveau de Stop-Loss. Il est construit sur plusieurs couches analytiques conçues pour s’adapter à différentes conditions de marché, combinant un système analytique multicouche avec un optimiseur intégré et u
M1 Sniper MT5
Oleg Rodin
5 (7)
M1 SNIPER   est un système d'indicateurs de trading facile à utiliser. Il s'agit d'un indicateur à flèche conçu pour l'unité de temps M1. Cet indicateur peut être utilisé seul pour le scalping sur l'unité de temps M1 ou intégré à votre système de trading existant. Bien que conçu spécifiquement pour le trading sur l'unité de temps M1, ce système peut également être utilisé avec d'autres unités de temps. Initialement, j'avais conçu cette méthode pour le trading du XAUUSD et du BTCUSD. Cependant, j
Gann Made Easy   est un système de trading Forex professionnel et facile à utiliser qui est basé sur les meilleurs principes de trading en utilisant la théorie de mr. WD Gann. L'indicateur fournit des signaux d'ACHAT et de VENTE précis, y compris les niveaux Stop Loss et Take Profit. Vous pouvez échanger même en déplacement en utilisant les notifications PUSH. VEUILLEZ ME CONTACTER APRÈS L'ACHAT POUR RECEVOIR GRATUITEMENT DES INSTRUCTIONS DE TRADING ET D'EXCELLENTS INDICATEURS SUPPLÉMENTAIRES! V
Auto Optimized SpeedAngle est un système de vectorisation du momentum de niveau institutionnel qui élimine l'ajustement de courbe ( curve-fitting ) grâce à une optimisation continue par avancement ( Walk-Forward Optimization , WFO). Plutôt que de s'appuyer sur des entrées statiques qui se dégradent lorsque les régimes de marché changent, l'indicateur recalibre dynamiquement ses paramètres en utilisant une validation hors échantillon ( Out-of-Sample , OOS), garantissant ainsi que les signaux affi
Boba Analysis Suite
Trade Ready Solutions LLC
5 (2)
Boba Analysis Suite Boba Analysis Suite est un indicateur d’analyse pour MetaTrader 5. Il réunit la structure du marché, les zones de prix pertinentes et le contexte général du marché dans une même vue graphique. Développé à partir de l’expérience pratique d’un trader et formateur en trading, il accompagne une démarche d’analyse structurée : évaluer la direction du marché, identifier les niveaux importants et analyser plusieurs unités de temps conjointement. Une analyse en contexte La significat
Indicateur de force et de momentum multi-devises MT5 Dynamic Forex28 Navigator est l'évolution de nos indicateurs populaires de longue date et réunit la puissance de trois outils en un : Advanced Currency Strength28 Indicator (700 avis) Advanced Currency IMPULSE with ALERT (530 avis) CS28 Combo Signals (bonus actuel) Les deux indicateurs précédents totalisent plus de 1 200 avis sur le MQL5 Market et font partie des outils incontournables de la communauté MT4 depuis 2016. Dynamic Forex28 Navigato
Prochaine mise à jour — Version 2.52 bientôt disponible ! [NOUVEAU] Préparez-vous à découvrir 4 nouvelles fonctionnalités majeures conçues pour améliorer votre analyse du marché et votre flux de travail de trading Nous faisons passer l’analyse du marché au niveau supérieur avec 4 nouvelles fonctionnalités conçues pour répondre à vos besoins en trading. Découvrez : 1. TRADE OVERVIEW DASHBOARD 2. CONFLUENCE AT ZONE 3. STRONG & WEAK HIGH/LOW 4. OTE 1. TRADE OVERVIEW DASHBOARD Un tableau de bord qu
Gold Trend Coach MT5
Cristhian Alexander Gaibor Cuasquer
5 (3)
Gold Trend Coach est un indicateur de tendance pour l'or (XAUUSD) sur MetaTrader 5 avec des signaux d'achat et de vente, un stop loss et trois objectifs de take profit, confirmés à la clôture de la bougie, un tableau de bord coach multi-unités de temps et des alertes sur votre téléphone et sur Telegram. Conçu pour le scalping en M5 et l'intraday en M15 pendant les sessions de Londres et de New York. Gold Trend Coach : signaux de tendance sur l'or XAUUSD avec entrée, stop et trois objectifs. Prix
Atomic Analyst MT5
Issam Kassas
4.5 (64)
Atomic Analyst — MetaTrader 5 Après votre achat, envoyez-moi un message sur MQL5 pour recevoir GRATUITEMENT Smart Universal Expert Advisor, ainsi que le cours en ligne, le manuel PDF et l’accès au groupe privé. Atomic Analyst réunit l’action des prix, la direction de la tendance, les signaux d’entrée et de sortie, le Stop Loss et plusieurs niveaux de Take Profit directement sur votre graphique. REPÉREZ LE SIGNAL. COMPRENEZ LA CONFIGURATION. Atomic Analyst présente son analyse sous forme d’inform
FiboSniper Pro
Van Minh Nguyen
5 (4)
FiboSniper Pro – Multi-Filter Fibonacci System with Auto SL/TP and Control Panel FiboSniper Pro est un indicateur technique qui combine des Fibonacci Envelopes dynamiques avec plusieurs filtres de confirmation afin de générer des signaux Buy et Sell sélectionnés. Les niveaux de Fibonacci sont calculés à partir de Moving Average et ATR, puis filtrés par ADX, EMA, RSI, ATR, Volume, Time et la structure des bougies. L’indicateur affiche directement sur le graphique les niveaux automatiques de Stop
Zain Gold Scalping
Ahmed Gamal Abdel Nasser Mohamed
A complete price-action analysis tool built around dual independent entry logic, each confirmed against a volatility band, combined with a configurable set of nine optional confirmation filters that let you shape exactly how conservative or aggressive the tool's signals behave. Core Strategy Two independent entry setups, each triggering only when price moves outside a dynamic volatility band — giving two distinct ways to spot potential reversal points, which can be used together or separately.
Tokyo mt5 Indicator
Vasiliy Strukov
5 (13)
Le Tokyo Indicator offre une vue d'ensemble visuelle et claire de l'orientation de la tendance, des signaux de trading potentiels et des conditions du marché. Sa ligne de tendance en escalier, codée par couleur, distingue les phases haussières (en bleu) des phases baissières (en magenta). Des flèches directionnelles associées mettent en évidence les opportunités d'achat et de vente potentielles lors des changements de tendance. Un tableau de bord intégré regroupe le signal actuel, l'orientation
Power Candles MT5
Daniel Stein
4.58 (12)
Power Candles V3 - Indicateur de force à optimisation automatique Power Candles V3 transforme la force des devises et des instruments en un plan de trading exploitable sur chaque graphique auquel il est associé. Au lieu de se contenter de colorer les bougies, il effectue une optimisation automatique en temps réel en arrière-plan et vous fournit les meilleurs niveaux de Stop Loss, Take Profit et seuils de signal pour le symbole que vous avez sous les yeux. Un simple clic suffit pour l'adopter en
Quantum TrendPulse
Bogdan Ion Puscasu
5 (26)
Présentation de   Quantum TrendPulse   , l'outil de trading ultime qui combine la puissance de   SuperTrend   ,   RSI   et   Stochastic   dans un seul indicateur complet pour maximiser votre potentiel de trading. Conçu pour les traders qui recherchent précision et efficacité, cet indicateur vous aide à identifier les tendances du marché, les changements de dynamique et les points d'entrée et de sortie optimaux en toute confiance. Caractéristiques principales : Intégration SuperTrend :   suivez f
Adaptive Price Action Engine Achetez un indicateur, obtenez l'EA gratuitement Analyse auto-optimisée des tendances et des figures de chandeliers Multi-Timeframe Les marchés évoluent constamment, et tous les modèles de Price Action n’ont pas la même valeur dans toutes les conditions de marché. Adaptive Price Action Engine a été conçu pour s’adapter aux changements du marché en combinant structure de tendance, analyse Multi-Timeframe, figures de chandeliers et optimisation statistique au sein d’un
Trend Catcher ind mt5
Ramil Minniakhmetov
5 (18)
INDICATEUR DE DÉTECTEUR DE TENDANCE L'indicateur de détecteur de tendance analyse les mouvements de prix du marché grâce à une combinaison d'indicateurs d'analyse de tendance adaptatifs, propriétaires et personnalisés. Il identifie la véritable direction du marché en filtrant les fluctuations à court terme et en se concentrant sur la force de la dynamique sous-jacente, l'expansion de la volatilité et la structure des prix. Il utilise également une combinaison d'indicateurs personnalisés de lis
Superhero
Ihor Otkydach
5 (3)
L'indicateur SUPERHERO est un système de trading multidevises conçu selon un principe « tout compris ». Cet indicateur analyse le marché de manière autonome et fournit des signaux indiquant quand ouvrir et clôturer des positions. Il utilise des ordres Stop Loss et Take Profit. Le rapport R:R est de 1:1. Ce système peut envoyer des notifications push sur votre smartphone, ce qui vous permet de passer des ordres « où que vous soyez », sans avoir à rester devant un ordinateur. C'est la solution idé
Neuro Poseidon MT5
Daria Rezueva
4.75 (52)
Neuro Poseidon is a new indicator by Daria Rezueva. It combines precise trading signals with adaptive TP/SL levels - creating best possible trades as a result! Message me and get  Neuro Poseidon Assistant  as a gift to automize your trading process! What makes it stand out? 1. Proven profitability on all assets and timeframes 2. Only confirmed BUY and SELL signals present on the chart 3. Adaptive TP & SL levels generated by the software for each trade 4. Easy to understand - suitable for al
Azimuth Pro
Ottaviano De Cicco
5 (7)
Azimuth Pro V2: Synthetic Fractal Structure and Confirmed Entries for MT5 Overview Azimuth Pro is a multi-level swing structure indicator by Merkava Labs . Four nested swing layers, swing-anchored VWAP, ABC pattern detection, three-timeframe structural filtering, and closed-bar confirmed entries — one chart, one workflow from micro-swings to macro-cycles. This is not a blind signal product. It is a structure-first workflow for traders who care about location, context, and timing. Halloween P
Break and Retest Hunter is a powerful MetaTrader 5 indicator designed to automatically identify support and resistance levels, breakout structures, and potential retest opportunities in real time. Bonus Indicator: After purchasing Break and Retest Hunter , contact me to receive Trade Indicator Assistant EA completely free as a bonus utility. $65 for the next 10 copies . Next price is $120.  Combining adaptive market analysis, clear BUY/SELL signals, Fibonacci-based profit targets, and a premiu
Unix Scalper
Issam Kassas
4 (4)
Unix Scalper — MetaTrader 5 Après votre achat, envoyez-moi un message sur MQL5 pour recevoir GRATUITEMENT Smart Universal Expert Advisor, ainsi que le cours en ligne, le manuel PDF et l’accès au groupe privé. Repérez la configuration. Consultez le plan. Choisissez comment intervenir. UNIX Scalper réunit l’analyse du marché, les décisions BUY/SELL/WAIT et les niveaux Entry, Stop Loss, TP1 et TP2 dans un panneau organisé. VISUALISEZ LE SIGNAL ET LE PLAN • Des décisions claires : BUY, SELL ou WAIT.
Plus de l'auteur
CRT Pro Scanner
Frank Jose Olivo Flores
CRT Pro Scanner   Stop wasting hours watching multiple charts and missing setups while you blink. CRT Pro Scanner solves the most painful problem every trader faces: being in the wrong chart at the right moment. Instead of jumping between pairs and constantly asking yourself "did I miss something?", the scanner does the watching for you. It monitors all your symbols simultaneously, detects Candle Range Theory setups the instant they form, and alerts you immediately — so you can focus on executi
CRT Pro Scanner MT4
Frank Jose Olivo Flores
CRT Pro Scanner   Stop wasting hours watching multiple charts and missing setups while you blink. CRT Pro Scanner solves the most painful problem every trader faces: being in the wrong chart at the right moment. Instead of jumping between pairs and constantly asking yourself "did I miss something?", the scanner does the watching for you. It monitors all your symbols simultaneously, detects Candle Range Theory setups the instant they form, and alerts you immediately — so you can focus on executi
VWAP Trend Dashboard
Frank Jose Olivo Flores
VWAP Trend Dashboard  What It Does Displays a compact dashboard on any MT5 chart showing the VWAP-based bias for up to 5 symbols simultaneously. For each symbol it checks the current price against four VWAP levels and summarises the overall directional bias in a single Trend column. Dashboard Columns Symbol: Your custom display label  NY VWAP: VWAP anchored at NY session open today  Day VWAP :   VWAP anchored at 00:00 server time today  LOD :   VWAP anchored from today's Low-of-Day bar forw
Opening Range Pro MT4
Frank Jose Olivo Flores
Opening Range Pro WHAT DOES THIS INDICATOR DO? The Opening Range indicator marks the highest and lowest price reached during a specific time window that you define (for example, the first 15 minutes of the New York session). Once that window closes, it draws two horizontal lines — one at the high and one at the low — extending across the rest of the trading day, so you can see at a glance whether price is above or below the range, and use those levels as reference for your trading decisions.
Draws high of the day and low of the day anchored VWAPs for multiple days.                   DaysBack = Today only, today + 1 day back, today + 2 days back...               Today recalculates live                             Historical days are computed ONCE and frozen (static).                Colors tab shows exactly 2 entries:                                  High of the day VWAP color  (default: Green)                                   Low of the day VWAP color  (default: Red)               
HOW TO USE                                                       1. Drag the indicator onto any chart.                            2. Set AnchorDate (YYYY.MM.DD) and AnchorTime (HH:MM) to the        bar where you want the VWAP to start calculating from.        3. The VWAP line and up to 3 standard deviation bands will          appear from that anchor point to the current bar.             MULTIPLE INSTANCES                                                Set a different IndicatorID (e.g. 1, 2, 3
VWAP Trend Dashboard MT4
Frank Jose Olivo Flores
# VWAP Trend Dashboard  --- ## What It Does Displays a compact dashboard on any MT5 chart showing the **VWAP-based bias** for up to **5 symbols simultaneously**. For each symbol it checks the current price against four VWAP levels and summarises the overall directional bias in a single Trend column. --- ## Dashboard Columns | Column | What It Means | |---|---| | **Symbol** | Your custom display label | | **NY VWAP** | VWAP anchored at NY session open today | | **Day VWAP** | VWAP anchored
Trading Stats MT4
Frank Jose Olivo Flores
Stop wasting time digging through MT4/MT5 account statements to understand how your trading is performing. The Trading Stats Indicator puts every number you need — Win Rate, Avg Profit, Avg Loss, Risk:Reward Ratio, Expected Value, and Total Profit — right on the chart, updated live with every tick. Why Trading Stats Exists? Every serious trader eventually asks the same questions at the end of a session: How many trades did I take today? What was my average winner versus my average loser? Do I a
CRT Pro WHAT PROBLEM DOES CRT PRO SOLVE? --------------------------------- When trading on low timeframes such as M1, M5, M15 or M30, it is easy to lose sight of the broader market structure. CRT Pro solves this  by overlaying H1 candles and H4 High/Low range lines directly behind your  low timeframe chart, in real time, so you always know where the higher timeframe market structure sits relative to current price — without switching charts or opening multiple windows. -----------------------
Gold Bull Pro MT4
Frank Jose Olivo Flores
Gold Bull Pro is an automated trading system engineered specifically for trading Gold (XAUUSD) on the 1-Hour (H1) timeframe. The strategy operates exclusively on a Long-only basis, capturing bullish breakout momentum by identifying key structural price highs. By focusing solely on upside momentum in the Gold market, the Expert Advisor avoids short-side market noise during strong long-term Precious Metals trends. Trading Strategy The Expert Advisor monitors market structure and places Buy Stop pe
Draws high of the day and low of the day anchored VWAPs for multiple days.                   DaysBack = Today only, today + 1 day back, today + 2 days back...               Today recalculates live                             Historical days are computed ONCE and frozen (static).                Colors tab shows exactly 2 entries:                                  High of the day VWAP color  (default: Green)                                   Low of the day VWAP color  (default: Red)               
Trading Stats
Frank Jose Olivo Flores
Stop wasting time digging through MT4/MT5 account statements to understand how your trading is performing. The Trading Stats Indicator puts every number you need — Win Rate, Avg Profit, Avg Loss, Risk:Reward Ratio, Expected Value, and Total Profit — right on the chart, updated live with every tick. Why Trading Stats Exists? Every serious trader eventually asks the same questions at the end of a session: How many trades did I take today? What was my average winner versus my average loser? Do I a
CRT Pro WHAT PROBLEM DOES CRT PRO SOLVE? --------------------------------- When trading on low timeframes such as M1, M5, M15 or M30, it is easy to lose sight of the broader market structure. CRT Pro solves this  by overlaying H1 candles and H4 High/Low range lines directly behind your  low timeframe chart, in real time, so you always know where the higher timeframe market structure sits relative to current price — without switching charts or opening multiple windows. -----------------------
Gold Bull Pro
Frank Jose Olivo Flores
Gold Bull Pro is an automated trading system engineered specifically for trading Gold (XAUUSD) on the 1-Hour (H1) timeframe. The strategy operates exclusively on a Long-only basis, capturing bullish breakout momentum by identifying key structural price highs. By focusing solely on upside momentum in the Gold market, the Expert Advisor avoids short-side market noise during strong long-term Precious Metals trends. Trading Strategy The Expert Advisor monitors market structure and places Buy Stop pe
Filtrer:
Aucun avis
Répondre à l'avis