Multi Time Frame HIgh Low
- インディケータ
- バージョン: 2.0
- アップデート済み: 12 5月 2026
- アクティベーション: 5

Higher Timeframe Levels • Clear Market Structure
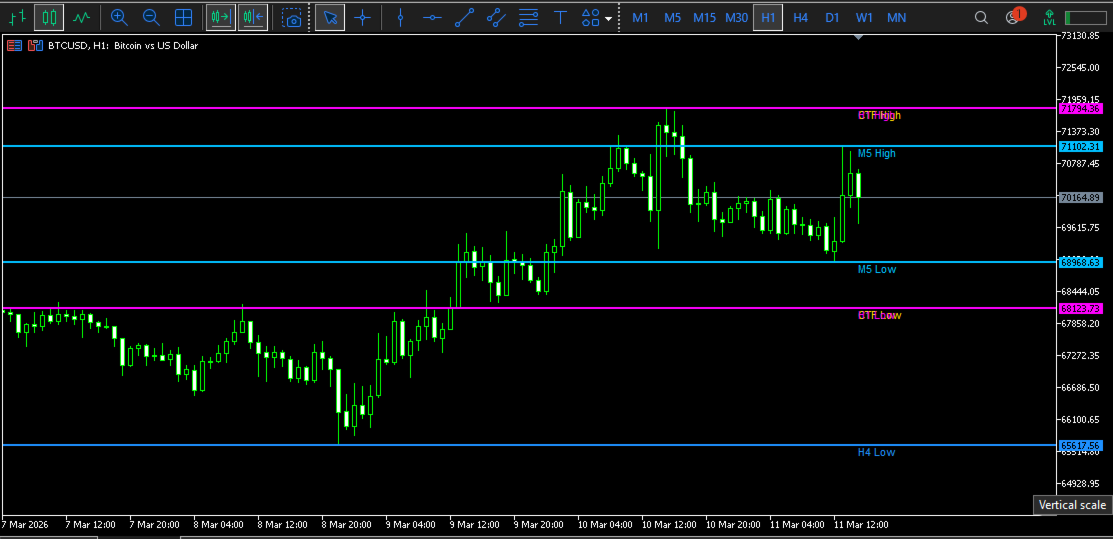
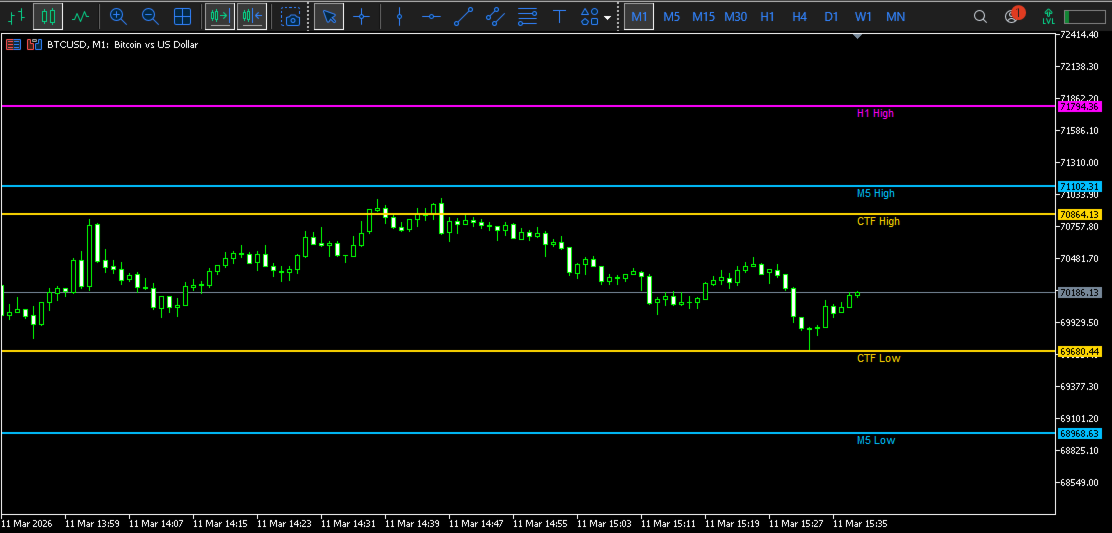
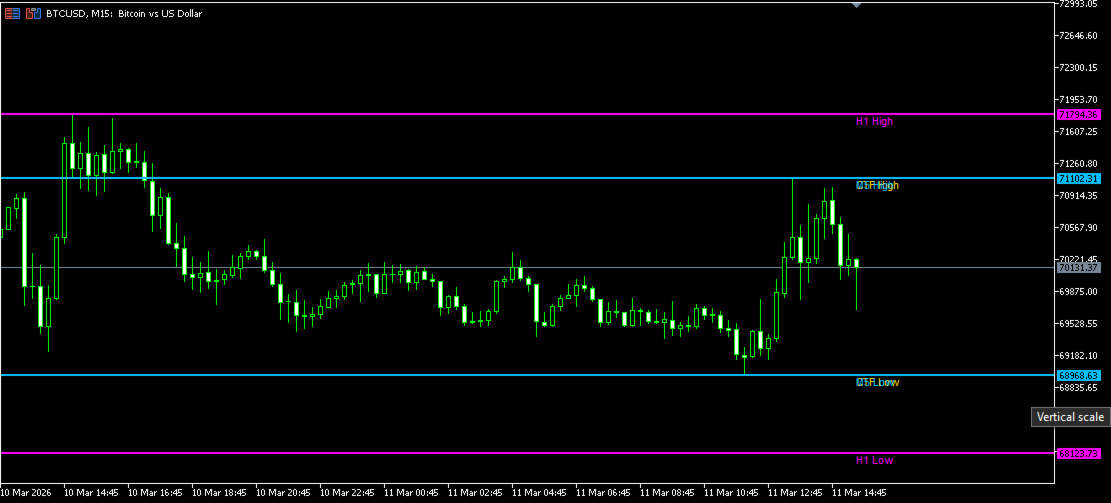
Multi Time Frame High Low is a trading indicator designed to display key high and low price levels from higher timeframes directly on the current chart. These levels often represent areas where price previously reacted, making them useful for identifying support, resistance, breakout zones, and liquidity areas.
By visualizing higher timeframe levels without switching charts, the indicator helps traders analyze broader market structure more efficiently.
Core Concept
The indicator plots important highs and lows from selected higher timeframes onto the active chart:
- Highlights previous reaction levels
- Supports multi-timeframe analysis
- Helps identify key market structure zones
These levels can assist in understanding price behavior and potential market direction.
Key Features
- Displays higher timeframe High and Low levels
- Supports multiple timeframe selection
- Identifies support and resistance zones
- Useful for breakout and reaction analysis
- Clean and lightweight chart display
- Fully customizable visual settings
- Works on all symbols and timeframes
- Optimized for stable performance on MetaTrader 5
How It Works
The indicator reads historical price data from selected higher timeframes and plots their high and low levels on the current chart.
This helps traders identify:
- Potential reaction zones
- Breakout levels
- Market structure points
- Liquidity areas
All information is presented directly on the chart for faster analysis.
Customization
Flexible settings allow you to adjust the indicator to your preferences:
- Select higher timeframes to display
- Customize line color and style
- Adjust line width
- Enable or disable specific timeframe levels
Recommended Usage
Suitable for multiple trading approaches:
- Price action analysis
- Support and resistance trading
- Breakout strategies
- Trend-following systems
Key Advantages
- Simplifies multi-timeframe analysis
- Reduces the need to switch between charts
- Improves chart clarity and decision speed
- Adaptable to different trading styles
Important Information
Trading involves risk, and losses are possible.
This indicator does not guarantee profits.
It is intended for technical analysis purposes only. Users are encouraged to test the indicator on a demo account before using it in live trading.
Conclusion
Multi Time Frame High Low provides a structured and efficient way to visualize higher timeframe levels on a single chart. It is designed for traders who want clearer market context and improved decision-making without added complexity.