Separating Lines Trading System
- インディケータ
- バージョン: 1.0
- アクティベーション: 10

Separating Lines Trading System for MetaTrader 5
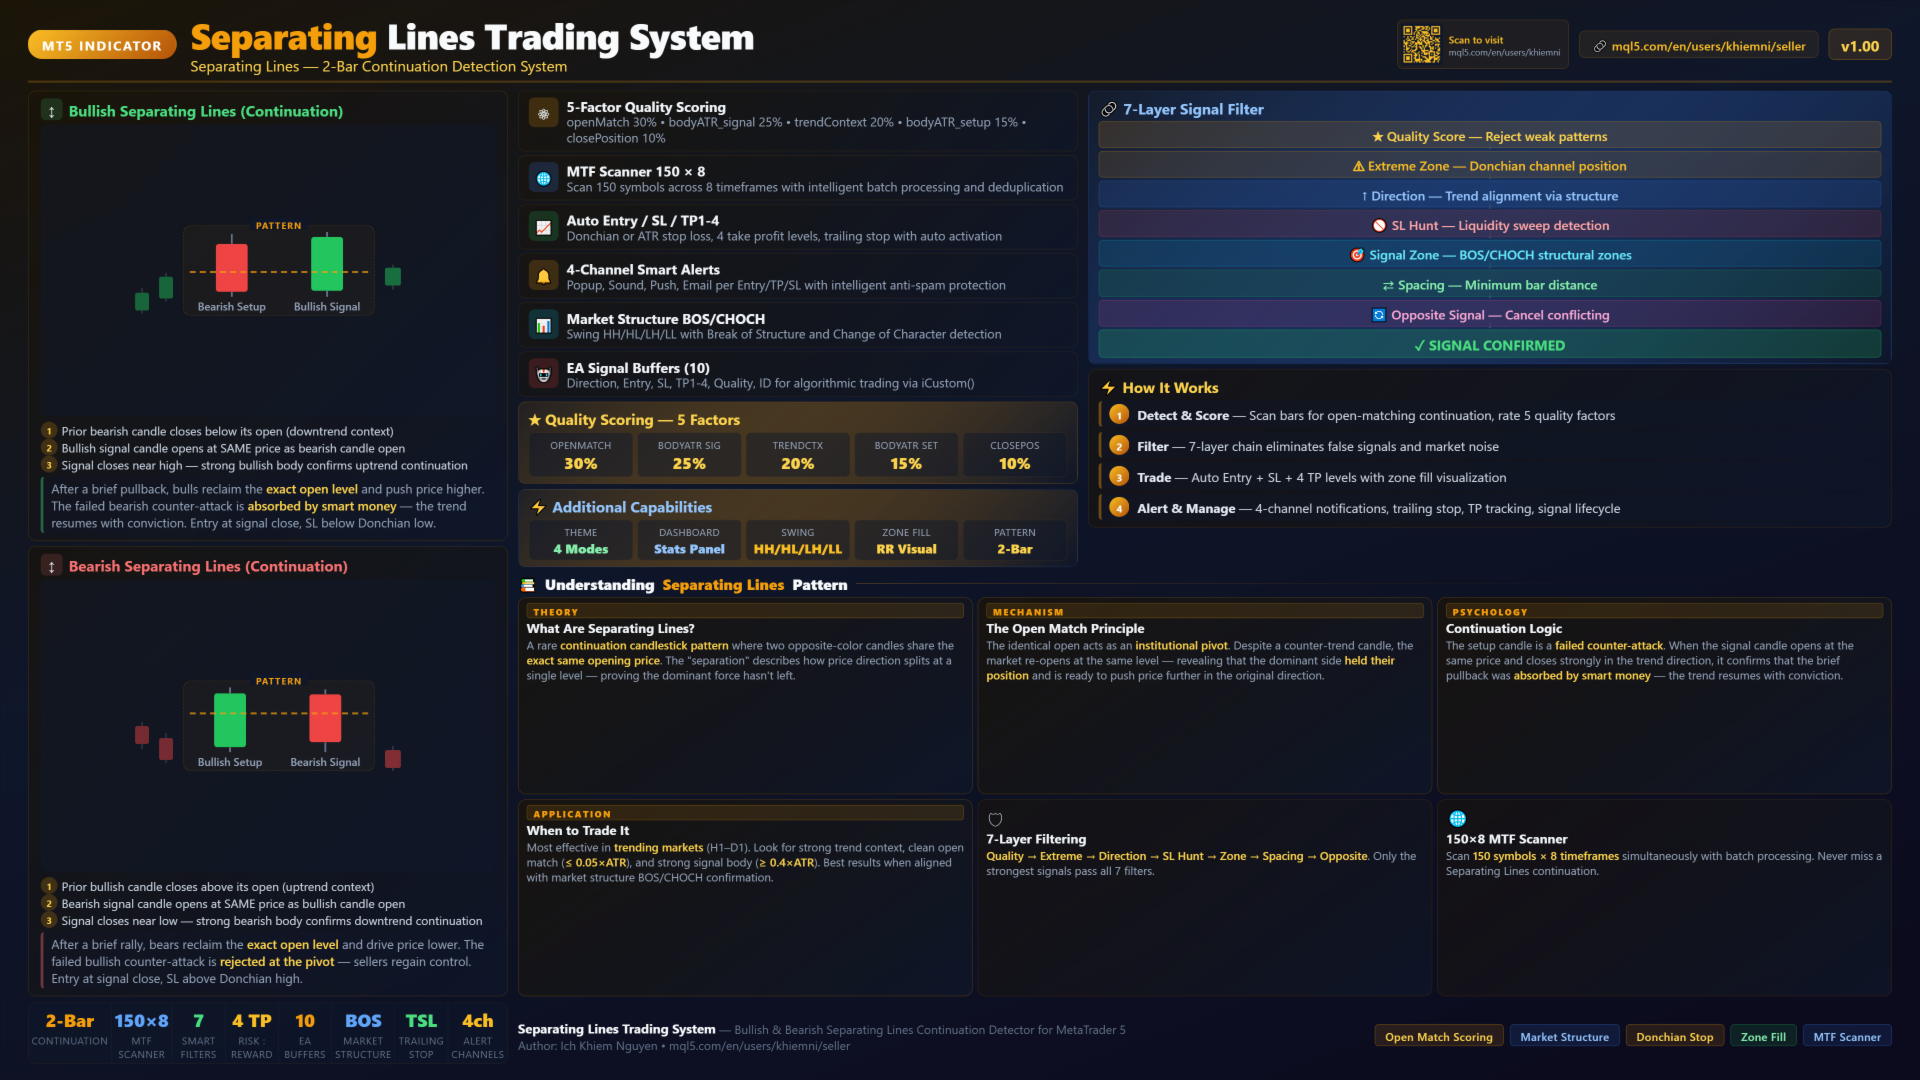
Separating Lines Trading System is a price action indicator for MT5 designed to detect 2-bar continuation patterns where both candles share the same opening level and the second candle resumes the prevailing trend.
A detailed user guide is available on the author’s MQL5 Blog.
Additional updates are available through the author’s MQL5 Channel.
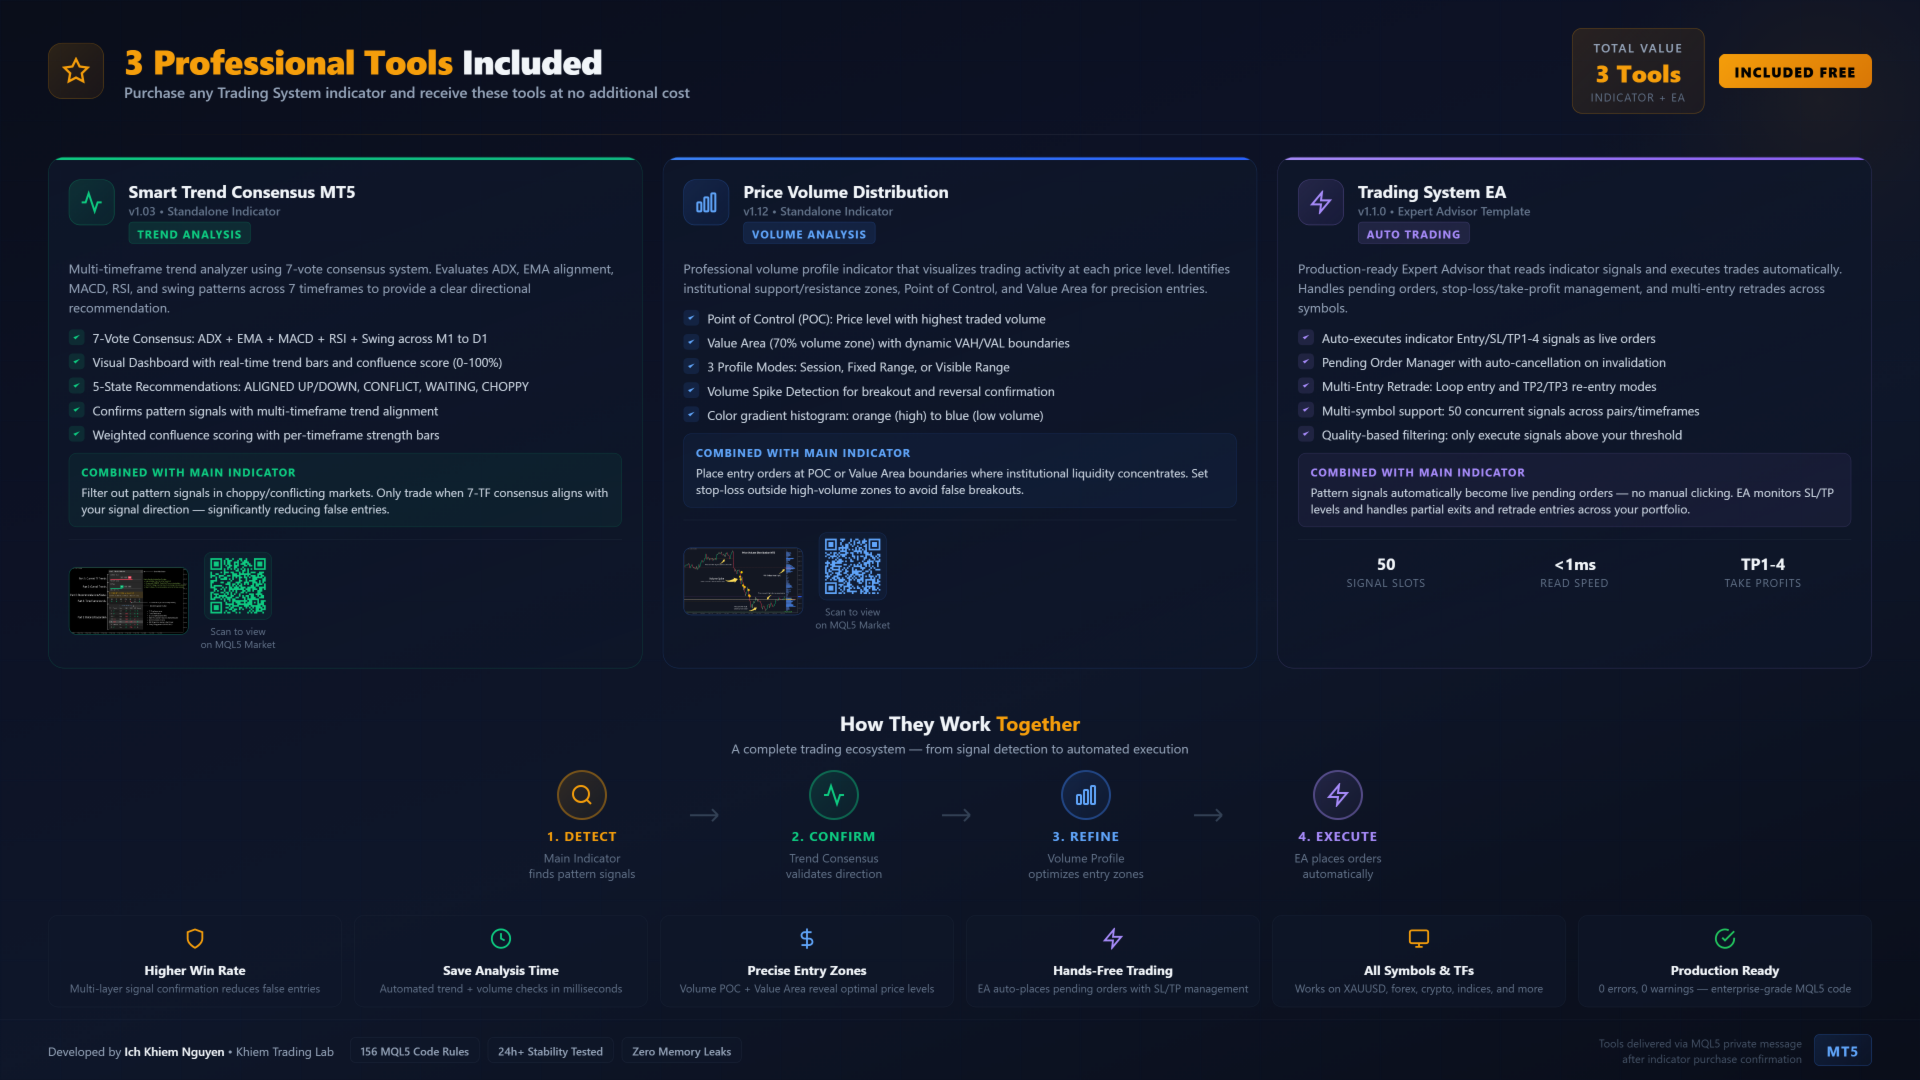
Depending on the current support policy, buyers may receive additional access to selected companion tools developed by the author.
Overview
Separating Lines Trading System detects two-candle continuation structures in which a countertrend setup candle is followed by a trend-resuming signal candle that opens at the same price as the setup candle.
This pattern can be used to identify trend continuation after a temporary pullback returns to a key reference level and then resumes directional pressure.
All calculations are based on completed bars only.
Detection is non-repainting. Signal values do not change after the bar is closed.
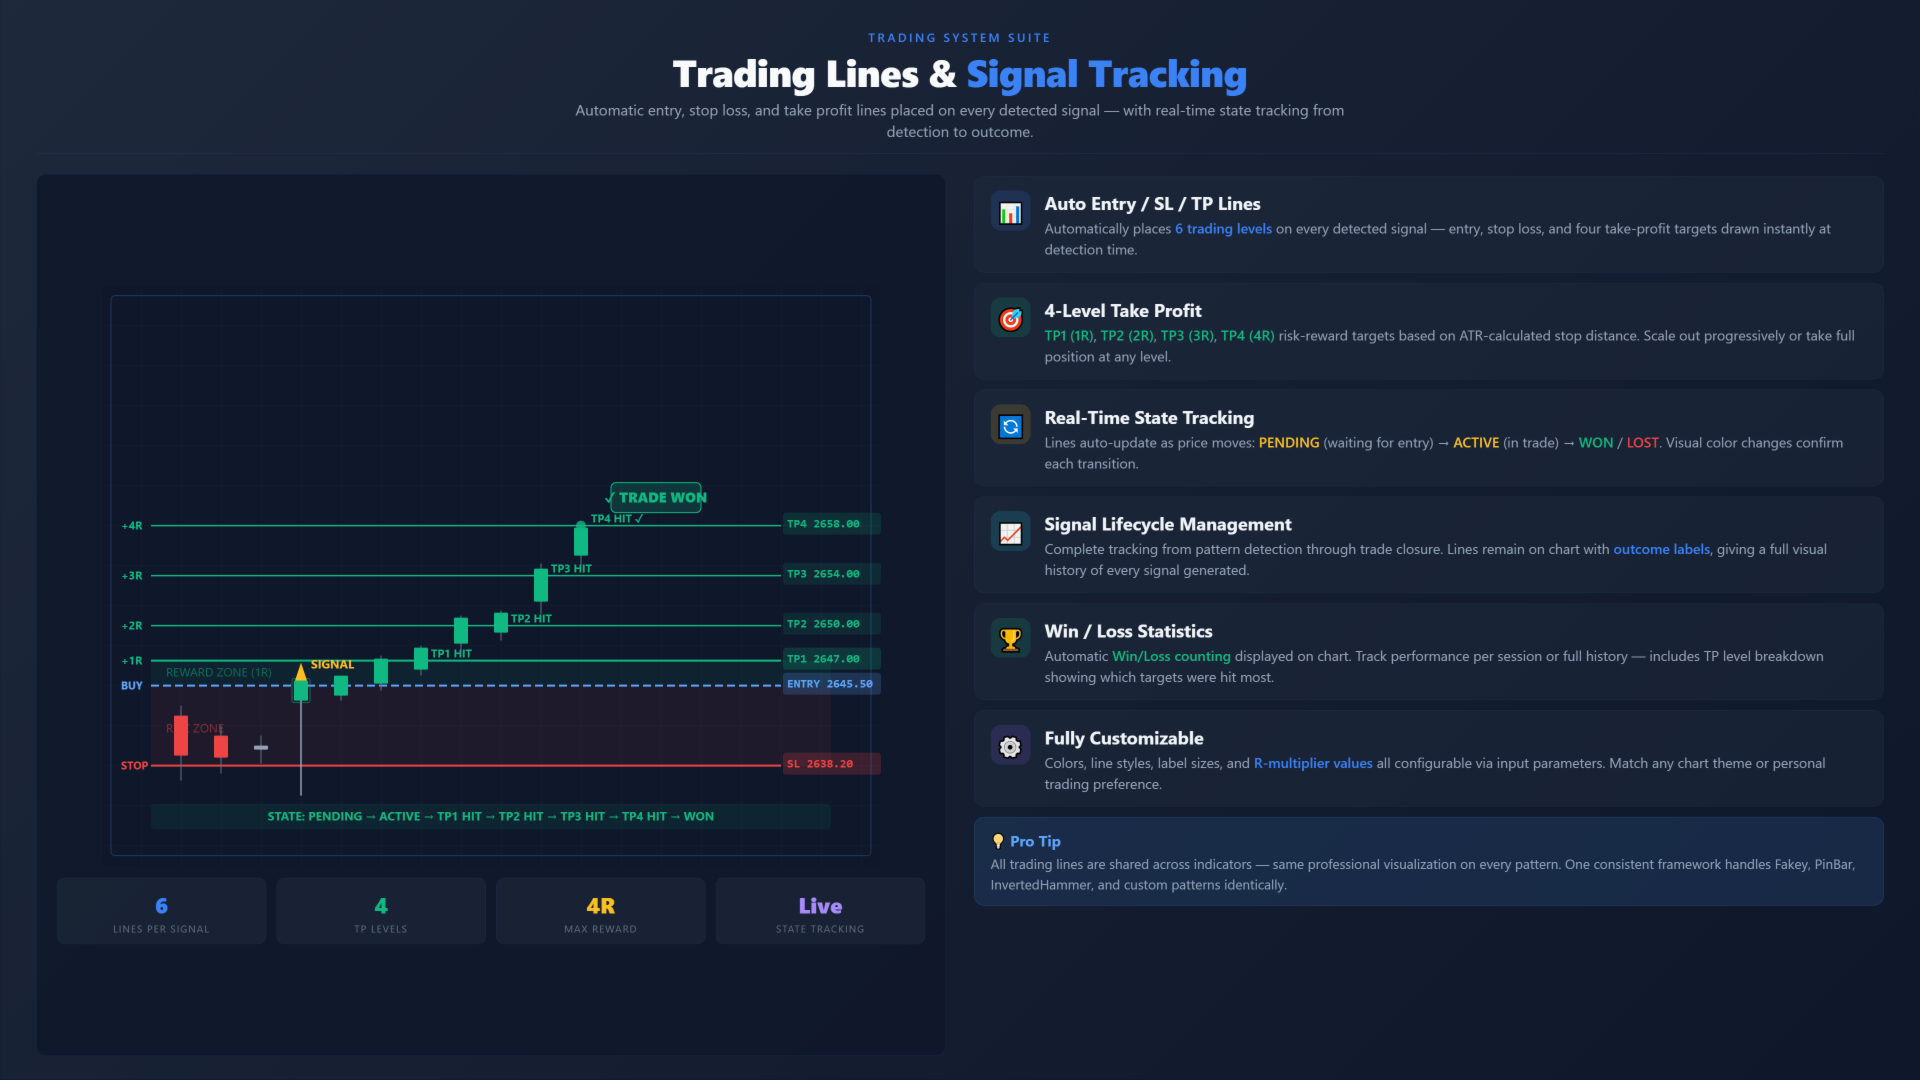
The indicator can draw Entry, Stop Loss, and Take Profit levels directly on the chart and track signal progress after detection.
Detection Logic
The detection model evaluates each completed two-bar pattern through several structural conditions.
These conditions can include:
Setup candle moving against the prevailing trend
Open match between the setup candle and signal candle within an ATR-based tolerance
A strong signal candle that closes in the direction of the prevailing trend
Minimum body size requirements for both candles
Prior trend context before the pattern forms
The indicator can detect both bullish and bearish Separating Lines structures.
Patterns that do not meet the selected structural requirements are ignored.
Quality Evaluation
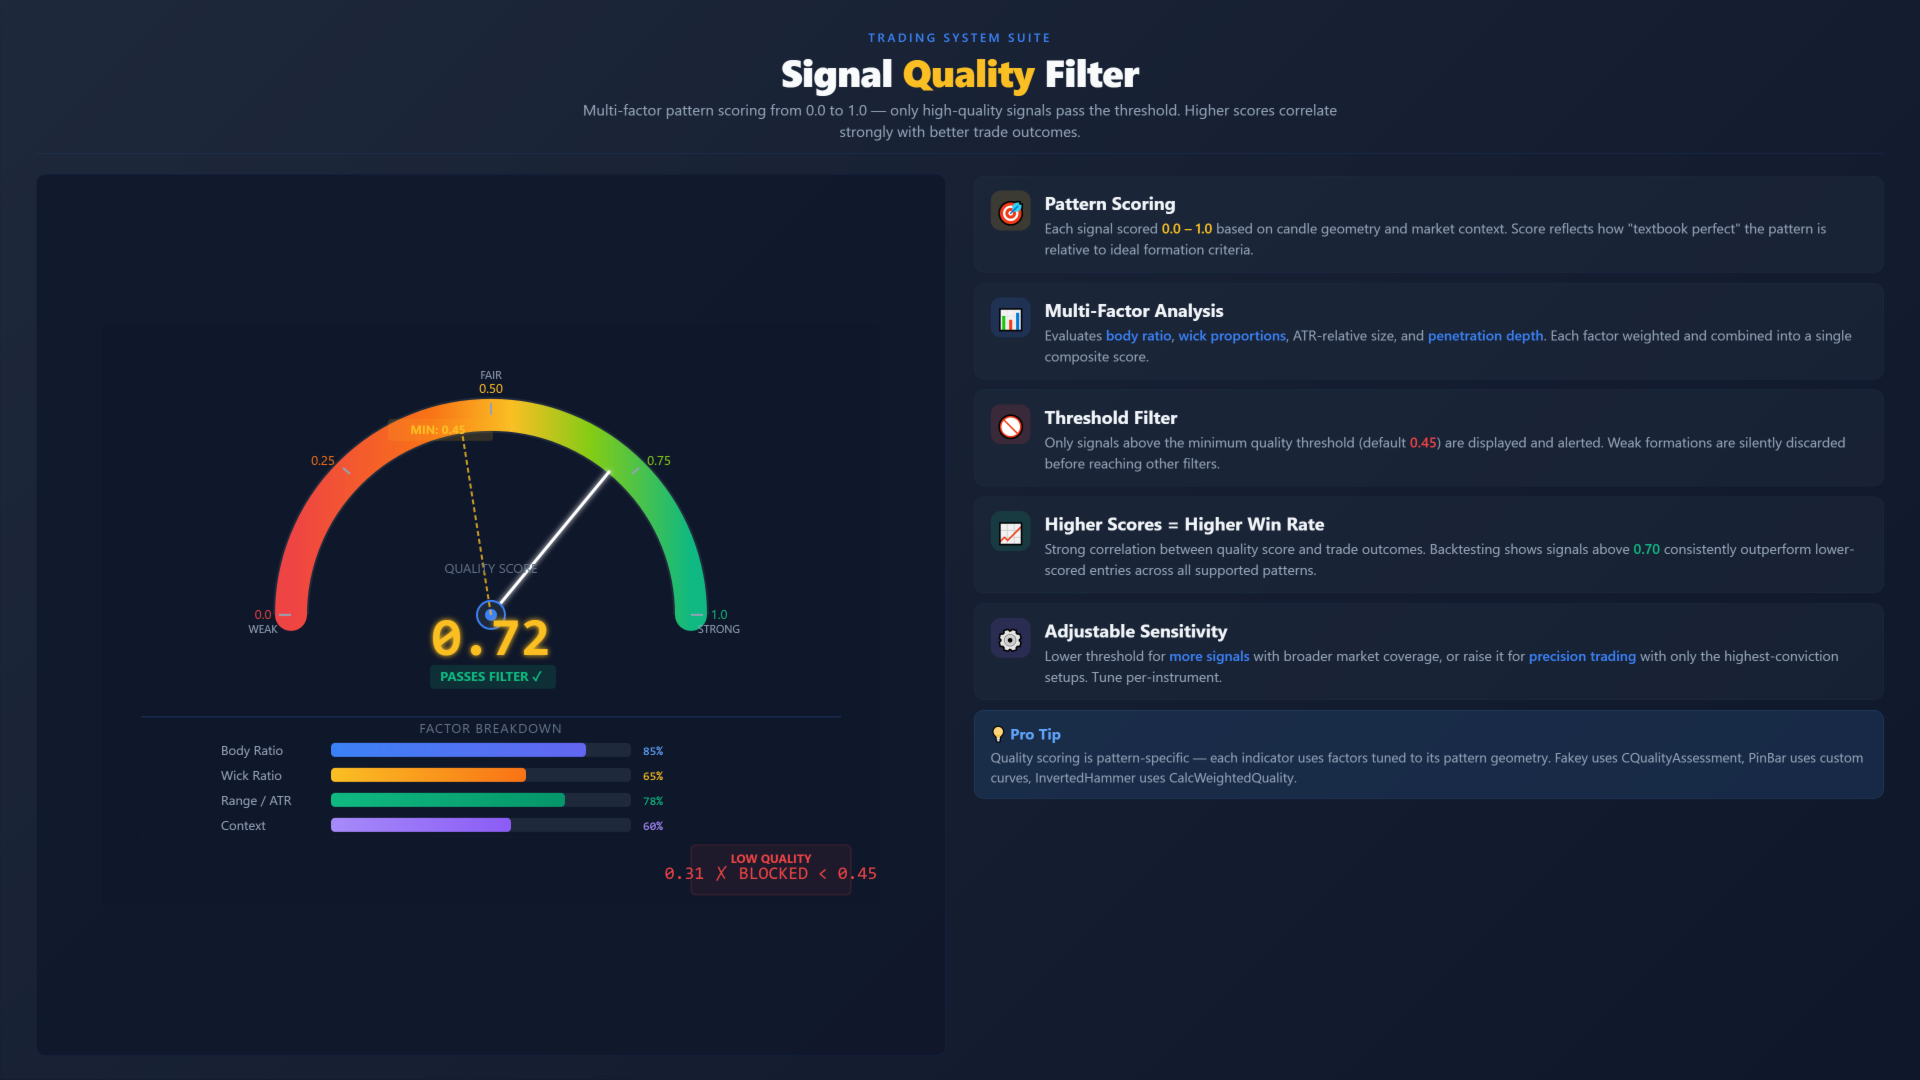
Each valid pattern can be evaluated through a multi-factor quality model.
The scoring process can include measurements such as:
Open match precision
Signal candle body size relative to ATR
Prior trend context
Setup candle body size relative to ATR
Signal candle close position
Signals below the selected minimum threshold can be filtered out automatically.
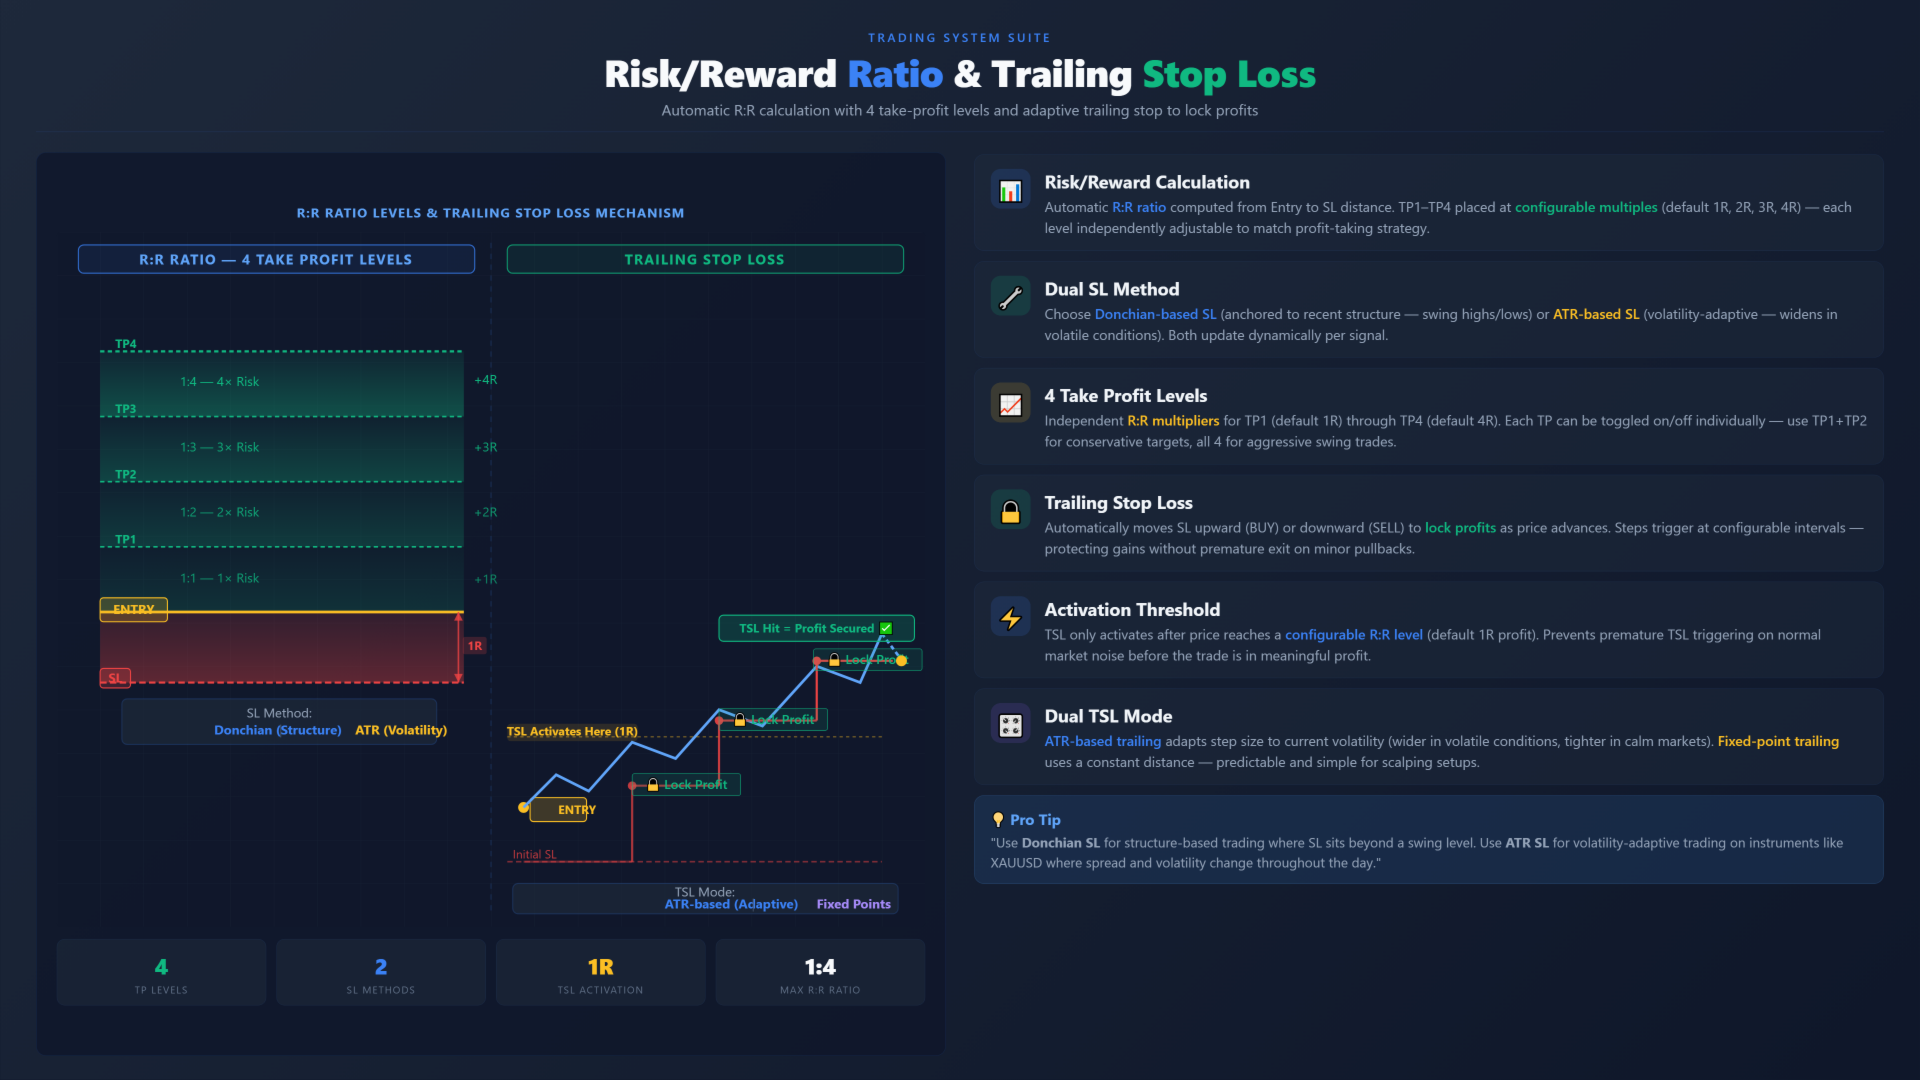
Entry and trade planning
For confirmed setups, the indicator can project immediate entry levels at the signal candle close.
For each valid setup, the indicator can display:
Entry level
Stop Loss level
Up to four Take Profit levels
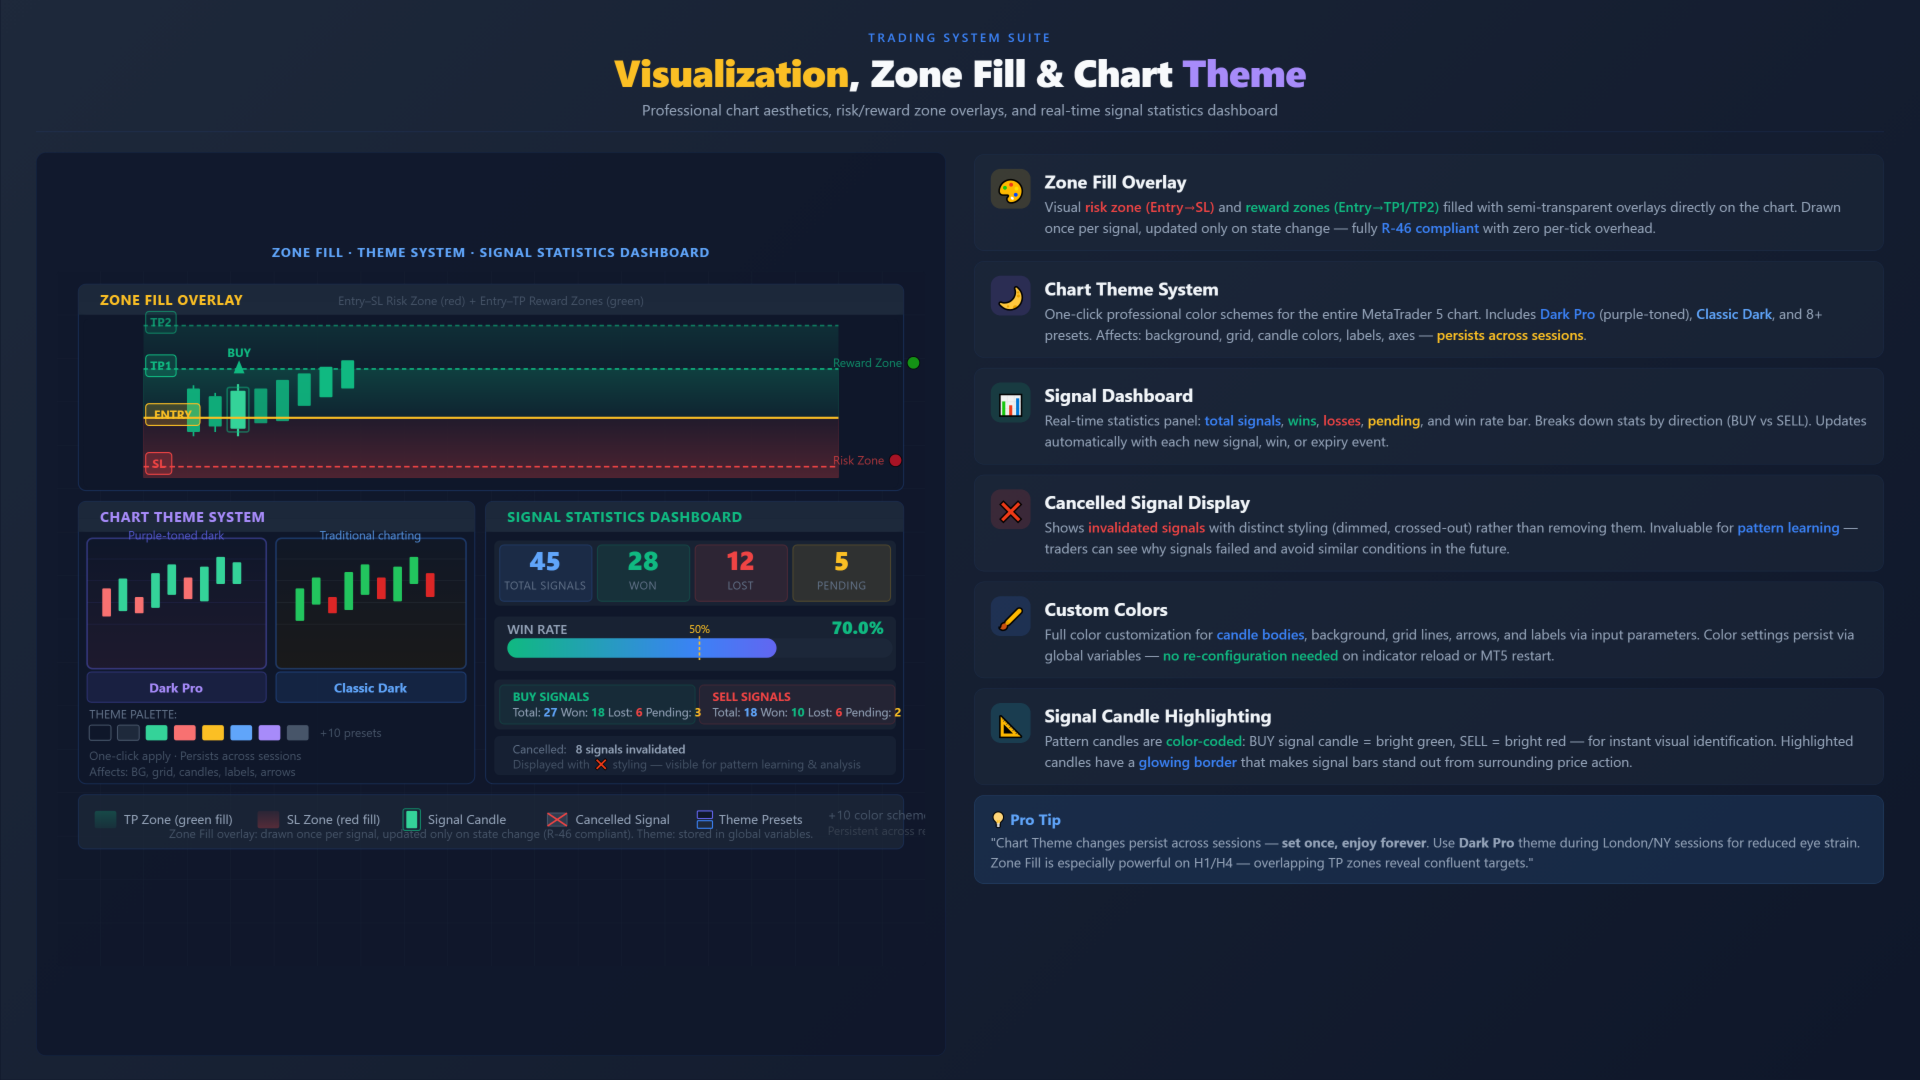
Risk and reward zones on the chart
Stop Loss can be calculated using pattern-based placement, Donchian Channel logic, or ATR-based logic.
An optional trailing stop based on Donchian logic is also available for users who want dynamic trade management after entry.
Filters and tools
Optional filters are available to reduce unnecessary signals.
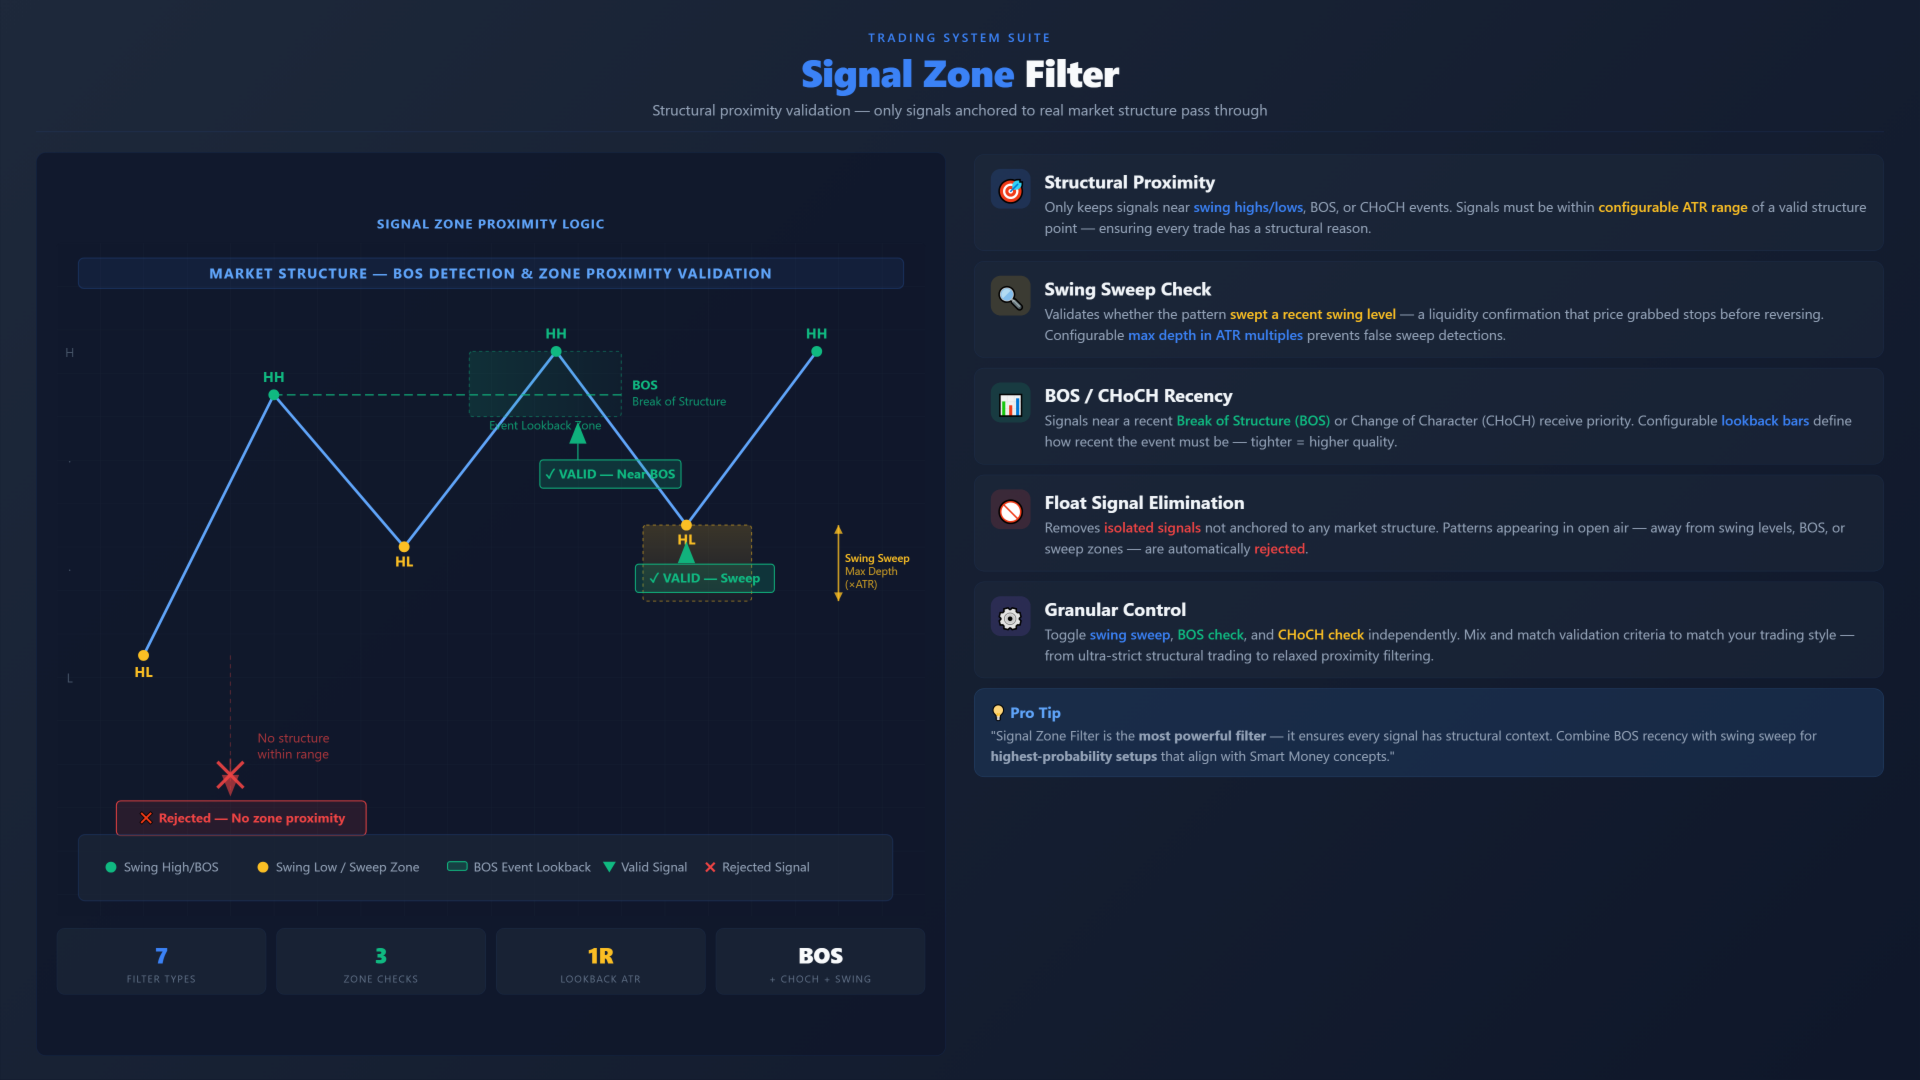
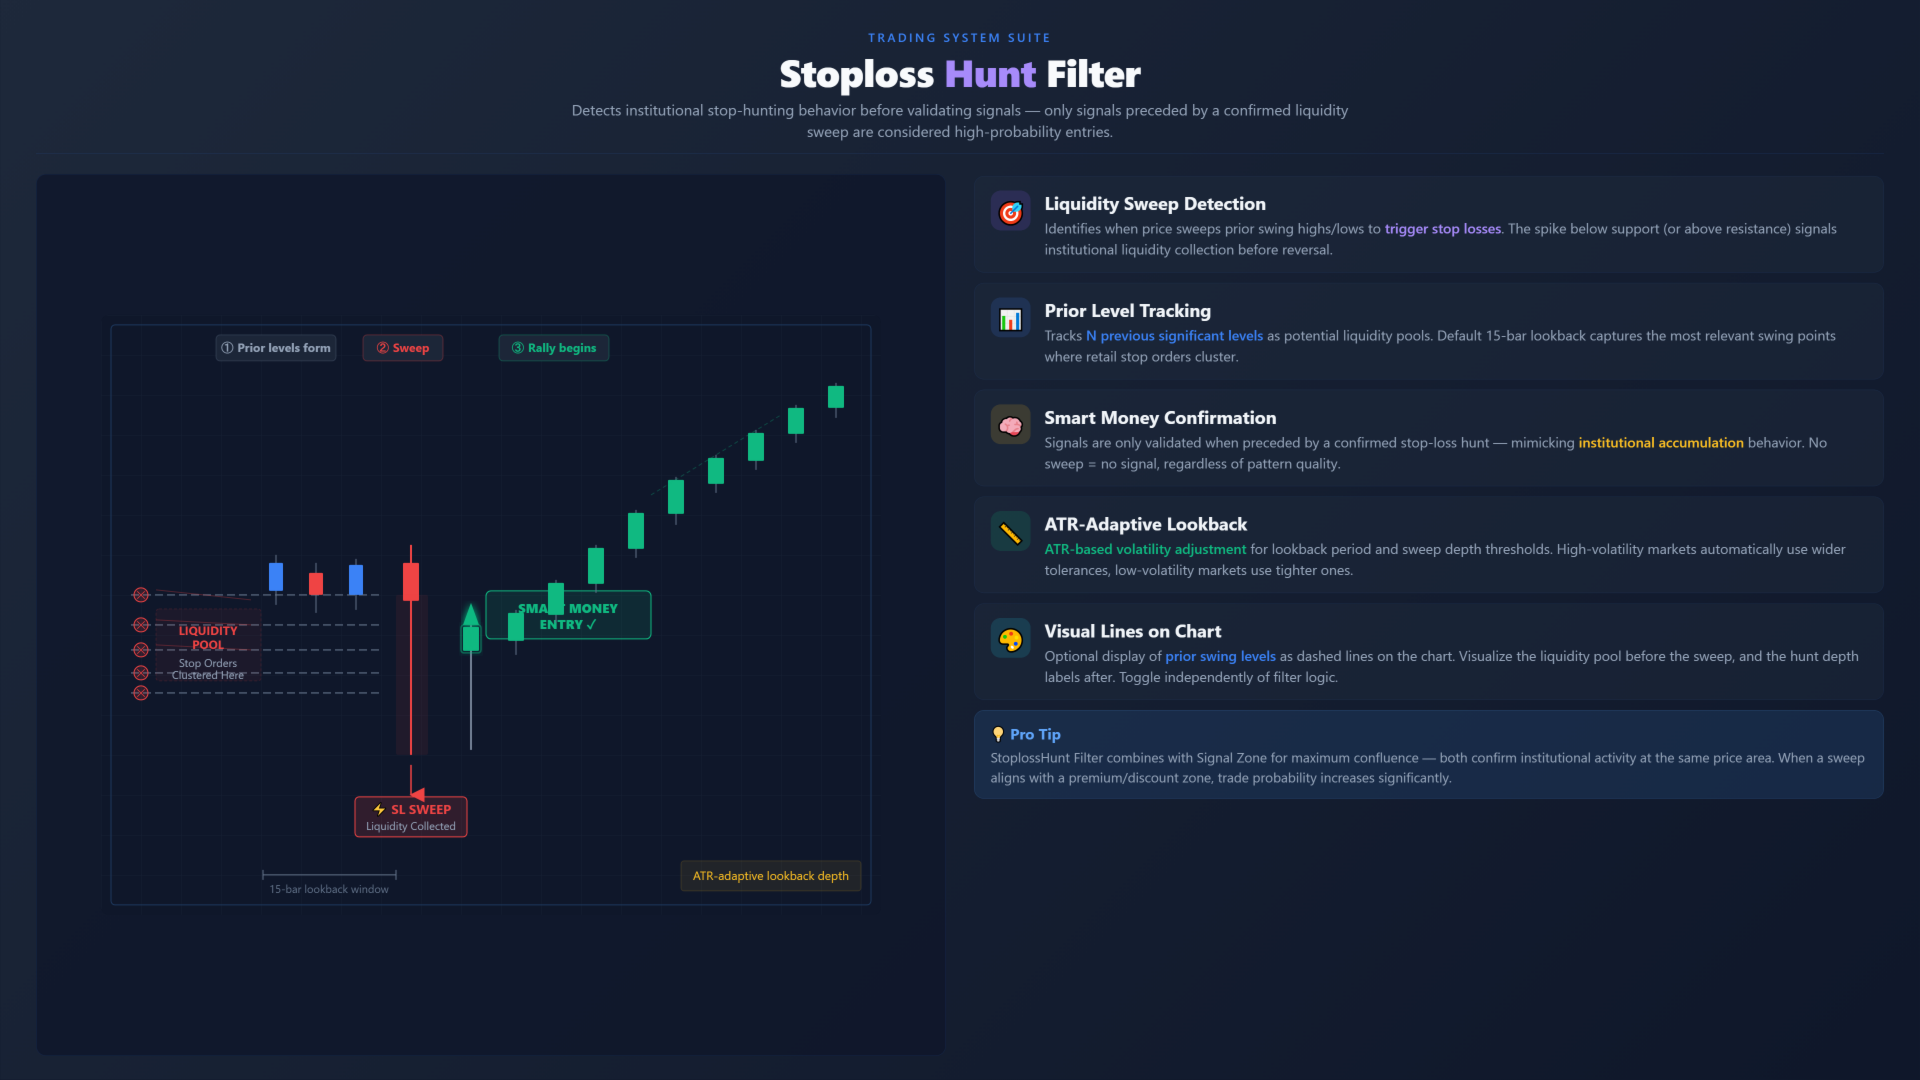
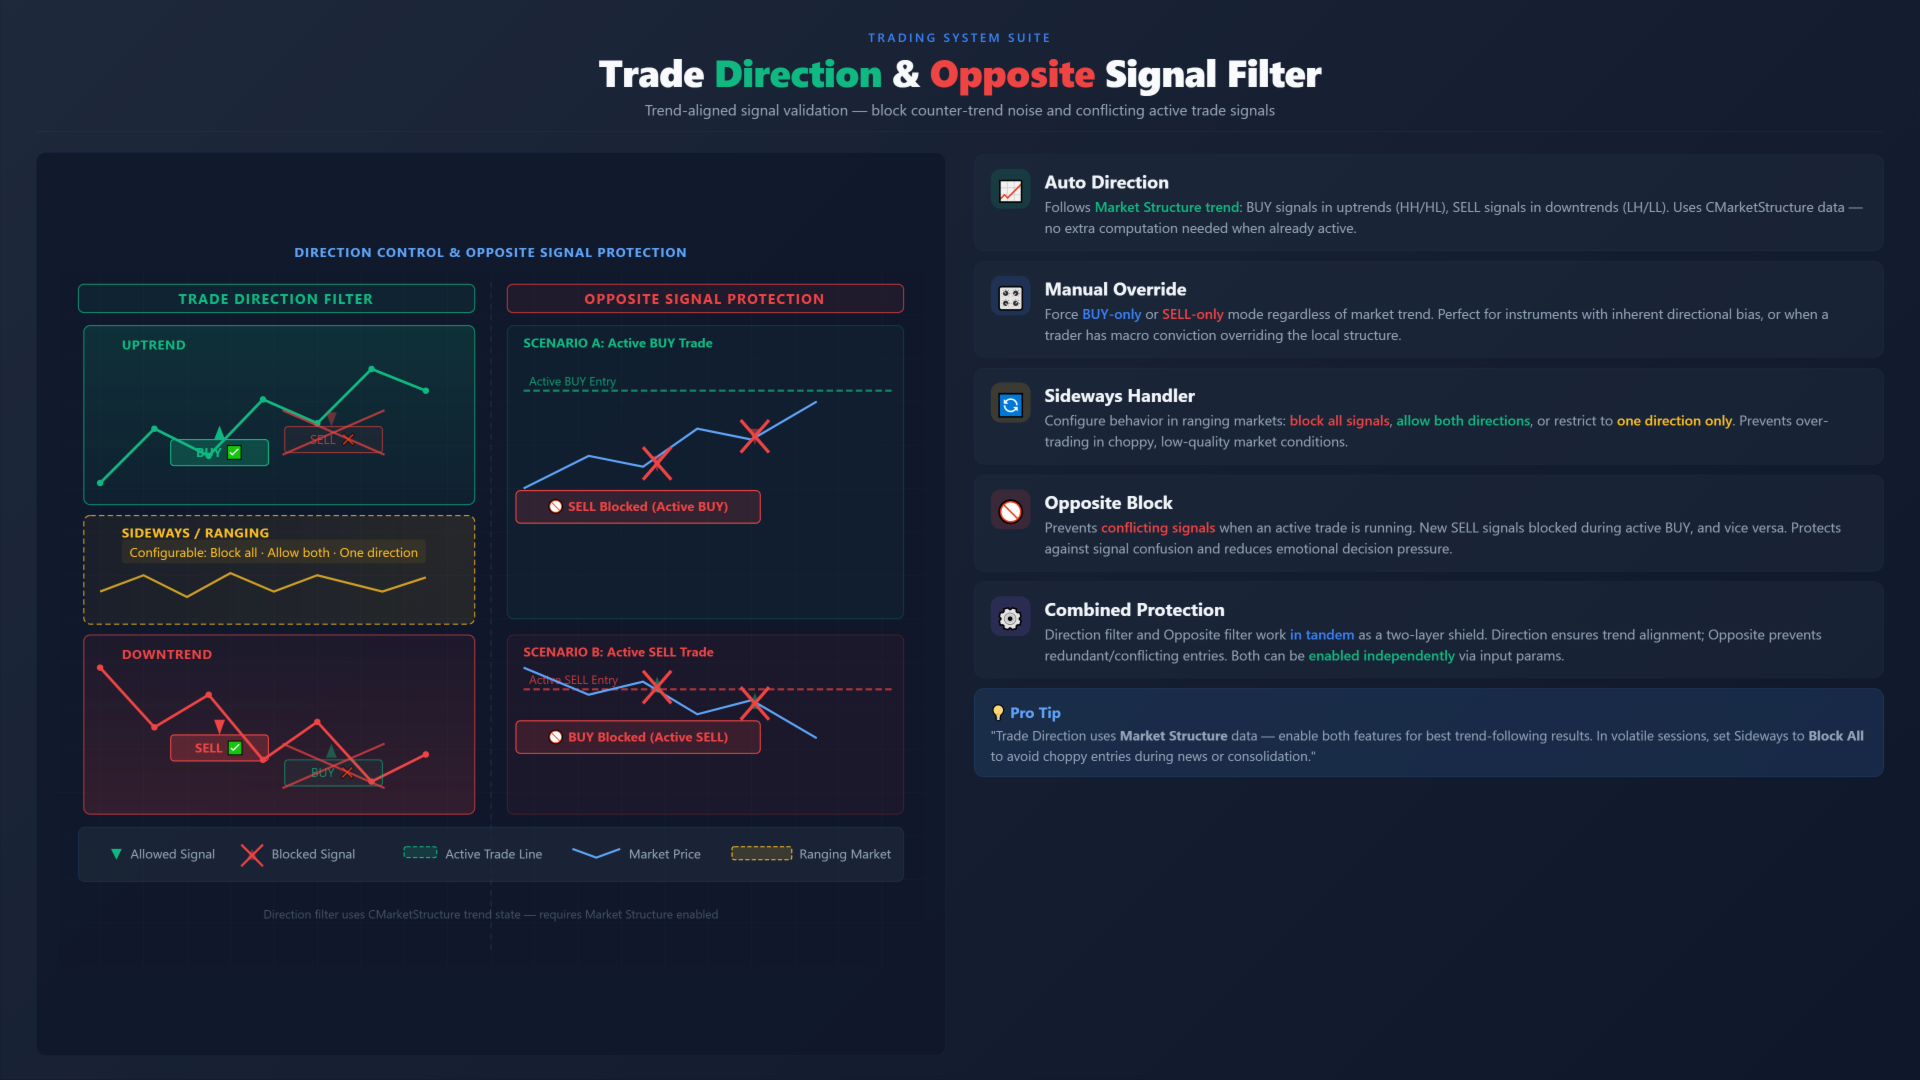
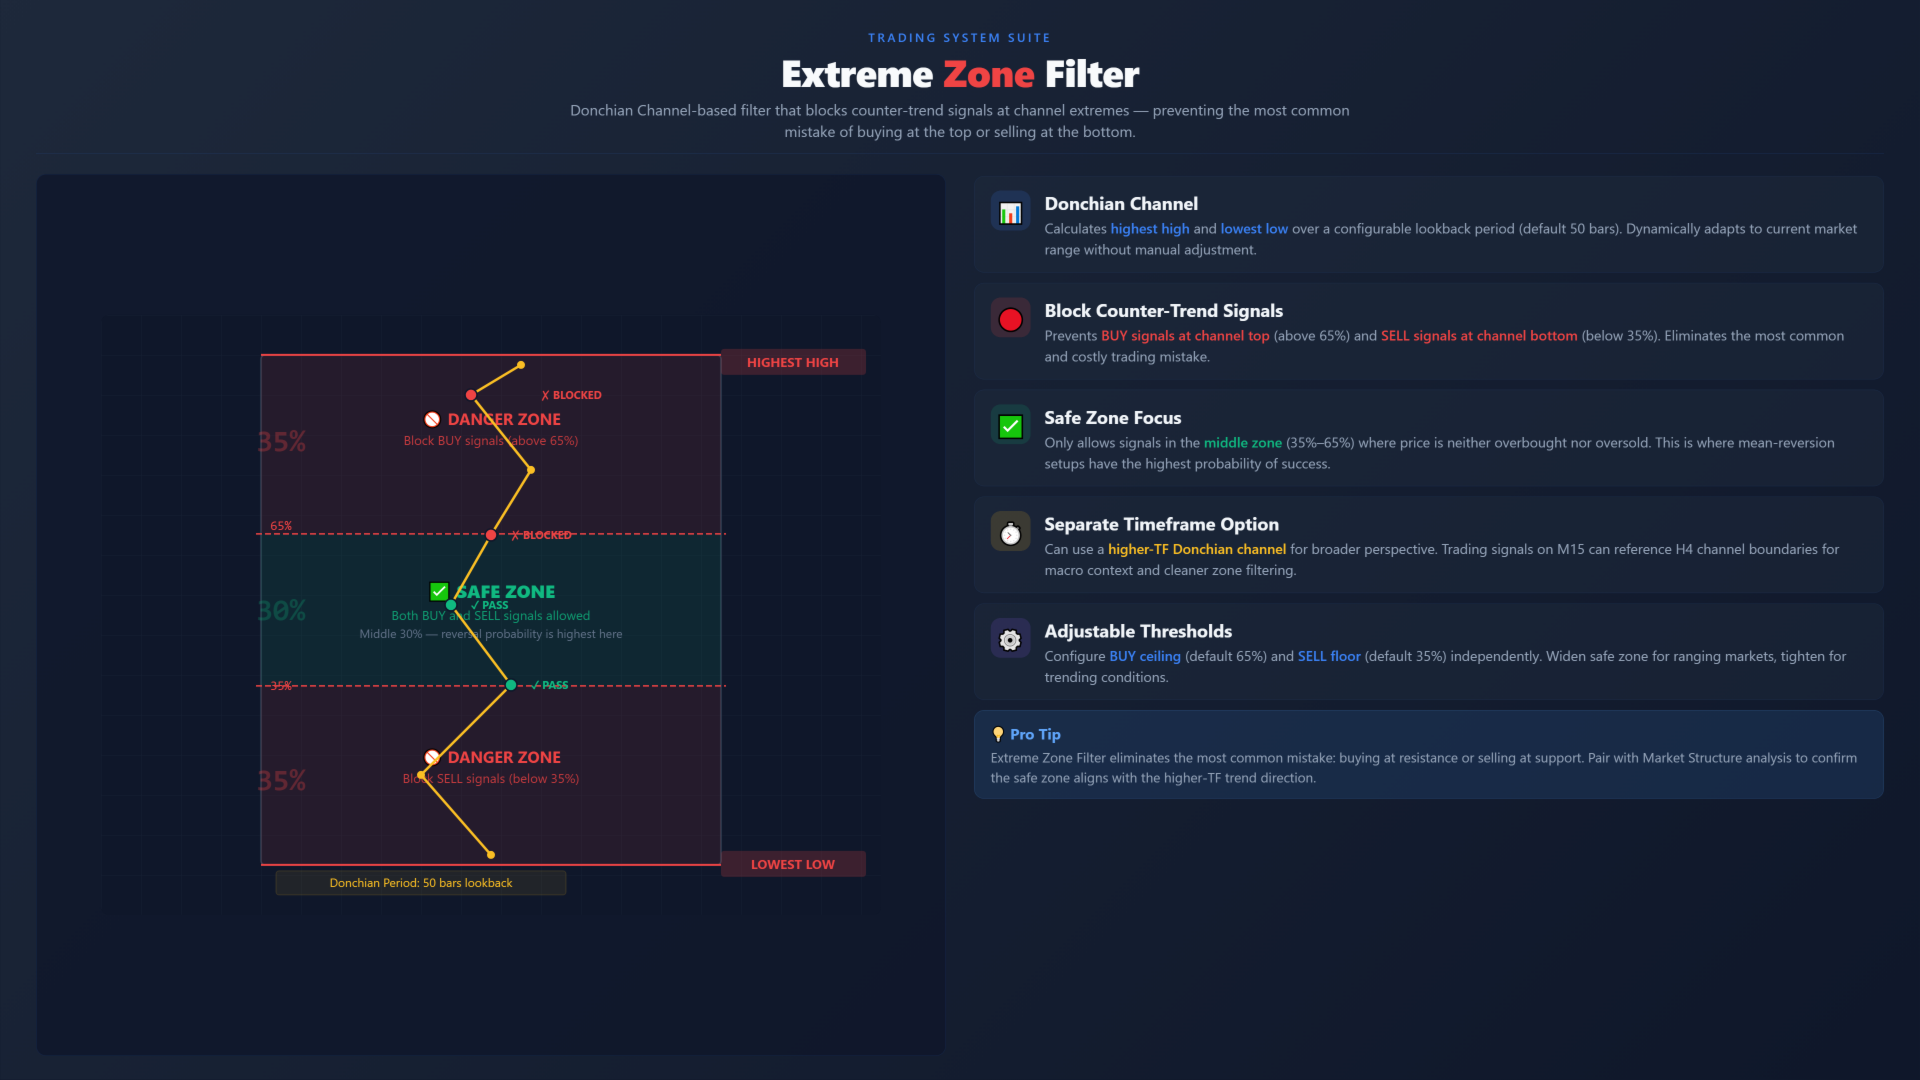
These include Direction Filter, Extreme Zone Filter, Stop Hunt Filter, Signal Zone Filter, and Opposite Signal Filter.
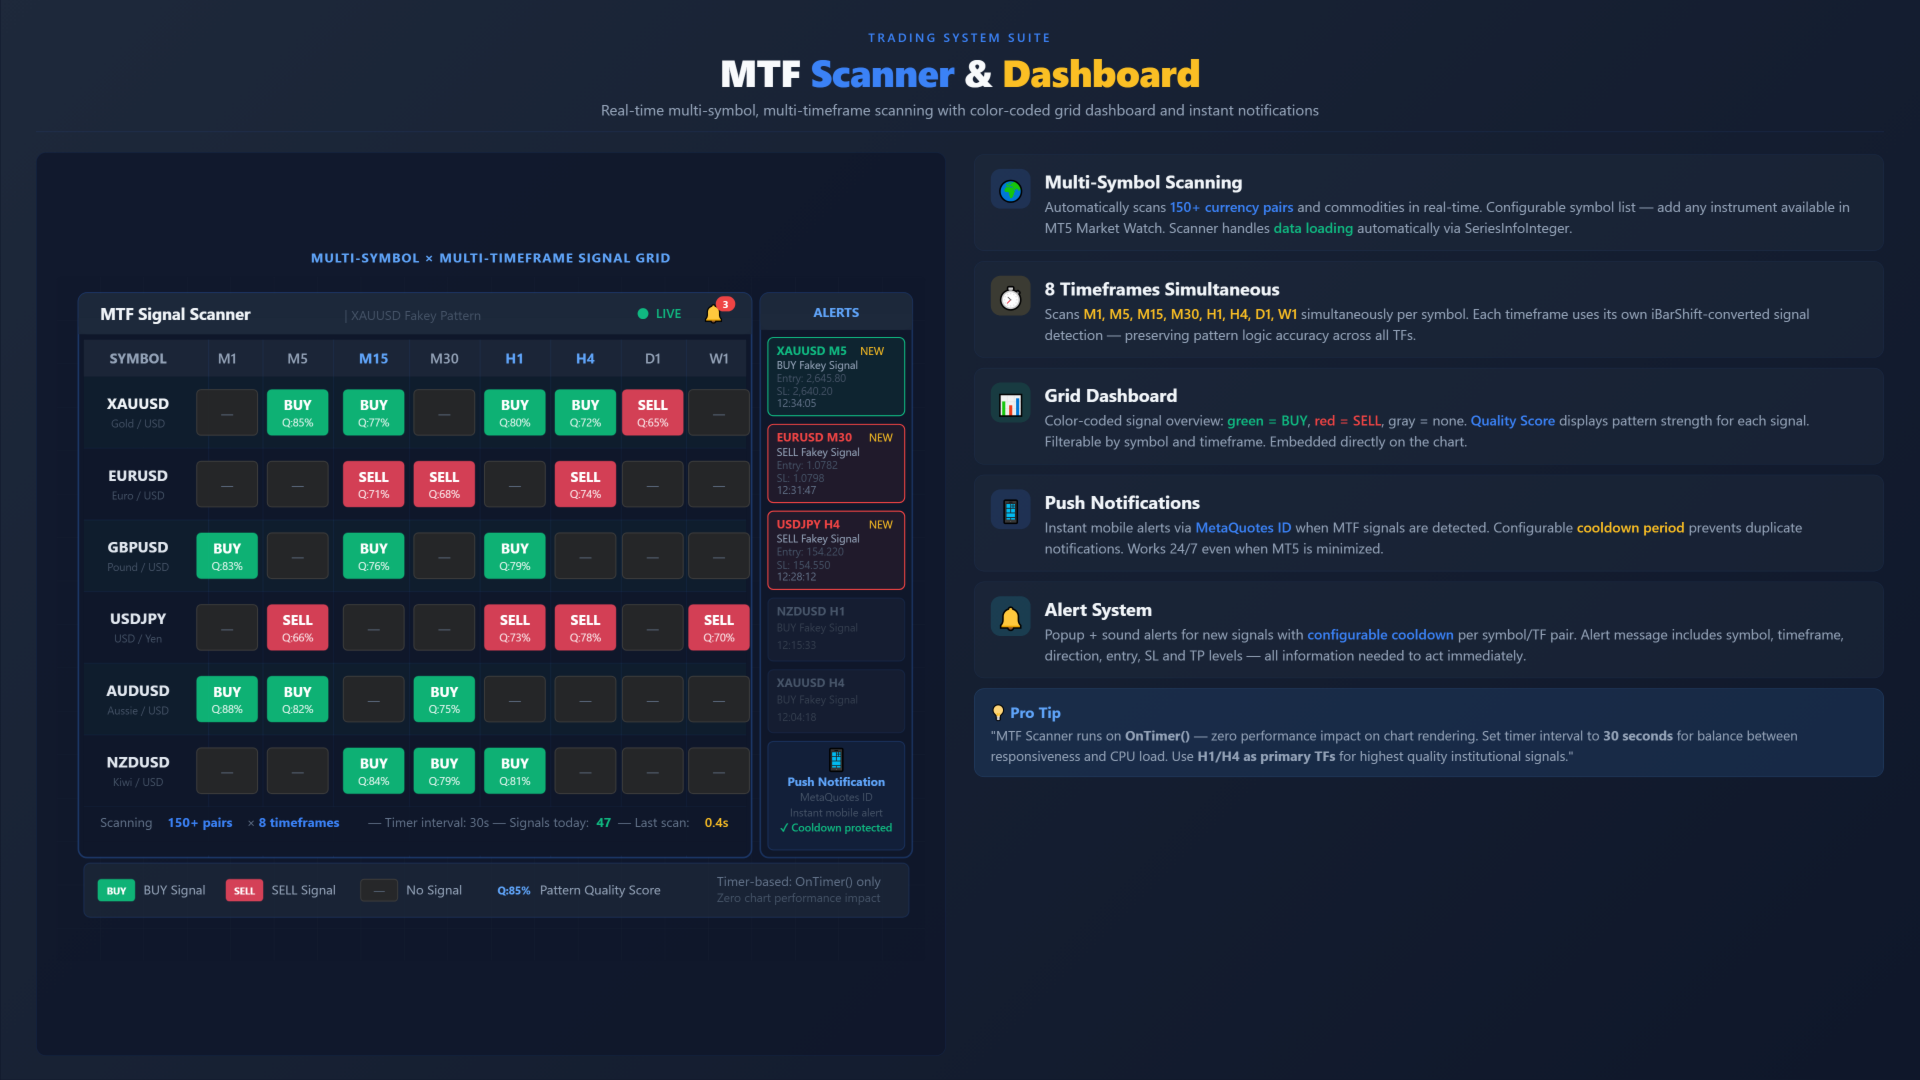
The built-in scanner can monitor up to 150 symbols across 8 timeframes from a single chart.
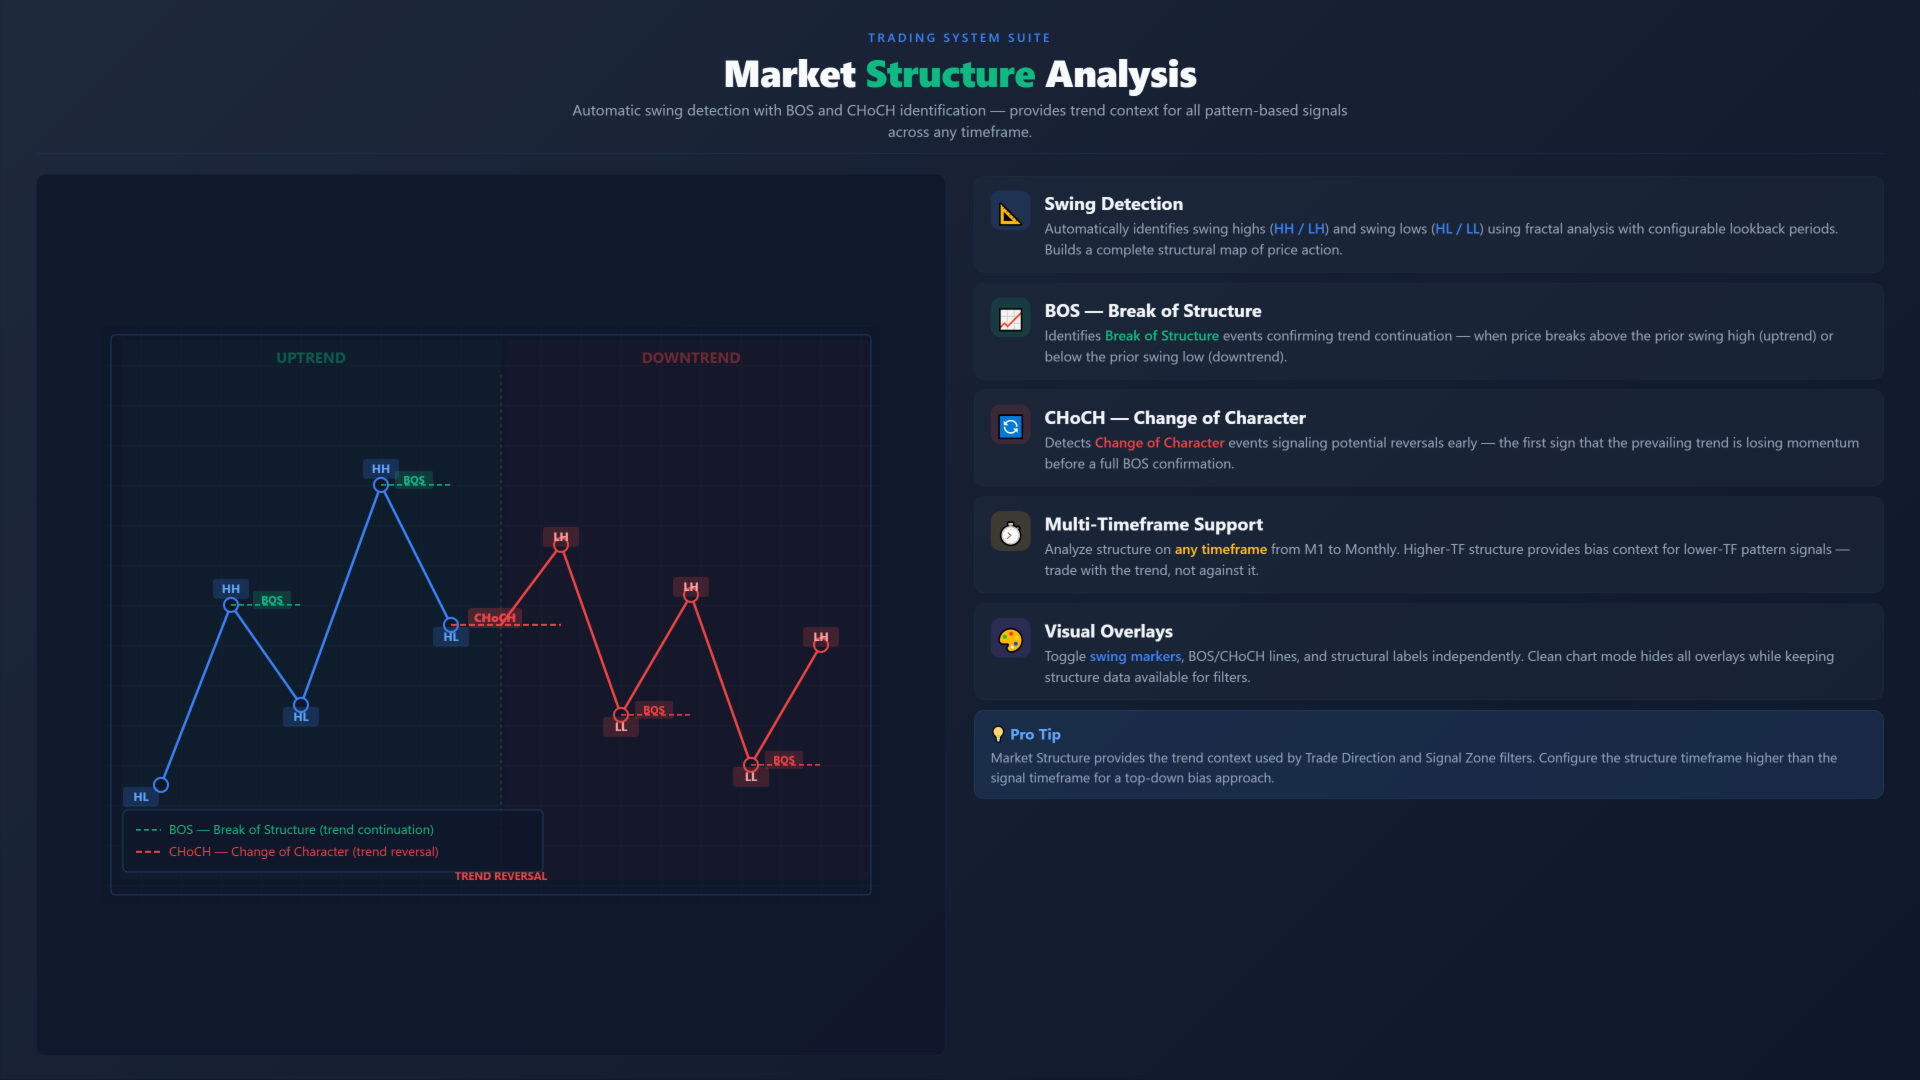
The indicator also includes BOS and CHOCH labels, a signal dashboard, alert options, chart themes, and output buffers for Expert Advisor integration.
Recommended use
Recommended timeframes are H1, H4, and D1 because continuation patterns are generally more reliable when the trend structure is clearer.
The indicator can be applied to Forex pairs, XAUUSD, indices, crypto pairs, and stocks, with the best results typically appearing in markets that sustain directional trends.
Loading sufficient chart history is recommended for more stable structure analysis.
MetaTrader 5 only.
No DLL calls.
No external WebRequest connections.
Important notes
This indicator is a technical analysis tool.
It does not guarantee trading results.
Users should test settings in their own environment and apply appropriate risk management.
Support is available through the product comments section or via MQL5 direct message.