LZ Multi Candle Timer

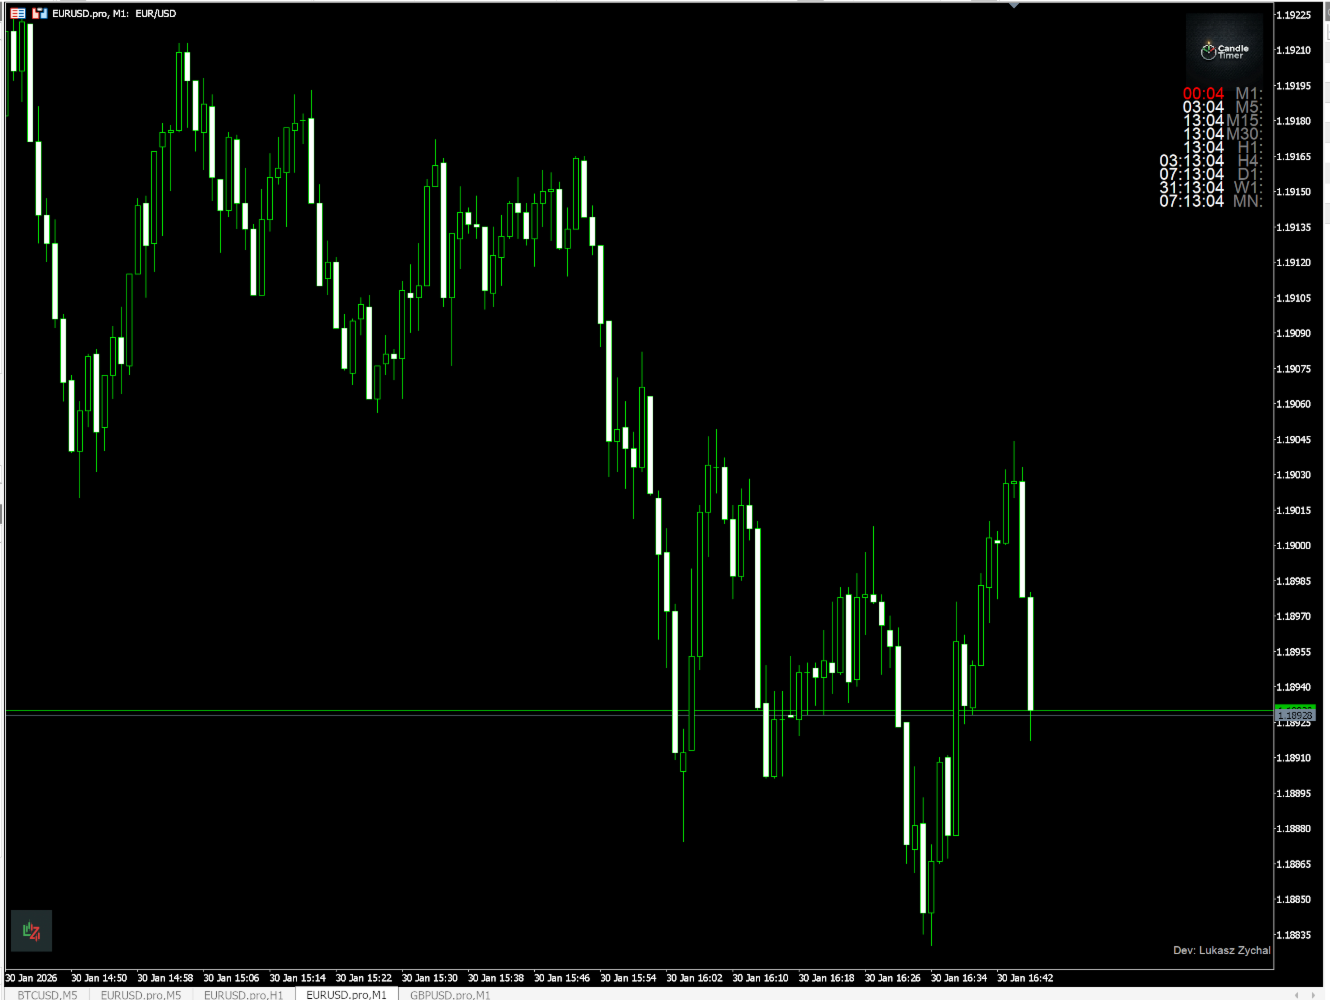
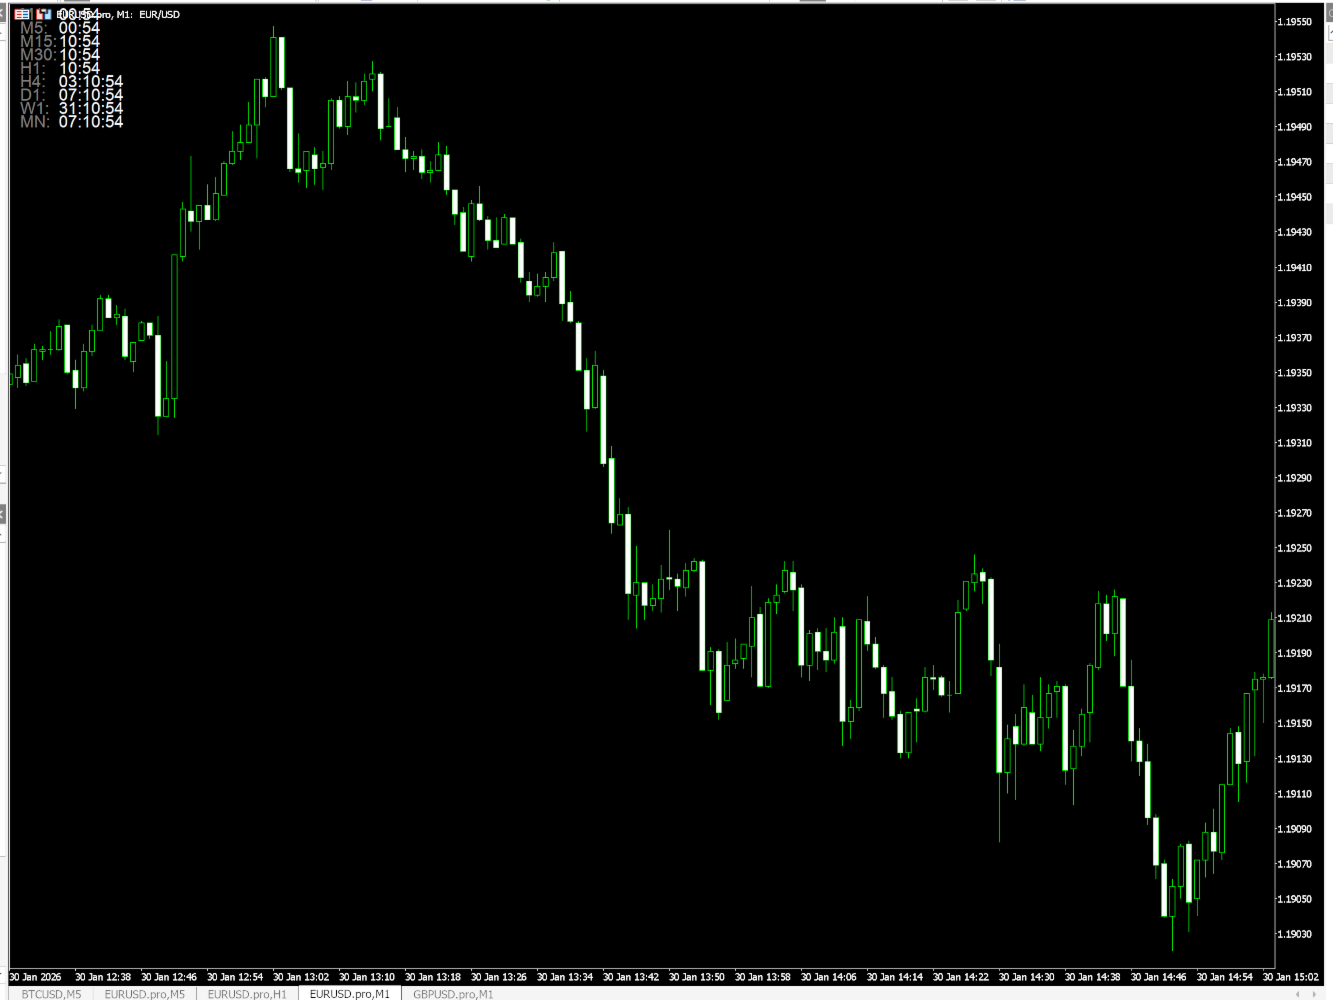
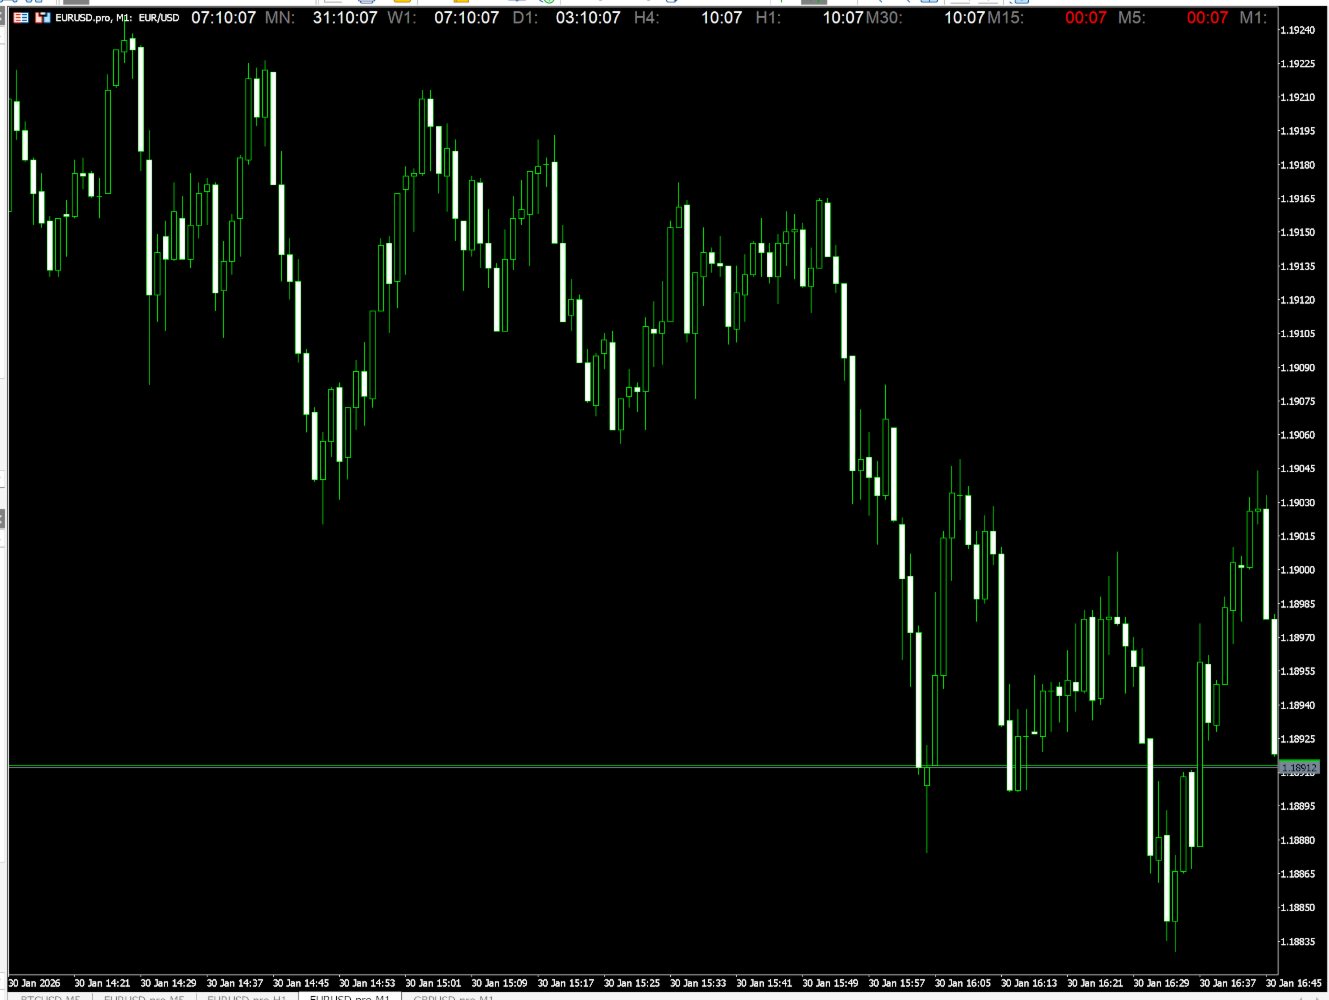
LZ Multi-Timeframe Candle Timer displays the remaining time before the current bar closes for multiple timeframes simultaneously on a single dashboard. Monitor up to 9 timeframes (M1, M5, M15, M30, H1, H4, D1, W1, MN1) without switching charts. The indicator uses server time, updates every second, and is optimized for smooth display with minimal CPU use.

Feature highlights

- Multi-timeframe display: select which timeframes to show (M1 through MN1) via boolean inputs. Display only the intervals you need.
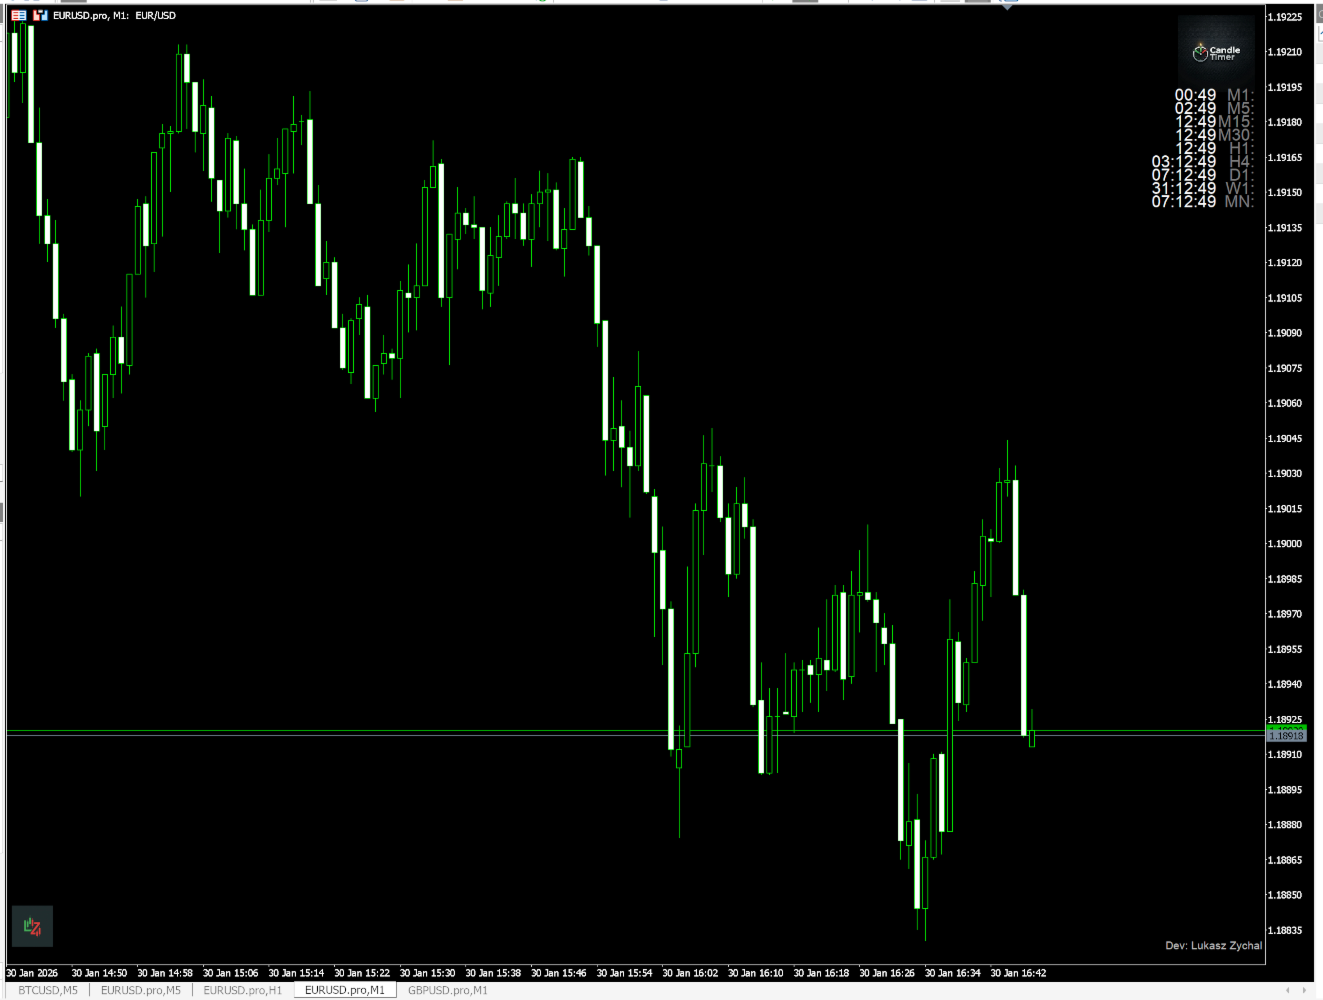
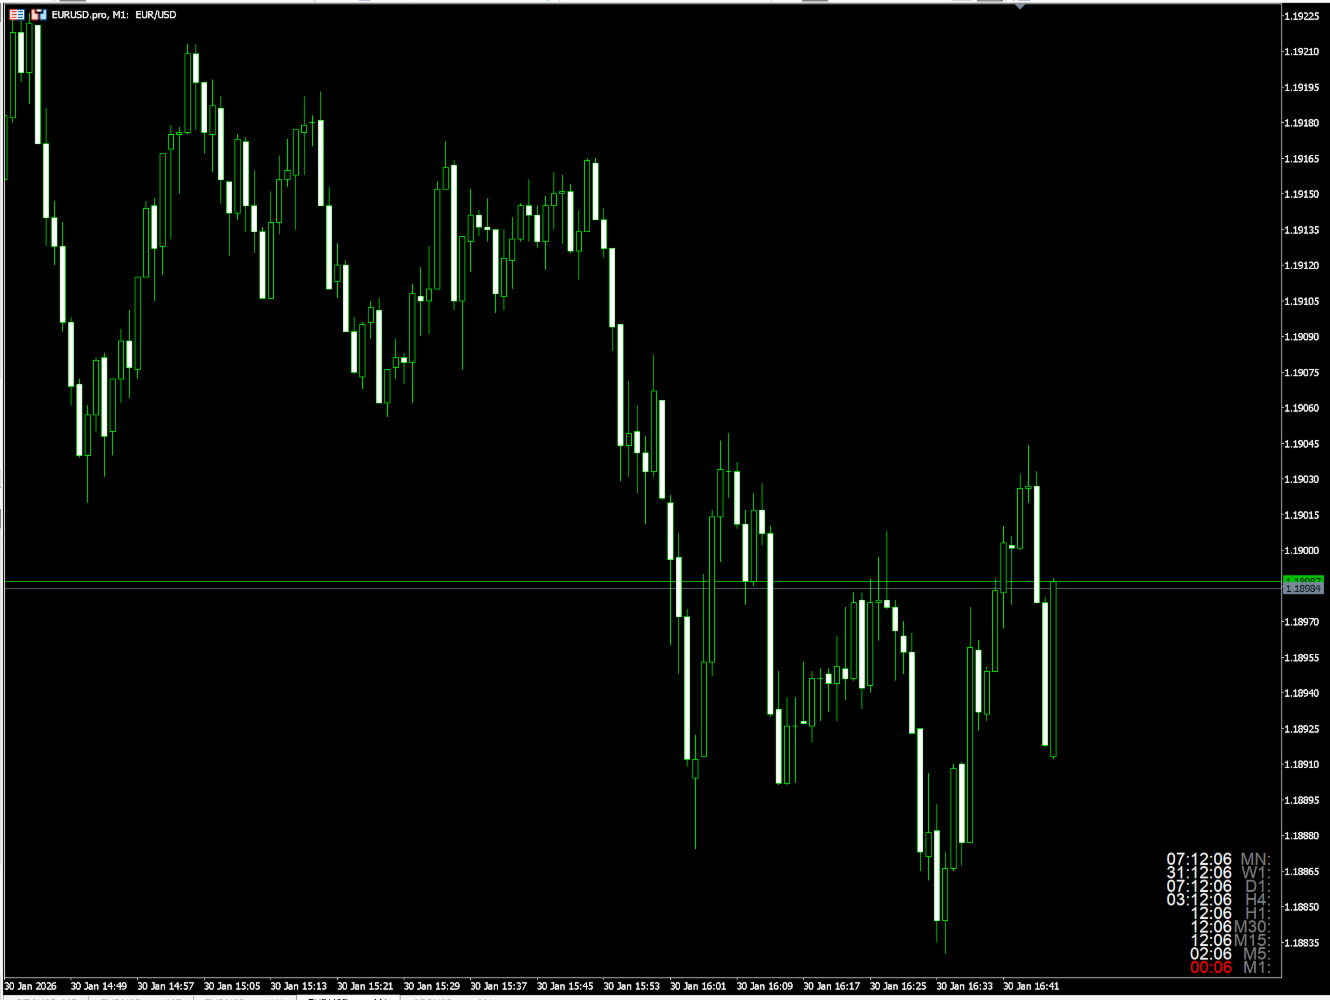
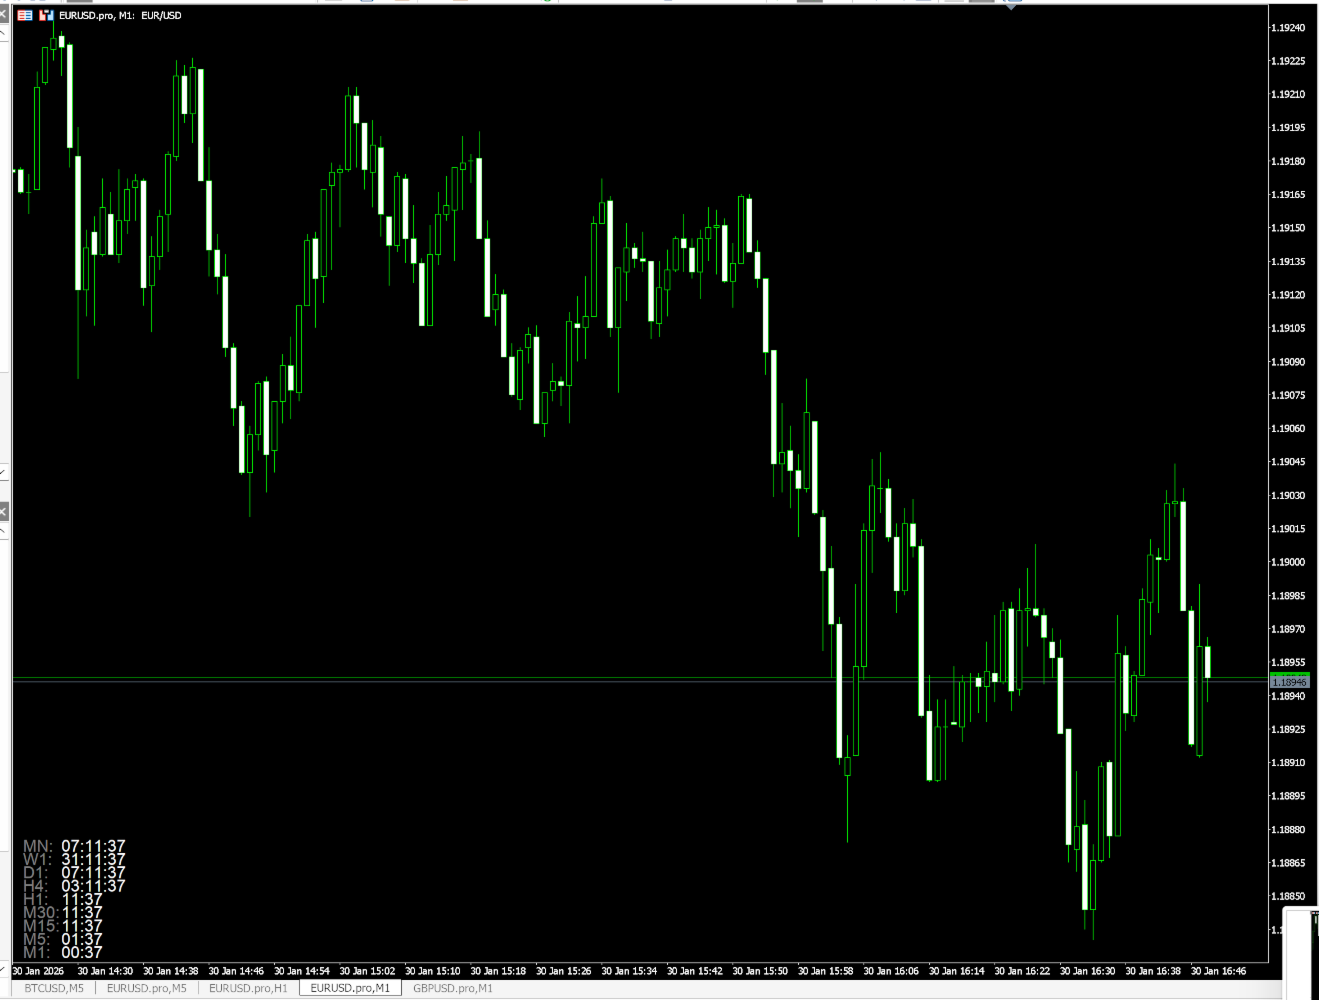
- Layout options: vertical (default, stacked list) or horizontal (single row). Logo positioned above the list for top corners, below for bottom corners.
- Selectable location: place the dashboard in any of the four chart corners (Upper Left, Upper Right, Lower Left, Lower Right). X/Y offsets and padding are configurable.
- Alarm colour: when fewer than X seconds remain (default 10), the timer text for that timeframe switches to an alarm colour (default red). Threshold and colour are configurable; you can disable this.
- Optional sound alarm: play a sound (e.g. alert.wav) when any timer is in the alarm state. Cooldown avoids repeated alerts; sound file is configurable.
- Customisable appearance: label colour (e.g. "H1:", "M5:"), clock colour, font size, and spacing are adjustable. Logo and author footer can be shown or hidden.
- Lightweight: timer-based updates, no tick dependency; works consistently even when the market is quiet.

Input parameters

Timeframes (show/hide each)
- M1, M5, M15, M30, H1, H4, D1, W1, MN1: enable/disable each timeframe (default: M1–D1 on, W1–MN1 off).

General settings
- Vertical layout: yes (default, stacked) or no (horizontal row).
- Corner: Upper Left, Upper Right, Lower Left, or Lower Right.
- X offset, Y offset: distance from the chart edge (pixels).
- Padding: space between logo and timer list.

Timer look
- Label colour: colour of interval labels (e.g. "H1:", "M5:").
- Clock colour: colour of the countdown text.
- Font size: size of the timer digits.
- Alarm colour enabled: turn the countdown colour change on/off.
- Alarm below X seconds: seconds threshold for the colour change (default 10).
- Alarm colour: colour when in countdown (e.g. red).
- Sound alarm: enable/disable sound when any timer is in alarm state.
- Sound cooldown (seconds): minimum interval between sound plays (default 60).
- Sound file: name of the WAV file in MQL5/Sounds/ (e.g. alert.wav).

Branding
- Show logo, logo size: display and size of the indicator logo.
- Show author, author colour: display and colour of the author footer.

Installation

Copy MultiCandleTimer.ex5 to MQL5/Indicators/ (or your preferred subfolder). Restart MetaTrader 5 or refresh the Navigator, then drag the indicator onto a chart.

Compatibility

MetaTrader 5, build 3815 or higher. All symbols. Works on any chart timeframe (displays selected intervals regardless of chart TF).

おすすめのプロダクト
Maximum Minimum Candle indicator  is a basic indicator (but useful) that shows the highest and lowest candle in a period of time . The indicator shows the maximum candle and the minimum candle for a defined period of time. You can choose the number of candles that make up the period The indicator will show with color points  the maximum and minimum values. A message tells you when the price reaches the maximum or minimum. Parameters number_of_candles: It is the number of candles that will be c
FREE
Shadow System Candles - トレンド可視化システム コンセプト 「暗闇での乱射はやめろ。相場にナイトビジョンを装備せよ」 Shadow System Candlesは、FXトレードプロジェクト「Shadow Operation」の視覚コアシステムです。 AIロジック(ADXと移動平均の統合判断)に基づき、ノイズを排除し、相場の「真のトレンド方向」をローソク足の色で可視化します。 ※本ツールは矢印シグナルは出ません。トレンドの「発生」と「消滅」を視覚的に認識するための訓練用、および裁量トレードのフィルターとして機能します。 機能: ・AIロジックによる色分け トレンドの強弱を5段階で表示します。 ・濃い青 (Deep Blue) 強力な上昇トレンド(加速フェーズ) ・薄い青 (Light Blue) 上昇トレンド ・グレー (Gray) レンジ / 膠着状態(待機推奨) ・薄い赤 (Light Red) 下降トレンド ・濃い赤 (Deep Red) 強力な下降トレンド(加速フェーズ) 規律の強制 グレーの期間は「手出し無用」。無駄な往復ビンタを防ぎます。完全
FREE
The "Support Resistance Dynamic" indicator is a powerful technical analysis tool for the MetaTrader 5 platform, designed to automatically identify and plot dynamic Support and Resistance zones on price charts. This indicator helps traders easily recognize important price levels, potential reversal points, or breakout areas, thereby enabling more informed trading decisions. 2. Key Features Dynamic S/R Identification : Automatically identifies support and resistance zones based on an advanced Pivo
FREE
概要 このインジケーターは、クラシックな ドンチャンチャネル を強化したバージョンで、実践的なトレード機能を追加しています。 標準の3本線(上限、下限、中央線)に加え、 ブレイクアウト を検出し、チャート上に矢印で視覚的に表示します。また、チャートを見やすくするために、 現在のトレンド方向と逆側のラインのみを表示 します。 インジケーターの機能: 視覚的シグナル :ブレイクアウト時にカラフルな矢印を表示 自動通知 :ポップアップ、プッシュ通知、Eメール RSIフィルター :市場の相対的な強弱に基づいてシグナルを検証 カスタマイズ可能 :色、ラインの太さ、矢印コード、RSI閾値など 動作原理 ドンチャンチャネルは次のように計算します: 上限線 :直近N本のクローズ済みローソク足の最高値 下限線 :直近N本のクローズ済みローソク足の最安値 中央線 :最高値と最安値の平均値 上方ブレイクアウト は終値が上限線を超えたときに発生し、 下方ブレイクアウト は終値が下限線を下回ったときに発生します。 インジケーターは以下を行います: 3本のドンチャンラインを描画 方向転換後の最初のブレイクアウト
FREE
Chart Time MT5
Isaac Montesinos Valdes
-   Chart Time Indicator is very simple and easy, but it can be very important to control the time before opening any manual trade. This indicator shows the time on the chart between 3 different options. Input Parameters:   -   Show Time : Select all the time options that you want to see. Local Time (Personal Computer Time), Server time (Broker Time) or GMT Time. Recommendations:   -   Use only one Chart Time Indicator for each Chart.
FREE
The "Session Time Vertical Lines" indicator displays vertical lines on the chart that mark the beginning and end of major global trading sessions: Sydney, Tokyo, London, and New York . It is designed to help traders visually identify active market hours, overlaps, and potential high-volume periods directly on the price chart. This tool is especially useful for intraday traders who rely on market session timing to plan entries and exits. Inputs / Settings Parameter Name Description DaysToDraw Num
FREE
主要城市的时间。北京时间、东京时间、悉尼时间、惠灵顿时间、纽约时间、法兰克福时间、伦敦时间、迪拜时间。 城市时间可选择开启或者关闭。 点差变色提醒。设置点差提醒点数,例如,设置100点,点差大于100点,文字会变红色。 Time in major cities. Beijing time, Tokyo time, Sydney time, Wellington time, New York time, Frankfurt time, London time, Dubai time. City time can be turned on or off. Dot difference color change reminder. Set the point difference reminder points. For example, set 100 points. If the point difference is greater than 100 points, the text will turn red.
FREE
Main purpose:   "Pin Bars"   is designed to automatically detect pin bars on financial market charts. A pin bar is a candle with a characteristic body and a long tail, which can signal a trend reversal or correction. How it works:   The indicator analyzes each candle on the chart, determining the size of the body, tail and nose of the candle. When a pin bar corresponding to predefined parameters is detected, the indicator marks it on the chart with an up or down arrow, depending on the directi
FREE
Candle Time Countdown is a professional MT5 indicator developed to displays in real-time the countdown showing the remaining time until candle close across multiple timeframes simultaneously. The indicator features intelligent color-coded visual feedback where each timeframe's text dynamically changes to bright lime green for bullish candles and red for bearish candles, with each timeframe updating independently based on its own candle direction. Key Features Multi-Timeframe Support: M1, M5, M1
FREE
AZ session scalper A small but useful session indicator, designed primarily for scalping. Enable the session you plan to trade, watch the reaction of the M5/M15 candlesticks to the level of the previous trading session, and enter. We always look at the reaction of the current session to the previous one. For example, if you trade the Americas, enable the European session, and watch how one session takes away liquidity from another. Important: adjust the time to your broker's time zone in the i
FREE
Индикатор собирает данные из биржевого стакана, суммируя отложенные ордера на покупку или продажу. Далее, по сумме ордеров определяется общее направление, куда смотрят участники рынка. Если суммарные покупки/продажи превышают определенный коэффициент, то производится сигнал. Настройки: Timer=5 // указывается как часто обновлять данные по рынку в секундах. Чаще чем раз в 10 секунд ставить не рекомендуется. X-size =700 // размер окна по оси Х. Y-size=650// размер окна по оси Y. Only "Market Watch"
FREE
Coral trend is   a trend-following indicator that is widely popular among FOREX traders . It is usually used as a confluence with other indicators. It uses combinations of moving averages with complex smoothing formulas! It has two configurable parameters: Coefficient   - smoothing ratio (*) Applied price Calculation: Coral = (-0.064) * B6 + 0.672 * B5 - 2.352 * B4 + 2.744 * B3
FREE
Time Session OPEN-HIGH-LOW-CLOSE This Indicator Will Draw Lines Of OHLC Levels Of Time Session Defined By User. It Will Plot Floating Lines On Current Day Chart. Time Session Can Of Current Day Or Previous Day. You Can Plot Multiple Session Lines By Giving Unique ID To Each Session. It Can Even Show Historical Levels Of Time Session Selected By User On Chart To Do Backdating Test. You Can Write Text To Describe The Lines.
FREE
DC Indicator
Lamont Simone Reynecke
The donchian channel indicator might just be the best fit for you Trading in derivative products such as futures, options, CFD's, forex and certificates contains significant risk. These products are not suitable for every investor. Investors could potentially lose all or more than the original investment. If anything, only money equal to personal risk capital should be used and can be lost without jeopardizing financial security or lifestyle. Partially or fully automated trading programs can
FREE
This indicator displays two important pieces of information on the MT5 chart: Current Spread - Trading cost measured in points, helping traders assess optimal entry timing when spread is low. Time Countdown - Remaining time (minutes:seconds) until the current candle closes and a new candle forms, supporting candle-based trading strategies. Information is displayed as compact text in a chart corner (default top-right), with customizable position, color, and font size. The indicator updates in rea
FREE
Smart Session Box Displays Asia, London, and New York trading sessions with automatic timezone adjustment and session overlap highlighting. Main Features Complete session analysis with no limitations. Key Features The indicator draws session boxes with high and low lines for each trading session. Session overlaps are highlighted with distinct colors to identify high liquidity periods. Breakout alerts notify when price crosses previous session levels. A control panel provides quick toggles for al
FREE
Trading Session Indicator The Trading Session Indicator visualizes the high and low points as well as the start and end times of the Asian, London, and New York trading sessions directly on your chart. Features: Visualization of major trading sessions Highlighting of high and low points Display of start and end times for each session Customizable session times User-friendly and efficient Customizability: Each trading session (Asian, London, New York) can be individually customized to match speci
FREE
A simple indicator showing the size of the spread at the current time, the maximum for the day and the maximum for the entire duration of the indicator. Daily statistics of the maximum spread are also displayed, indicating the time when this spread was fixed. The location of the display of the received information can be changed depending on your preferences and positioned anywhere on the screen. It is possible to output alerts about exceeding the size of the spread specified in the input pa
FREE
Original supertrend indicator in Tradingview platform.  Indicator type: Price Action indicator Introduction:   The Supertrend Indicator - Enhancing Your Trend Analysis.  If you haven't yet found a Supertrend indicator with good graphics on the MQL5 platform, this is the indicator for you. Overview:   The Supertrend Indicator is a powerful tool designed to provide traders with valuable insights into the current and historical trends of financial markets. It serves as a valuable addition to any t
FREE
Dynamic Pivot Zones – Your Level Assistant on the Chart This indicator is a bit like a GPS for your trading . It shows you where the price likes to hang out, where it gets nervous, and where it flies through. No more calculating pivots by hand or guessing support and resistance levels. What it does: Automatically plots H1, H4, and D1 pivots . Shows support and resistance zones : R1, R2, S1, S2. Lines are colored and easy to read , so you can instantly see what’s hot or cold. Why you’ll love it:
FREE
Overview QuantumEdge Oscillator is a professional-grade trading indicator that combines advanced momentum analysis with sophisticated trend detection algorithms. This 30-day trial version provides full access to all features, allowing you to thoroughly test its capabilities in live market conditions before making a purchase decision. Key Features Dual-Signal System : Combines RSI moving average with smoothed ATR-based volatility bands Multi-Timeframe Analysis : Built-in support for higher timefr
FREE
The indicator displays the size of the spread for the current instrument on the chart. Very flexible in settings. It is possible to set the maximum value of the spread, upon exceeding which, the color of the spread label will change, and a signal will sound (if enabled in the settings). The indicator will be very convenient for people who trade on the news. You will never enter a trade with a large spread, as the indicator will notify you of this both visually and soundly. Input parameters: Aler
FREE
The Rayol Code Hour Interval Lines indicator was  designed to assist your trading experience.  It  draws the range of hours chosen by the user directly on the chart, so that it enables traders to visualize price movements during their preferred trading hours, providing  traders a more comprehensive view of price movements and market dynamics. This indicator allows the user to choose not only the Broker's time, but also the Local time. This way, the user no longer needs to calculate local time in
FREE
This is Gekko's indicator of quotations and variations. It summarizes quotations and variations of the current symbol in different timeframes as well as other correlated symbols. Keep track of all this information on your chart while you are negotiating for decision making support. Input Parameters General Settings:  configure which quotations and variations you want to keep track for current day, week, month or year as well as M1, M5, M15, M30, H1 and H4 charts; Symbols Configuration: add up to
FREE
Important Lines
Terence Gronowski
4.88 (24)
This indicator displays Pivot-Lines, preday high and low, preday close and the minimum and maximum of the previous hour. You just have to put this single indicator to the chart to have all these important lines, no need to setup many single indicators. Why certain lines are important Preday high and low : These are watched by traders who trade in a daily chart. Very often, if price climbs over or falls under a preday low/high there is an acceleration in buying/selling. It is a breakout out of a
FREE
This spread indicator displays the actual spread of each candle. It highlights the maximum spread and the minimum spread of the chosen symbol. This indicator is very helpful to see in real time the spread evolution helping to avoid taking a trade when the spread is too high. Inputs: Print value in Points: if true displays the spread as a whole number D isplay minimum and maximum spread of the past N days: select the number of days to consider the maximum and minimum spread Automatically adj
FREE
Recommended broker to use the indicator: https://tinyurl.com/5ftaha7c   Indicator developed by Diogo Sawitzki Cansi to show possible trade points. Do not repaint. The results displayed in the past are exactly what happened. We also use it to hold trades longer and not get out on false reversal signals which are actually just a profit taking of trades and no one is trying to reverse the direction of the trend. Indicator Parameters: PERIOD:   Period for analyzing the buying or selling force to fin
FREE
Elevate your trading with the precision of "Big Figures." Financial markets are not driven by random numbers; they are driven by institutional liquidity. Central banks, hedge funds, and major commercial traders consolidate their orders at whole integer levels (e.g., 1.1000, 2000.00, 150.00). These are the "Psychological Magnets" where the real price action happens. RoundLevel Pro for MetaTrader 5 is a high-performance tool designed to visualize this invisible grid of institutional interest with
FREE
MiniCandles
Kiyoshi Mizu Miyabi Nori
5 (1)
This indicator is a very simple indicator that draws candlesticks on a chart. However, it is possible to draw not only on the main chart but also on several sub-charts. In addition,it is possible to draw different symbols and timeframes from the main chart. features. 1. any symbols 2. any timeframes 3. two candle type(normal and heikin ashi) 4. many candle colors(intersection with ma_1) 5. pivot line (ver1.2) In case of positive candle,    FULL     : change color if low is over ma_1    PARTIAL :
FREE
FlatBreakout MT5 (Free Version) Flat Range Detector and Breakout Panel for MT5 — GBPUSD Only FlatBreakout MT5   is the free version of the professional FlatBreakoutPro MT5 indicator, specially designed for flat (range) detection and breakout signals on the   GBPUSD   pair only. Perfect for traders who want to experience the unique fractal logic of FlatBreakout MT5 and test breakout signals on a live market without limitations. Who Is This Product For? For traders who prefer to trade breakout of
FREE
このプロダクトを購入した人は以下も購入しています
Neuro Poseidon is a new indicator by Daria Rezueva. It combines precise trading signals with adaptive TP/SL levels - creating best possible trades as a result! Message me and get  Neuro Poseidon Assistant  as a gift to automize your trading process! What makes it stand out? 1. Proven profitability on all assets and timeframes 2. Only confirmed BUY and SELL signals present on the chart 3. Adaptive TP & SL levels generated by the software for each trade 4. Easy to understand - suitable for al
SuperScalp Pro
Van Minh Nguyen
4.67 (27)
SuperScalp Pro – 高度なマルチフィルタースキャルピングインジケーターシステム SuperScalp Pro は、クラシックな Supertrend と複数のインテリジェント確認フィルターを組み合わせた高度なスキャルピングインジケーターです。M1 から H4 まで複数の時間足で効率的に動作し、XAUUSD、BTCUSD、主要 Forex 通貨ペア向けに最適化されています。 このインジケーターは明確な Buy / Sell シグナルを提供し、ATR に基づいてエントリー価格、Stop Loss、Take Profit を自動計算します。Fibonacci Take Profit 機能により、重要な価格帯で早期決済し、到達時に通知を送信します。 初期設定では Fibonacci Take Profit が有効化されており、より安定した取引体験を重視しています。チャートに適用するだけですぐ利用可能です。上級者向けに、すべてのパラメータは自由にカスタマイズできます。 完全なドキュメントは製品ブログにあります: [User Guide] SuperScalp Pro Auto T
まず正直に言いましょう。 どんなインジケーターも、それ単体であなたを利益化させることはできません。もしそう言う人がいるなら、それは夢を売っているだけです。完璧な売買シグナル(矢印)を表示するインジケーターは、いくらでも“完璧に見せる”ことができます。正しい過去の区間を拡大して、勝ちトレードだけを切り取ればいいだけです。私たちはそれをしません。 SMC Intraday Formula はツールです。 市場構造を読み取り、最も高い確率の価格ゾーンを特定し、今この瞬間のスマートマネーの痕跡をシンプルな言葉で正確に示します。最終判断はあなたが行います。トレードを実行するのもあなたです。しかし今は「希望」ではなく「精度」でエントリーできます。 私たちはこのインジケーターを、ゴールド(XAUUSD)および主要FX通貨ペアで約3年間、日々のスキャルピングに使用してきました。M1、M5、M15、M30の主要ツールです。これは未来を予測しようとするのではなく、今まさに形成されている高確率セットアップを示し、その理由を説明します。 他のすべてのインジケーターと何が違うのか? ほとんどのトレーディングイ
Gold Entry Sniper – ゴールドスキャルピング&スイングトレード用プロフェッショナル多時間足ATRダッシュボード Gold Entry Sniper は、XAUUSDや他の銘柄向けに正確な 売買シグナル を提供する、MetaTrader 5用の高度なインジケーターです。 ATRトレーリングストップロジック と 多時間足分析ダッシュボード を搭載し、スキャルピングからスイングトレードまで対応します。 主な特徴と利点 多時間足シグナル分析 – M1、M5、M15 のトレンドを同時表示。 ATRベースのトレーリングストップ – ボラティリティに応じて動的に調整。 プロ仕様のチャートダッシュボード – シグナル状況、ATRレベル、回帰線、売買方向を表示。 明確な売買マーカー – 自動矢印とテキストラベル。 エグジットアラートとトレード管理 – 利益確定のための自動検出。 完全カスタマイズ可能 – パネル位置、色、フォント、ATR/回帰設定を調整可能。 ゴールド(XAUUSD)に最適化 – M1〜M15のスキャルピングに最適、FXや指数、暗号資産にも対応。 Gold Entry
この製品は 2026 年の市場向けに更新され、最新の MT5 ビルドに最適化されています。 価格更新のお知らせ: Smart Trend Trading System は現在 $99 で提供されています。 次の 30 件の購入 後、価格は $199 に上がります。 特別オファー: Smart Trend Trading System を購入後、私にプライベートメッセージを送ることで、 Smart Universal EA を無料 で受け取り、Smart Trend のシグナルを自動売買に変えることができます。 Smart Trend Trading System は、リペイントなし、再描画なし、遅延なしの完全なトレーディングシステムです。よりクリーンなシグナル、より明確なトレンド方向、そしてより整理された取引方法を求めるトレーダー向けに作られています。 Online course , manual and download presets . このシステムは、トレンド検出、反転ゾーン、Smart Cloud、トレーリングストップロジック、サポートとレジスタンス、ローソク足の色分け、ア
Entry In The Zone and SMC Multi Timeframe is a real-time 2-in-1 market analysis tool that combines market structure analysis and a No Repaint BUY / SELL signal system into a single indicator, built on Smart Money Concepts (SMC) — a widely adopted framework used by professional traders to understand market structure. This indicator helps you see the market more clearly, make decisions based on structure rather than guesswork, and focus on high-probability zones where price is more likely to react
トレンドキャッチャーインジケーター トレンドキャッチャーインジケーターは、開発者独自の適応型トレンド分析指標を組み合わせることで、市場価格の動きを分析します。短期的なノイズを除去し、根底にあるモメンタムの強さ、ボラティリティの拡大、価格構造の挙動に焦点を当てることで、真の市場方向性を特定します。また、移動平均線、RSI、ボラティリティフィルターなどの平滑化およびトレンドフィルタリング機能を備えたカスタマイズ指標も使用します。 実際の運用状況のモニタリングやその他の製品については、こちらをご覧ください: https://www.mql5.com/en/users/mechanic/seller ご注意ください。私はTelegramでEAや設定を販売していません。詐欺です。すべての設定はブログで無料で公開しています。 重要!ご購入後すぐにご連絡ください。手順とボーナスをお送りします!
Quantum TrendPulse を ご紹介します。これは、   SuperTrend   、   RSI   、および Stochastic のパワーを 1 つの包括的なインジケーターに組み合わせて、取引の可能性を最大限に引き出す究極の取引ツールです。精度と効率を求めるトレーダー向けに設計されたこのインジケーターは、市場のトレンド、勢いの変化、最適なエントリー ポイントとエグジット ポイントを自信を持って特定するのに役立ちます。 主な特徴: SuperTrend 統合: 現在の市場動向に簡単に追従し、収益性の波に乗ることができます。 RSI精度: 買われすぎと売られすぎのレベルを検出し、市場の反転のタイミングに最適で、SuperTrendのフィルターとして使用されます。 確率的精度: 確率的振動を活用して、変動の激しい市場で隠れたチャンスを見つけます。SuperTrend のフィルターとして使用されます。 マルチタイムフレーム分析:   M5 から H1 または H4 まで、さまざまなタイムフレームで市場を常に把握します。 カスタマイズ可能なアラート: カスタム取引条件が満たされ
このインジケーターを購入された方には、以下の特典を 無料 で提供しています: 各トレードを自動で管理し、ストップロスとテイクプロフィットを設定し、戦略ルールに基づいてポジションを決済する補助ツール 「Bomber Utility」 様々な銘柄に合わせたインジケーターの設定ファイル(セットファイル) 「最小リスク」、「バランスリスク」、「待機戦略」 の3つのモードで使用できる Bomber Utility 用の設定ファイル このトレーディング戦略をすぐに導入・設定・開始できる ステップバイステップのビデオマニュアル ご注意: 上記の特典を受け取るには、MQL5のプライベートメッセージシステムを通じて販売者にご連絡ください。 オリジナルのカスタムインジケーター 「Divergence Bomber(ダイバージェンス・ボンバー)」 をご紹介します。これは、MACDのダイバージェンス(乖離)戦略に基づいた 「オールインワン」型のトレーディングシステム です。 このテクニカルインジケーターの主な目的は、価格とMACDインジケーターの間に発生するダイバージェンスを検出 し、将来の価格の動きを示す
PrimeScalping is a powerful trading companion designed to generate high-probability entry signals with dynamic TP/SL/DP levels based on volatility. Built-in performance tracking shows win/loss stats, PP1/PP2 hits, and success rates — all updated live. Key Features: Buy/Sell signals with adaptive volatility bands Real-time TP/SL/DP levels based on ATR Built-in MA Filter with optional ATR/StdDev volatility Performance stats panel (Success, Profit/Loss, PP1/PP2) Alerts via popup, sound, push, or e
Power Candles V3 - 自己最適化型強弱インジケーター Power Candles V3は 、通貨や銘柄の強さを、適用されたすべてのチャート上で実行可能なトレードプランに変換します。単にローソク足を色分けするだけでなく、バックグラウンドでリアルタイムの自動最適化を実行し、目の前の銘柄に対して最適なストップロス、テイクプロフィット、およびシグナルの閾値を提示します。ワンクリックで実取引に適用でき、エントリーポイント、ストップロス、テイクプロフィットのラインが正確な価格位置にチャート上に表示され、方向性を示すアラートがリアルタイムで発動します。 このツールは、Stein Investmentsのエコシステムの一部です。  18種類以上のツールをすべて閲覧し、AIを活用したセットアップの推奨事項を入手し、  https://stein.investments でコミュニティに参加しましょう クローズしたバーごとに3,000回以上のトレードシミュレーション。9つの強さの状態。2つの戦略を並行してテスト。勝率の高い設定をワンクリックで適用。 なぜこれが必要なのか ほとんどの強
FX Trend NG:次世代マルチマーケット・トレンドインテリジェンス 概要 FX Trend NG は、複数の時間足に対応したプロフェッショナル向けトレンド分析およびマーケット監視ツールです。 市場全体の構造を数秒で把握することができます。 複数のチャートを切り替える必要はありません。どの銘柄がトレンド中なのか、どこでモメンタムが弱まっているのか、そしてどの時間足で強い整合性があるのかを瞬時に確認できます。 ローンチ特別オファー – FX Trend NG を $30(6ヶ月) または $80 永久ライセンス でご利用いただけます。 すでに Stein Investments のユーザーですか? -> メッセージを送信 して、プライベートグループへアクセスしてください。 セットアップや詳細情報が必要ですか? -> Stein Investments 公式ページ をご覧ください。 1. FX Trend NG が他と異なる理由 3ステート・トレンドロジック ― Buy と Sell だけではない • 多くのインジケーターは Buy または Sell の2状態のみを表示します。
Gann Made Easy   は、ミスター・ギャンの理論を使用した取引の最良の原則に基づいた、プロフェッショナルで使いやすい外国為替取引システムです。 W・D・ガン。このインジケーターは、ストップロスとテイクプロフィットレベルを含む正確な買いと売りのシグナルを提供します。 PUSH通知を利用して外出先でも取引可能です。 ご購入後、取引方法の説明と優れた追加インジケーターを無料で入手するには、私にご連絡ください! おそらく、ギャンの取引手法についてはすでに何度も聞いたことがあるでしょう。通常、ギャンの理論は初心者のトレーダーだけでなく、すでにある程度の取引経験がある人にとっても非常に複雑なものです。なぜなら、ギャンの取引手法は理論的にはそれほど簡単に適用できるものではないからです。私はその知識を磨き、最良の原則を私の外国為替インジケーターに組み込むために数年を費やしました。 このインジケーターは非常に簡単に適用できます。必要なのは、それをチャートに添付し、簡単な取引推奨事項に従うだけです。このインジケーターは常に市場分析の仕事を行い、取引の機会を探します。適切なエントリーポイントを検
この製品は 2026 年の市場向けに更新され、最新の MT5 ビルドに最適化されています。 価格更新のお知らせ: Atomic Analyst は現在 $99 で提供されています。 次の 30 件の購入 後、価格は $199 に上がります。 特別オファー: Atomic Analyst を購入後、私にプライベートメッセージを送ることで、 Smart Universal EA を無料 で受け取り、Atomic Analyst のシグナルを自動売買に変えることができます。 Atomic Analyst は、リペイントなし、再描画なし、遅延なしの Price Action トレーディングインジケーターで、手動取引、シグナルの明確化、EA 自動化のために設計されています。 User manual: settings, inputs and strategy. 価格行動、強さ、モメンタム、マルチタイムフレーム方向、高度なフィルターを分析し、トレーダーがノイズを減らし、弱いセットアップを避け、より構造化された取引判断を行えるようにします。 このインジケーターは、複雑な市場計算をシンプルな視覚シ
開発者からのお知らせ: 129ドル で購入できるライセンスは残り 1つ です。売り切れ後、価格は 149ドル に変更されます。 M1 Quantum は、M1専用のプロフェッショナルトレーディングシステムであり、ストップロス、テイクプロフィット、スマートな資金管理を内蔵した、迅速かつ正確な取引シグナルを提供します。 M1 Quantum は、 連続勝利 に重点を置いて口座を素早く成長させるために設計されたプロフェッショナルな資金管理を備えています。 M1 Quantum インジケーター の主な特徴 M1時間足 およびすべての 主要通貨ペア 向けに設計 すべての取引にストップロスとテイクプロフィットを設定 資金管理 を実装し、トレーダーが簡単に取引できるようサポート 高い勝率と高い 連続勝利 リペイントなし、遅延なし あらゆるトレーダーにとって理解しやすい M1 Quantum を使用するには、 M1 Quantum Assistant が必要です。この強力なツールは、M1 Quantum をご購入いただいたすべてのお客様に 無料 で提供されています。 M1 Quantum Assis
この製品は 2026 年の市場向けに更新され、最新の MT5 ビルドに最適化されています。 価格更新のお知らせ: Smart Price Action Concepts は現在 $200 で提供されています。 次の 30 件の購入 後、価格は $299 に上がります。 特別オファー: 購入後、私にプライベートメッセージを送ることで、 無料ボーナス + ギフト を受け取ることができます。 まず、このトレーディングツールはリペイントなし、再描画なし、遅延なしのインジケーターであり、プロフェッショナルな取引に最適であることを強調しておきます。 Online course , and manual Smart Price Action Concepts Indicator は、初心者から経験豊富なトレーダーまで使える非常に強力なツールです。20 種類以上の便利なインジケーターを 1 つにまとめ、Inner Circle Trader Analysis や Smart Money Concepts Trading Strategies などの高度な取引アイデアを組み合わせています。このインジケ
Market Structure Order Block Dashboard MT5 は、市場構造と主要な価格反応ゾーンをチャート上で直接読み取りたいトレーダー向けに設計された MT5 インジケーターです。BOS、ChoCH、オーダーブロック、Fair Value Gap (FVG)、流動性、Kill Zones、Volume Profile、そして素早い分析のためのコンパクトなダッシュボードを組み合わせています。 本インジケーターは、市場構造、ICT、Smart Money の概念を意思決定の枠組みとして使用するトレーダーを対象としています。トレンド継続、反転の可能性、価格の不均衡、流動性ターゲット、注目ゾーンをより構造的に特定する助けとなります。 購入者向けの付属リソース 購入後、MQL5 のプライベートメッセージにてご依頼いただくと、完全な PDF ユーザーガイドとパラメータ設定のヒントを提供いたします。MQL5 のプライベートメッセージによる直接的な技術サポート。 バージョン 1.20 では 2 つの重要な追加機能があります: Pending BOS / Pending Cho
ARIPoint
Temirlan Kdyrkhan
1 (1)
ARIPoint is a powerful trading companion designed to generate high-probability entry signals with dynamic TP/SL/DP levels based on volatility. Built-in performance tracking shows win/loss stats, PP1/PP2 hits, and success rates all updated live. Key Features: Buy/Sell signals with adaptive volatility bands Real-time TP/SL/DP levels based on ATR Built-in MA Filter with optional ATR/StdDev volatility Performance stats panel (Success, Profit/Loss, PP1/PP2) Alerts via popup, sound, push, or email Cu
GoldenX Entryは、MT5向けのインジケーターであり、適応型Smart Entry Trendアルゴリズム、シグナルスコアリングシステム、マーケットレジーム検出機能、およびボラティリティフィルターを備えています。各シグナルには、計算されたエントリーレベル、3つのテイクプロフィット(TP1、TP2、TP3)、およびストップロスレベルが含まれます。本インジケーターは、異なる市場環境に適応するために設計された複数の分析レイヤー上に構築されており、マルチレイヤー分析システムと内蔵オプティマイザーおよび統計トラッキングシステムを組み合わせています。リスク・リワード(RR)指標および過去のトレード履歴に基づく定量分析を提供します。 使い始めは簡単です — 選択した時間足でオプティマイザーを実行し、そのままチャート上でインジケーターを使用します。 コア機能 GoldenX Entryは、シグナルエンジンとトレード管理機能、そして過去統計トラッキングを1つのチャートに統合しています: - 内蔵オプティマイザー: オプティマイザーはチャート上でワンクリックで実行できます。200通りのパラメー
Azimuth Pro
Ottaviano De Cicco
5 (7)
Azimuth Pro V2:MT5向けシンセティック・フラクタル構造分析と確認済みエントリー 概要 Azimuth Pro は Merkava Labs によるマルチレベルスイング構造インジケーターです。4つのネストされたスイングレイヤー、スイングアンカーVWAP、ABCパターン検出、3タイムフレーム構造フィルタリング、そして確定バーでの確認済みエントリー — 1つのチャートで、ミクロスイングからマクロサイクルまでを網羅するワークフロー。 これはブラインドシグナル製品ではありません。ロケーション、コンテキスト、タイミングを重視するトレーダーのための構造ファーストワークフローです。 V2発売記念オファー — Azimuth Pro V2をUSD 399で(次の100本)。最終価格:USD 499。 1. V2での変更点 シンセティック・マルチタイムフレームエンジン 上位タイムフレーム分析をMeridian Proと同じ独自のシンセティックアーキテクチャで一から再構築。よりクリーンなHTFコンテキスト、安定したライブ動作、従来のMTF同期問題なし。シンセティックエンジンは 固定比率タ
GEM Signal Pro GEM Signal Pro は、MetaTrader 5 向けのトレンドフォロー型インジケーターです。より明確なシグナル、より整理されたトレードセットアップ、そして実用的なリスク管理をチャート上で確認したいトレーダーのために設計されています。 単純な矢印だけを表示するのではなく、GEM Signal Pro はトレード全体の考え方を、より見やすく分かりやすい形で表示します。条件が確認されると、インジケーターはエントリー価格、ストップロス、利確目標をチャート上に表示し、トレードセットアップをより効率的に確認できるようにします。 動作の仕組み このインジケーターは、まず内部ロジックに基づいて有効なシードシグナルを検出します。 確認条件が満たされると、GEM Signal Pro はチャート上に完全なセットアップを表示します。これにより、トレーダーはトレード構造をより明確に把握し、手作業による分析を減らすことができます。 チャート上のトレードレベル 確認済みシグナルに対して、GEM Signal Pro は以下を表示できます。 エントリー価格 ストップロス テ
Crystal Heikin Ashi Signals - Professional Trend & Signal Detection Indicator Advanced Heikin Ashi Visualization with Intelligent Signal System for Manual & Automated Trading Final Price: $149 ---------> Price goes up $10 after every 10 sales . Limited slots available — act fast . Overview Crystal Heikin Ashi Signals is a professional-grade MetaTrader 5 indicator that combines pure Heikin Ashi candle visualization with an advanced momentum-shift detection system. Designed for both manual traders
Reversion King Indicator
Eugen-alexandru Zibileanu
5 (4)
新たな王者が登場 - インジケーター + 注文管理表示(TP1 + TP2 + TP3)+ オプションのTelegramシグナル送信機能付き(無料) (完全なトレード&シグナルシステム) ゴールド向け最高のEA: Gold Slayer このインジケーターには、高度な戦略、カスタマイズ可能な注文管理システム、そしてエンベロープ拡張を組み合わせた平均回帰システムが搭載されています。さらに、RSIなど複数のインテリジェントな確認フィルターによって、高確率の反転エントリーをBUY・SELLシグナルとして検出します。 単にトレードを学ぶだけでなく、複数ポジションを効果的に管理し、過去に利益を出しているオープンポジションで損失トレードをカバーする方法も学べます。 M5向けに構築・最適化されており、流動性が高くシグナルの精度が安定しているBTCUSDとXAUUSDで優れたパフォーマンスを発揮します。 このインジケーターは、ATRを基に自動計算されたエントリー、ストップロス、テイクプロフィットレベルを備えた明確なLong・Shortシグナルを提供するため、リスク管理が最初から組み込まれています。 マ
KURAMA GOLD SIGNAL PRO(MT5版)— 7層フィルター・自動TP/SL・品質スコア・サイン履歴保存搭載 XAUUSD完全トレードシステム リアルタイムでリペイントしません。サインが出た瞬間、矢印・エントリー・TP・SLはその場で固定され、後から動きません。あなたがトレードするのは、この「リアルタイムで出たサイン」です。さらにv7.20では、実際に通知されたサインを自動保存し、再起動後もそのまま復元します。 購入者限定特典 買い切りライセンスをご購入いただいた方に、AI Zone Radar($59相当)+完全PDFマニュアルを無料プレゼント。本体価格に$59相当の特典が付いてきます。購入後にMQL5でメッセージをお送りください。 AI Zone Radar: https://www.mql5.com/en/market/product/175834 ゴールドトレーダーのコミュニティで実際に使用され、精度と使いやすさで高く評価されています。 あな
Quant Direction は、3次元の市場分析ツールです。完全に客観的なアルゴリズムベースの市場分析を提供し、様々なパラメータにわたる正確なパーセンテージ偏差を同時に算出します。高度なAI搭載モデリングツールで開発され、厳密なテストを経て開発されたこのアルゴリズムは、かつてない精度で市場を分析するように設計されています。プラットフォーム上では、あらゆる通貨ペアや金融商品を分析できます。 短期取引、デイトレード、スイングトレードなど、どのような取引スタイルに も、Quant Directionは最適な選択肢です。 オペレーターの本当の利点 Quant Directionの真の利点は、感情、眼精疲労、過剰分析を完全に排除できる点にあります。方向性を探るために何十ものチャートを手作業で精査したり、自分の好みを常に疑ったりする必要がなくなります。このシステムは、8つの時間間隔(5ヶ月から月単位まで)をミリ秒単位で処理します。あらゆる瞬間に市場を支配している主体を正確に明らかにし、常に成功確率が最も高い方向で取引できるようにします。 市場分析の3つの側面 このアルゴリズムは市場を3つの
優れたテクニカルインジケーター「Grabber」をご紹介します。これは、すぐに使える「オールインワン」トレーディング戦略として機能します。 ひとつのコードに、市場のテクニカル分析ツール、取引シグナル(矢印)、アラート機能、プッシュ通知が強力に統合されています。 このインジケーターを購入された方には、以下の特典を無料で提供します: Grabberユーティリティ:オープンポジションを自動で管理するツール ステップバイステップのビデオマニュアル:インジケーターのインストール、設定、取引方法を解説 カスタムセットファイル:インジケーターをすばやく自動設定し、最大限の成果を出すための設定ファイル 他の戦略はもう忘れてください!Grabberだけが、あなたを新たなトレードの高みへと導いてくれるのです。 Grabber戦略の主な特徴: 推奨タイムフレーム:M5〜H4 対応通貨ペア・資産:どれでも使用可能ですが、私が実際に検証した以下を推奨します(GBPUSD、GBPCAD、GBPCHF、AUDCAD、AUDUSD、AUDSGD、AUDCHF、NZDUSD、NZDCAD、EURCAD、EURUSD、E
ご紹介     Quantum Breakout PRO は 、ブレイクアウト ゾーンの取引方法を変革する画期的な MQL5 インジケーターです。 13年以上の取引経験を持つ経験豊富なトレーダーのチームによって開発されました。     クォンタム ブレイクアウト プロ   は、革新的でダイナミックなブレイクアウト ゾーン戦略により、あなたのトレーディングの旅を新たな高みに押し上げるように設計されています。 クォンタム ブレイクアウト インジケーターは、5 つの利益ターゲット ゾーンを備えたブレイクアウト ゾーン上のシグナル矢印と、ブレイクアウト ボックスに基づいたストップロスの提案を提供します。 初心者トレーダーにもプロのトレーダーにも適しています。 量子EAチャネル:       ここをクリック 重要!購入後、インストールマニュアルを受け取るためにプライベートメッセージを送ってください。 推奨事項: 時間枠: M15 通貨ペア: GBPJPY、EURJPY、USDJPY、NZDUSD、XAUUSD アカウントの種類: ECN、Raw、またはスプレッドが非常に低い R
SmartScalping is a powerful trading companion designed to generate high-probability entry signals with dynamic TP/SL/DP levels based on volatility. Built-in performance tracking shows win/loss stats, PP1/PP2 hits, and success rates — all updated live. Key Features: Buy/Sell signals with adaptive volatility bands Real-time TP/SL/DP levels based on ATR Built-in MA Filter with optional ATR/StdDev volatility Performance stats panel (Success, Profit/Loss, PP1/PP2) Alerts via popup, sound, push, or e
RelicusRoad Pro: 定量的市場オペレーティングシステム 【期間限定】無制限アクセス 70% OFF - 2,000人超のトレーダーと共に なぜ多くのトレーダーは「完璧な」インジケーターを使っても失敗するのでしょうか? それは、文脈を無視して 単一の概念 だけでトレードしているからです。文脈のないシグナルは単なるギャンブルです。勝ち続けるには、 根拠の重なり(コンフルエンス) が必要です。 RelicusRoad Proは単なる矢印インジケーターではありません。完全な 定量的市場エコシステム です。独自のボラティリティモデリングを用いて、価格が推移する「適正価値の道(Fair Value Road)」をマッピングし、ノイズと真の構造的ブレイクを判別します。 推測はやめましょう。機関投資家レベルの「ロード・ロジック」でトレードを。 コアエンジン:「Road」アルゴリズム システムの中心となる Road Algo は、市場環境にリアルタイムで適応するダイナミックなボラティリティチャネルです。 安全ライン(平衡点) と、価格が数学的に反転しやすい 拡張レベル を投影します。 Si
Smart Stop Indicator – チャート上で実現するインテリジェントなストップロス精度 概要 Smart Stop Indicator は、ストップロスを勘や感情ではなく、明確で体系的に設定したいトレーダーのために設計されています。本ツールは、クラシックなプライスアクション(高値更新・安値切り下げ)と最新のブレイクアウト認識ロジックを組み合わせ、次に来るべき論理的なストップレベルを正確に特定します。トレンド相場、レンジ、急速なブレイクアウト局面のいずれであっても、最適な SL ゾーンとその状態(“new”、“broken”、“valid”)をチャート上に直接表示します。さらに今回、SL 距離の %ADR 表示も新たに追加されています。 主な特徴 マーケット構造に基づく自動ストップ配置 • 市場構造とリアルタイムの値動きに基づき、意味のあるストップロスレベルを自動検出します。 スマートなブレイクアウト感知 • 急激な方向転換やブレイクアウトにも柔軟に対応し、早すぎるストップ調整を避けます。 SL %ADR の表示 • ストップロスまでの距離を ADR(Averag
作者のその他のプロダクト
*** IMPORTANT NOTE: For the best visual experience, please change your standard chart type to 'Line Chart' (Alt+3) and set the 'Line Graph' color to 'None' in chart properties (F8) to hide the default MetaTrader candles. *** LZ Kyushu Legs Basic is a streamlined visual momentum indicator that replaces traditional Japanese candlesticks with noise-free, wickless Kyushu Legs. By focusing exclusively on pure price momentum and filtering out market noise, this tool allows traders to easily identify
FREE
*** IMPORTANT NOTE: The indicator dynamically adapts to your chart background. Try switching between Light and Dark themes for the best visual experience. *** LZ Session Boxes Indicator is a streamlined, automated session time indicator designed to simplify your daily market analysis. It accurately draws the three major trading sessions (London, New York, and Asia) directly on your chart for the current trading day. Powered by an intelligent Auto-DST (Daylight Saving Time) detection engine, t
FREE
LZ Auto Fibo Retracement automatically detects the most significant swing highs and lows on your chart and instantly draws accurate Fibonacci retracement levels between them. Stop drawing Fibs manually—let the indicator do it for you dynamically as the market evolves. Feature highlights - Auto Swing Detection: identifies the most relevant market extremes based on a configurable swing period and lookback range. - Dynamic Updates: the Fibonacci levels automatically adjust to new highs and lows
FREE
LZ Candle Timer displays the remaining time before the current bar closes and a new bar forms. It helps you manage entries and exits around candle closes. The indicator uses server time, updates every second, and is optimized for smooth display with minimal CPU use. Feature highlights - Selectable location: place the timer in any of the four chart corners (Upper Left, Upper Right, Lower Left, Lower Right). Offsets and padding are configurable. - Alarm colour: when fewer than X seconds remain
FREE
LZ Spread Monitor is a professional utility designed to help traders monitor transaction costs and execution quality in real-time. It provides instant feedback on current market conditions, helping you avoid trading during high-spread periods (news releases, rollovers, low liquidity). Key Features - Spread Analytics: Monitor Current, Minimum, Maximum, and Average spread for the session. - Cost Calculator: Instantly see the monetary cost of the spread for a specific lot size (e.g., 1.0 Lot = $
FREE
LZ Fibo Ribbon displays a smooth ribbon of four Exponential Moving Averages (EMAs) calibrated to the popular Fibonacci sequence numbers (21, 34, 55, 89) by default. This combination forms a dynamic band of support and resistance on your chart, making it easy to instantly identify trend direction, momentum, and potential pullback zones. Feature highlights - Trend Identification: clearly visualizes the trend direction and strength based on the spacing and order of the moving averages within the
FREE
LZ FMA Composite builds a single “composite” moving average from fifteen Exponential Moving Averages (EMAs) whose periods follow the Fibonacci sequence (from 2 up to 1597). Instead of cluttering the chart with fifteen lines, the indicator aggregates them per bar into one value using your choice of arithmetic mean, median, or weighted mean (with bias toward longer or shorter periods). The result is plotted as a two-colour trend line: segments highlight upward vs downward movement along the compo
LZ Session Boxes PRO is a professional-grade tool for day traders, designed to beautifully visualize global trading sessions (Asia, Pacific/Sydney, London, New York) across your entire chart history. It eliminates the confusion of broker time offsets by automatically detecting timezones and adjusting for Daylight Saving Time (DST), ensuring your session boxes always align perfectly with real-market hours. Feature highlights - 4 Major Sessions: highlights Asian, Pacific (Sydney), London, and N
** IMPORTANT NOTE: For the best visual experience, please change your standard chart type to 'Line Chart' (Alt+3) and set the 'Line Graph' color to 'None' in chart properties (F8) to hide the default MetaTrader candles. *** LZ Kyushu Legs PRO is an advanced visual momentum indicator that replaces traditional Japanese candlesticks with noise-free, wickless Kyushu Legs. By focusing exclusively on pure price momentum and filtering out market noise, this tool allows traders to easily identify the d
フィルタ:
レビューなし
レビューに返信