Volume Bubbles Order Flow Footprint

VOLUME BUBBLES ORDERFLOW FOOTPRINT PROFESSIONAL

Expert Advisor for MetaTrader 5

Complete Feature Documentation

Introduction:

Volume Bubbles OrderFlow Footprint Professional is an advanced order flow visualization tool designed for the MetaTrader 5 platform. It provides institutional-grade market analysis through real-time volume bubbles visualization, volume profiling, and sophisticated order flow analysis. This Expert Advisor transforms raw market data into actionable trading intelligence, helping traders identify high-probability trading opportunities by revealing the underlying market microstructure.

Main Interface Components:

Header Information Panel

The header panel displays critical market information at a glance, providing traders with essential data without cluttering the main chart area.

  • Symbol and Timeframe Display: Shows the current trading instrument and chart timeframe prominently in the top-left corner for quick reference.

  • Real-Time Price Information: Displays current Bid and Ask prices with color-coded directional indicators showing price movement.

  • Spread Monitor: Shows the current bid-ask spread in both points and pips, essential for scalping and high-frequency trading strategies.

  • Session Price Chart: A mini area chart displaying session price movement with gradient fill, providing visual context of the day's price action. Customizable bull and bear colors available.

  • Multi-Timeframe Trend Boxes: Color-coded boxes showing trend direction across M15, H1, H4, D1, and W1 timeframes, enabling traders to align with higher timeframe trends.


Volume Bubbles OrderFlow

The central volume bubbles is the core visualization tool, displaying order flow data in a bubble style format that reveals market liquidity and trading activity.

  • Real-Time Volume Visualization: Each cell represents volume traded at a specific price level during a time column, with color intensity indicating volume magnitude.

  • Configurable Columns: Supports up to 80 columns of historical data, configurable via InpHeatmapColumns parameter.

  • Price Level Resolution: Adjustable price levels (InpPriceLevels) and ticks per level (InpTicksPerLevel) for precise market depth visualization.

  • Column Update Frequency: Customizable update interval (InpColumnUpdateMs) allowing balance between detail and performance.

  • Auto-Scroll Feature: Automatically keeps current price centered in the visible area when enabled (InpAutoScroll), with configurable margin (InpScrollMargin).

  • Cell Background Coloring: Optional background coloring based on cumulative volume at each price level, showing areas of high trading activity.

  • Cell Flash Animation: Visual flash effect when trades occur at specific price levels, with configurable duration (InpCellFlashDuration) and intensity (InpCellFlashCount).


Volume Bubbles

Volume bubbles provide an intuitive visual representation of individual trades, with size proportional to trade volume.

  • Dynamic Sizing: Bubble size scales between minimum (InpBubbleMinSize) and maximum (InpBubbleMaxSize) based on trade volume relative to recent activity.

  • Volume Threshold: Only trades exceeding the minimum volume threshold (InpMinBubbleVolume) generate bubbles, filtering out noise.

  • Color Coding: Buy trades display in the theme's bull color; sell trades display in the bear color for instant directional recognition.

  • Transparency Control: Adjustable alpha transparency (InpBubbleAlpha) allows bubbles to overlay without obscuring underlying data.

  • Outline Enhancement: Configurable outline width (InpBubbleOutlineWidth) improves bubble visibility against varying backgrounds.

  • Flash Animation: New bubbles flash briefly when created (InpBubbleFlash), drawing attention to fresh market activity. Duration controlled by InpBubbleFlashDuration.

  • Smooth Scrolling: Bubbles scroll smoothly with sub-pixel positioning as new columns are added, maintaining visual continuity.


Big Order Detection and Alerts

Large institutional orders are highlighted with special visual treatments to help traders identify significant market participants.

  • Threshold Configuration: Define what constitutes a big order via InpBigOrderThreshold parameter, typically set based on the instrument's average trade size.

  • Visual Text Labels: Large orders display volume text directly on the chart when InpShowBigOrderText is enabled.

  • Flash Size Threshold: Separate threshold (InpBigOrderFlashSize) for triggering flash animations on medium-to-large orders.

  • Custom Font Settings: Big order labels use dedicated font (InpBigOrderFont) and size (InpBigOrderFontSize) for optimal visibility.

  • Large Buy/Sell Detection: System tracks when large buy or sell orders occur, displaying alerts in the DOM Info panel.


Depth of Market (DOM) Panel

The DOM panel provides a traditional order book view, showing pending orders and recent trading activity at each price level.

  • Price Ladder Display: Vertical price ladder showing configurable number of levels (InpDOMLevels) above and below current price.

  • Bid/Ask Volume Bars: Horizontal bars showing cumulative volume at each price level, with separate colors for bid and ask sides.

  • Volume Profile Integration: Mini volume profile bars overlaid on the DOM showing historical volume distribution.

  • Trade Flash Indication: Price levels flash briefly when trades occur (InpDOMFlashDuration), indicating active price levels.

  • Current Bid/Ask Highlighting: Special highlighting for the current bid and ask prices with horizontal separator line.

  • Panel Width Control: Adjustable panel width (InpDOMWidth) to balance detail with screen real estate.


DOM Information Panel

Positioned below the DOM, this panel provides real-time analysis of order book dynamics.

  • Bids Rising/Falling Indicator: Shows whether bid-side pressure is increasing or decreasing, with directional arrow and color coding.

  • Large Order Detection Display: Prominently displays when large buy or sell orders are detected in the market.

  • Market State Indicator: Shows current market conditions when no large orders are present.

Time and Sales Panel

The Time and Sales panel provides a real-time tape of all executed trades, essential for reading market momentum and identifying aggressive buyers or sellers.

  • Trade Tape Display: Scrolling list of recent trades showing time, price, and size with color coding for buy/sell direction.

  • Configurable Row Count: Adjustable number of visible trades (InpTimeSalesRows) to balance information density with readability.

  • Big Order Highlighting: Large trades are highlighted with special styling for quick identification.

  • Panel Width Control: Adjustable width (InpTimeSalesWidth) for optimal display on different screen sizes.

Time and Sales Information Panel

This panel summarizes Time and Sales data to show who currently controls the market.

  • Buyers/Sellers In Control: Displays whether buyers or sellers dominate recent trading activity, calculated from the last 20 trades using a rolling window for responsive updates.

  • Directional Arrow: Up arrow for buyer control, down arrow for seller control, with corresponding color coding.

  • Buy/Sell Volume Totals: Shows cumulative buy and sell volume from the Time and Sales data for the current session.


Bid and Ask Price Lines

Visual markers for current bid and ask prices help traders identify the current market spread and price location.

  • Bid Line: Horizontal line at current bid price, toggleable via InpShowBidLine.

  • Ask Line: Horizontal line at current ask price, toggleable via InpShowAskLine.

  • Line Thickness: Configurable line width (InpLineThickness) for visibility on different screen resolutions.

  • Theme-Based Colors: Lines automatically use the current theme's bull and bear colors.


Price Grid Overlay

Optional grid lines help with price level identification and chart readability.

  • Toggle Control: Grid can be enabled or disabled via InpShowGrid parameter.

  • Custom Color: Set a specific grid color (InpGridColor) or use clrNONE to use the theme default.

  • Alpha Transparency: Adjustable grid opacity (InpGridAlpha) to prevent grid lines from obscuring chart data.

  • Price Labels: Grid lines include price labels on the right side for easy reference.


Support and Resistance Zones

Automatically detected support and resistance zones based on high-volume price clusters.

  • Automatic Detection: Zones are identified by analyzing volume concentration at price levels.

  • Support Zones: Price areas below current market with significant historical buying interest.

  • Resistance Zones: Price areas above current market with significant historical selling interest.

  • Zone Flip Detection: System tracks when price breaks through a zone, potentially flipping support to resistance or vice versa.

  • Visual Display: Zones displayed as shaded areas with color indicating support (blue) or resistance (red) nature.

  • Toggle Control: Enable or disable via InpShowSRZones parameter.


Analysis and Signal Panels

Eight Indicator Dial Panel

Eight mini gauge dials provide quick visual reference for multiple technical indicators, showing bullish, bearish, or neutral conditions.

  • Triple Moving Average (3MA): Analyzes the alignment of fast (8), medium (21), and slow (50) period moving averages. Bullish when fast > medium > slow, bearish when reversed.

  • Standard Deviation (STD): Measures volatility breakout conditions. Shows stronger signals during high volatility periods.

  • SuperTrend (ST): ATR-based trend indicator. Bullish when price is above the upper band, bearish when below the lower band.

  • Average True Range (ATR): Shows volatility expansion or contraction combined with price direction.

  • Trend (TRD): Price action analysis comparing current price to H4 highs/lows and recent candle direction.

  • Relative Strength Index (RSI): Classic momentum oscillator. Bullish in oversold territory (<30), bearish in overbought (>70).

  • MACD (MCD): Moving Average Convergence Divergence. Analyzes histogram direction and MACD line position.

  • Commodity Channel Index (CCI): Momentum indicator. Strong signals above +100 or below -100.

  • Configurable Periods: Each indicator's period is adjustable via input parameters (InpMAPeriodFast, InpMAPeriodMid, InpMAPeriodSlow, InpRSIPeriod, etc.).

  • Needle Animation: Each dial features a needle that rotates based on signal strength, from -90 degrees (strong sell) to +90 degrees (strong buy).


Signal Analysis Panel

The signal panel synthesizes multiple data sources into a clear directional bias.

  • Overall Signal Display: Shows BULLISH, BEARISH, or NEUTRAL based on combined analysis of indicators, volume, and price action.

  • Confidence Arrows: Visual arrows below the signal meter indicating confidence level and direction.

  • Multi-Factor Analysis: Signal incorporates 8 indicator dials, volume pressure, price vs VWAP, and cumulative delta.


Market Advisor Panel

Text-based market analysis providing actionable trading guidance.

  • 5-Minute Delta Analysis: Shows recent delta trend with percentage change, indicating short-term buying or selling pressure.

  • Key Level Status: Reports price position relative to POC, VWAP, and Value Area boundaries.

  • Action Advice: Suggests trading actions based on current market conditions and indicator alignment.

  • Mini Volume Profile: Small volume profile display within the advisor panel showing recent volume distribution with POC line.


Bulls vs Bears Pressure Gauge

The bottom pressure bar provides a visual representation of the ongoing battle between buyers and sellers.

  • Real-Time Calculation: Calculates bull and bear pressure from visible heatmap columns' buy and sell volumes.

  • Percentage Display: Shows exact percentage of volume attributed to bulls (left side) and bears (right side).

  • Gradient Fill: Gradient color fill from bull color to bear color, with center marker showing the dividing line.

  • Control Indicator: Center text shows 'BULLS WINNING', 'BEARS WINNING', or 'BULLS vs BEARS' based on which side exceeds 55%.

  • Smoothed Movement: Gauge moves gradually based on order size - big orders cause bigger movement, small orders cause smaller movement. This prevents constant jittering and shows true control.


Themes and Visual Customization

Panel Theme

Choose between dark and light panel backgrounds to suit your trading environment and personal preference.

  • Dark Theme (PANEL_DARK): Dark background optimized for extended screen time, reducing eye strain during long trading sessions.

  • Light Theme (PANEL_LIGHT): Bright background suitable for well-lit environments or traders who prefer lighter interfaces.

Color Themes

Eight color themes provide different visual styles for bull and bear representation.

  • Classic: Traditional green for bullish, red for bearish.

  • Blue-Orange: Blue for bullish, orange for bearish.

  • Cyan-Magenta: Cyan for bullish, magenta for bearish.

  • Lime-Pink: Lime for bullish, pink for bearish.

  • Gold-Purple: Gold for bullish, purple for bearish.

  • Teal-Coral: Teal for bullish, coral for bearish.

  • Sky-Crimson: Sky blue for bullish, crimson for bearish.

  • Mint-Rose: Mint for bullish, rose for bearish.

Font Customization

Customize text appearance throughout the interface.

  • Font Name (InpFontName): Default is 'Segoe UI'. Any system-installed font can be used.

  • Font Size (InpFontSize): Base font size in points. Default is 9.

  • Font Color (InpFontColor): Override theme text color with a custom color, or use clrNONE for theme default.

Panel Layout

Control the size and position of the main panel.

  • Panel X Position (InpPanelX): Horizontal offset from chart left edge. Default is 10 pixels.

  • Panel Y Position (InpPanelY): Vertical offset from chart top edge. Default is 10 pixels.

  • Panel Width (InpPanelWidth): Total panel width in pixels. Default is 1500.

  • Panel Height (InpPanelHeight): Total panel height in pixels. Default is 850.


Session Management

Session Time Configuration

Configure the trading session boundaries for accurate volume profile and data analysis.

  • Session Start (InpSessionStart): Time when the trading session begins in HH:MM format. Default is '00:00'.

  • Session End (InpSessionEnd): Time when the trading session ends in HH:MM format. Default is '23:59'.

  • Automatic Reset: Volume Profile, session volumes, VWAP, cumulative delta, and Time and Sales tracking automatically reset at session start.


Technical Specifications

Performance Optimization

The Expert Advisor is optimized for efficient operation even on lower-specification hardware.

  • Rendering: Uses MQL5  library for efficient drawing, minimizing chart object overhead.

  • Strategy Tester Compatible:Functionality in Strategy Tester with manual indicator calculations when indicator handles are unavailable.

  • Memory Management: Efficient array management with configurable maximum sizes for bubbles, columns, and DOM levels.


Data Sources

The EA processes multiple data streams to generate its visualizations.

  • Tick Data: Real-time tick data for precise trade detection and price updates.

  • Trade Direction Detection: Analyzes tick flags and price movement to determine whether trades are buyer or seller initiated.

  • Volume Generation: Uses power-law distribution to generate realistic trade sizes from tick data when real volume is unavailable.


Calculated Metrics

The EA calculates numerous derived metrics for comprehensive market analysis.

  • Volume Weighted Average Price (VWAP): Session VWAP calculated from cumulative price-volume and total volume.

  • Cumulative Delta: Running total of buy volume minus sell volume for the session.

  • Delta Percentage: Five-minute delta as a percentage of total five-minute volume.

  • Value Area: Calculated as the price range containing 70% of session volume, centered on POC.


System Requirements

Platform Requirements

  • MetaTrader 5: Build 2500 or later recommended for full functionality.

  • Chart Mode: Works on any chart timeframe.

  • Allow DLL Imports: Not required - EA uses only native MQL5 functions.


Recommended Display

  • Minimum Resolution: 1920 x 1080 for full panel display at default size.

  • Optimal Resolution: 2560 x 1440 or higher for best visibility with additional chart space.

  • Panel Scaling: Adjust InpPanelWidth and InpPanelHeight for different screen sizes.

Strategy Tester Demo Download

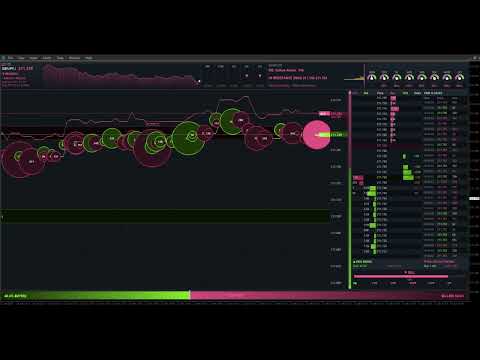
Although the expert advisor works in strategy tester, it needs live data to perform and render as intended as seen in the videos and images. Please select every tick and have relevant historical data downloaded for your instrument or it might not load correctly. Also make sure its after market opens, optimal time when the markets opening times are in view and not in the rollover period in strategy tester. 


Videos available for EA in demonstration
おすすめのプロダクト
Ultra key is a professional-grade MetaTrader 5 utilitie  that transforms your keyboard into a lightning-fast trading terminal. Designed for active traders who demand speed and precision, this utilitie  allows you to execute complex trading operations with single keystrokes while maintaining institutional-level risk management. Core Philosophy This utilitie  is built for traders who: Need  instant order execution  without clicking through menus Want  military-grade risk management  on every tr
You can see Binance Spot data instantly in Metatrader 5 and it allows you to use all the features that Metatrader has provided to you. You can access the data of all symbols listed on Binance Futures. Don't forget to set the timezone. Binance it's 00:00 UTC. You need to fix it according to your own country You need to install the free Binance Spot Symbol List plugin. https://www.mql5.com/tr/market/product/83507 After loading, it automatically downloads the data of the cryptos in the market obser
インディケータは現在のクオートを作成し、これを過去のものと比較して、これに基づいて価格変動予測を行います。インジケータには、目的の日付にすばやく移動するためのテキスト フィールドがあります。 オプション: シンボル - インジケーターが表示するシンボルの選択; SymbolPeriod - 指標がデータを取る期間の選択; IndicatorColor - インジケータの色; HorisontalShift - 指定されたバー数だけインディケータによって描画されたクオートのシフト; Inverse - true は引用符を逆にします。false - 元のビュー。 ChartVerticalShiftStep - チャートを垂直方向にシフトします (キーボードの上下矢印)。 次は日付を入力できるテキストフィールドの設定で、「Enter」を押すとすぐにジャンプできます。
Here   our more valuable tools SMC Trend Trading   ,  Easy SMC Trading  ,  Institutional SMC Architect Volume Analysis Tools  ,  Volume flow Profile  ,  Market volume profile  , FVG with Volume  , Liquidity Heatmap Profile  ,  Volume Spread Analysis 2. Key Features Dynamic Filtering : The core feature. As soon as the current price crosses a historical liquidity level, that level disappears. This reduces chart clutter and prevents you from trading off "dead" support/resistance. Liquidity Heatma
Painel Profit is an operational trading panel for MetaTrader 5 created to make manual execution and visual order management easier directly on the chart. The operating principle is simple: the trader selects the symbol, timeframe, volume, entry type, and exit strategy. Based on these commands, the panel sends or organizes the trade through the interface, displaying the entry, take profit, and stop loss levels on the chart for visual monitoring. This product is not a signal robot and does not mak
Quick operation, quick purchase, sale, empty operation. Provide three buttons: Buy, Sell, empty. Buy: Quickly place more orders after clicking, default 1 hand, profit point and stop-loss point are 110 points, after successful order can be manually modified. Sell: Quickly place an empty order after clicking, default 1 hand, profit point and stop-loss point are 110 points, can be manually modified after the order is successful. Empty: Quickly clear all orders, including purchase and s
The market is unfair if only because 10% of participants manage 90% of funds. An ordinary trader has slim changes to stand against these "vultures". This problem can be solved. You just need to be among these 10%, learn to predict their intentions and move with them. Volume is the only preemptive factor that faultlessly works on any timeframe and symbol. First, the volume appears and is accumulated, and only then the price moves. The price moves from one volume to another. Areas of volume accumu
ClusterSecondForex
Rafil Nurmukhametov
4.67 (3)
The utility allows you to build different types of graphs: Seconds chart from 1 second to 86400 seconds Tick chart from 1 tick and above The volume chart Delta chart Renko chart Range chart Product demo https://www.mql5.com/ru/channels/clustersecondforex Built-in indicators for volumetric analysis: daily market profile and market profile of the selected timeframe, Cluster Search Imbalance VWAP Dynamic POC, VAH, VAL the profile depth of the market vertical volume with various display options, del
Tick Volume Chart は、 MetaTrader 5 上でティックボリュームに基づいたチャートを作成するためのユニークなツールです。 Tick Volume Chart を使用すると、時間ではなく、指定したティック数ごとにローソク足が形成されるチャートを構築できます。これにより、標準的な時間足チャートでは得られない、市場活動の極めて正確な分析が可能になります。カスタムシンボルに対応したインジケーターやEA(自動売買プログラム)であれば、すべてご利用いただけます。作成したチャートは、標準チャートと同様に快適に操作できます。 標準ツールとは異なり、 Tick Volume Chart は時間間隔ではなく、実際の取引強度に基づいて市場を分析することを可能にします。 Tick Volume Chart の利点 各バーに 固定ティックボリューム を設定したチャートを作成可能。 内蔵ティックデータベースにより、履歴データの 高速な読み込み を実現。 リアルタイムデータが、 通常のチャートと同期し、遅延なく 更新されます。 複数の ティックボリュームチャートを同時に作成 することが可能
ClusterSecond
Rafil Nurmukhametov
4.78 (32)
The utility allows you to build different types of graphs: Seconds chart from 1 second to 86400 seconds Tick chart from 1 tick and above The volume chart Delta chart Renko chart Range chart Demo version of the utility https://www.mql5.com/ru/channels/clustersecond Built-in indicators for volumetric analysis: daily market profile and market profile of the selected timeframe, Cluster Search Imbalance VWAP Dynamic POC, VAH, VAL the profile depth of the market vertical volume with various display op
Trading Assistent is a multifunctional trading panel that combines all necessary tools for professional trading. The panel provides complete control over positions, in-depth risk analysis, and fast order execution. MAIN FUNCTIONAL BLOCKS Position Management: - Real-time viewing of all open positions - Sorting by symbol, profit, volume, and type - Visual indication of profitable and losing positions - Bulk closing operations - Breakeven function for profit protection Trading Operations: - I
LuoMo Volume & Price Structure 8.98 A multi-function chart indicator for   MetaTrader 4 and MetaTrader 5 , designed to display key volume, volatility, sentiment, and price-structure information directly on the main chart. Main Features Volume and price-based Support & Resistance Volume spike and exhaustion signals ATR volatility expansion alerts Volume Profile with HVN and LVN Bullish and bearish sentiment distribution Developing or fixed POC VAH and VAL levels Supply and Demand zones Volume-wei
Capital Management EA – Smart Risk Management & Profit Optimization for MT5 Take control of your trading capital with smart, automated strategies — fully optimized for MetaTrader 5 (MT5). Looking to protect your capital and maximize profits through automated money management strategies ? Capital Management EA is the all-in-one Expert Advisor for MetaTrader 5 (MT5) that helps you trade smarter, not harder. Core Features: 5-in-1 Capital Management Strategies – Built-in versatility Gr
トレーディングコンソールで、あなたのトレードを快適に! このアプリケーションはストラテジーテスターではテストできません。 以下からデモバージョン(デモアカウント用)を取得し、テストしてください。 Download DEMO ver. 1. トレード時に役立つ機能: (1) 経済指標の表示・通知: 経済指標発表の数分前に、アラート・プッシュ通知・メールなどでお知らせします。 アラートの際は、画面の一部が点滅し、気づきやすくなっています。 経済指標を、通貨やキーワードで絞り込み、必要なものだけ通知するようにできます。 経済指標の重要度で色を分けて表示します。 (2) ビジュアライズされたTP/SL注文: 注文の際、損益の見積もりをPoints、Pips、金額で表示します。 注文の際、マウス操作で、「RR値を固定」「個々に変更」の2つの方法でTP値、SL値を指定できます。 注文の際、TPのみ、SLのみの注文も行えます。 注文は、成り行き注文(Autoモード)、値を指定したStop注文、Limit注文(Manualモード)に対応しています。 複数のポジションを持っているとき、TP,SLを一括
SFP Hunter — Swing Failure Pattern SFP Hunter is a MetaTrader 5 indicator that automatically detects Swing Failure Patterns (SFP) on any symbol and timeframe. The indicator identifies single-candle stop-hunt reversals where price wicks beyond a prior swing high or low and closes back inside on the same candle, signalling a potential reversal from that level. How the Pattern Works A Swing Failure Pattern occurs when price briefly breaches a prior swing high or swing low — triggering the stop orde
RenkoFromRealTicks
Stanislav Korotky
4.67 (3)
This non-trading expert utilizes so called custom symbols feature ( available in MQL API as well) to build renko charts based on history of real ticks of selected standard symbol. RenkoFromRealTicks generates custom symbol quotes, thus you may open many charts to apply different EAs and indicators to the renko. It also transmits real ticks to update renko charts in real time. The generated renko chart uses M1 timeframe. It makes no sense to switch the renko chart to a timeframe other than M1. T
GDS Renko Pip ST Chart - Pip-Based Renko Chart Indicator for MetaTrader 5 GDS Renko Pip ST Chart is a pip-based Renko chart indicator for MetaTrader 5. It helps traders build and study cleaner Renko price movement using a practical fixed pip or point-based brick structure. This tool is designed as a Renko chart foundation for manual analysis. It does not predict the market, does not generate buy or sell signals and does not decide whether a trade should be opened. Renko EDGE EA Golden Delta | A
PNL MANAGER PRO —    Automatic Exit Manager with Smart Risk Control Set your entry, walk away. PNL Manager Pro sets your stop loss and take-profits automatically, locks in profit in stages, moves you to breakeven, and trails the rest — all while keeping your risk inside the limit you set. Try Before You Buy: You can download and test the Pnl MANAGER  free demo version  on a demo acc
T Trade Panel Pro 2 - 究極のリスク管理&高速注文ツール LT Trade Panel Pro   は、MetaTrader 5 において精度、スピード、そして完璧なリスク管理を求めるトレーダーのための究極のツールです。 スキャルピング   や   デイトレーダー   向けに設計されており、複雑な注文実行をワンクリックで直感的に行えるようにします。 最新の   バージョン 2   では、システムを全面的に刷新し、遅延を最小限に抑え、独自の資金保護機能を追加して最高のパフォーマンスを実現しました。 なぜ LT Trade Panel Pro を選ぶのか? 多くのトレーダーが失敗する原因は、リスク管理の規律不足にあります。 LT Trade Panel Pro   は、最も重要なプロセスである「リスクを一定に保ち、適切なタイミングでポジションを保護する」ことを自動化します。 プロップファーム (Prop Firms)   やプロフェッショナルな口座で取引する方にとって、欠かせないツールです。 主な機能: 自動ロット計算:   手動でロットを計算する必要
Was: $249  Now: $99   Market Profile defines a number of day types that can help the trader to determine market behaviour. A key feature is the Value Area, representing the range of price action where 70% of trading took place. Understanding the Value Area can give traders valuable insight into market direction and establish the higher odds trade. It is an excellent addition to any system you may be using. Inspired by Jim Dalton’s book “Mind Over Markets”, this indicator is designed to suit the
This indicator allows you to enjoy the two most popular products for analyzing request volumes and market deals at a favorable price: Actual Depth of Market Chart Actual Tick Footprint Volume Chart This product combines the power of both indicators and is provided as a single file. The functionality of Actual COMBO Depth of Market AND Tick Volume Chart is fully identical to the original indicators. You will enjoy the power of these two products combined into the single super-indicator! Below is
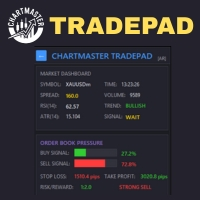
Take control of your trading with ChartMaster TradePad – a powerful all-in-one trading panel designed to simplify order execution, risk management, and market analysis. Whether you’re a scalper, day trader, or swing trader, ChartMaster TradePad gives you the speed, clarity, and precision you need to maximize your trading performance. Key Features Market Dashboard Real-time Market Data : Symbol, spread, RSI(14), ATR(14), trend direction, volume, and trading signals at a glance. Clear Trend & S
Order Book, known also as Market Book, market depth, Level 2, - is a dynamically updated table with current volumes of orders to buy and to sell specific financial instument at price levels near Bid and Ask. MetaTrader 5 provides the means for receiving market book from your broker, but in real time only, without access to its history. The indicator OrderBook Cumulative Indicator accumulates market book data online and visualizes them on the chart. In addition, the indicator can show the market
Layer Master: Professional Grid Trading Tool for MT5 Transform your grid trading with Layer Master - the most intuitive and powerful order management toolkit designed specifically for professional traders. MT4   Version:  https://www.mql5.com/en/market/product/79133 FREE - 7 Day Trial Version available. Please   contact  me to get your Free trial! Master Grid Trading with Precision Layer Master revolutionizes how you place and manage grid trades. With our visual interface, you can: Deploy hun
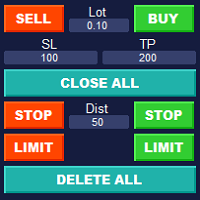
Simple Customizable Trade Panel — Fast and Easy One-Click Trading This lightweight and powerful panel is built for traders who value   speed ,   simplicity , and   full customization . With just one click, you can: Buy or Sell instantly Close all open positions Place pending orders with custom distance Delete all pending orders Adjustable parameters: • Lot size • Stop Loss (in points) • Take Profit (in points) • Distance to price for pending orders The panel is fully responsive and ad
Boleta de negociação, adiciona automáticamente as ordens Take Profit e Stop Loss quando excutada uma ordem de compra ou venda. Ao apertar as teclas de atalho (A, D, ou TAB), serão inseridas duas linhas de pre-visualização, representando as futuras ordens de take profit (azul) e stop loss (vermelho), as quais irão manter o distanciamento especificado pelo usuário. Ditas ordens só serão adicionadas ao ser executada a ordem inicial. Ao operar a mercado, as ordens pendentes de take profit, e stop lo
TradePad
Ruslan Khasanov
5 (1)
TradePad は、手動取引とアルゴリズム取引の両方に使用できるツールです。複数の取引商品での迅速な取引操作とポジション管理のためのシンプルなソリューションを提供します。 注意: アプリケーションは戦略テスターでは動作しません。 デモアカウント用のアプリケーションの試用版とすべてのツールの説明 アプリケーション インターフェイスは高解像度のモニターに適応しており、シンプルで直感的です。快適な作業のために、トレーダーには次のツール セットが提供されます: 取引操作の管理、メイン チャートの期間の切り替え、TradePad 商品の切り替えを行うホット キー マネージャー。 ポジションを開くときや保留中の注文を設定するときに、ドローダウンのリスクを評価し、潜在的な利益を計算するために取引レベルをマークするツール。 複数の取引シンボルを視覚的に監視し、アルゴリズム取引の取引シグナルを受信するための MultiCharts ツール。利便性のために、取引ペアのセットを整理できます。これにより、複数の時間枠で価格を監視し、複数の通貨取引を行うことができます。 履歴の任意の期間の取引統計を表示するた
**MT5 → Telegram & Discord Auto Post Bot** Want to automate your trading and stop wasting time on manual posting? This bot is for you. **What does it do?** It connects directly to MetaTrader 5 and automatically posts to Telegram & Discord: ️ Open trades ️ Closed trades ️ SL / TP levels ️ Profit and loss ️ Real-time signals **Advantages:** • Fully automated process • No delay – posts in real time • Perfect for signal groups and channels • Increases trust and transparency • Works
VOLUME PROFILE SAF-XII MT5専用プロフェッショナル・マーケットプロファイル分析ツール(グリッドトレードに最適な「ドリーム・インジケーター」) ボリュームプロファイル(価格帯別出来高)とは? ボリュームプロファイルは、従来の「時間軸」の出来高とは異なり、「特定の価格帯」での取引活動を表示するプロ仕様のツールです。選択した期間内の「どこで」取引が行われたかを可視化し、以下のポイントを特定します: バリューエリア (VAH/VAL) :全取引の大部分が行われた価格帯。 ポイント・オブ・コントロール (POC) :最も出来高が集中した単一の価格水準。 リクイディティ・イムバランス :各価格帯における強気(買い)と弱気(売り)の優劣。 サポレジ(支持・抵抗) :実際の取引活動に基づいた自然な価格水準。 3つの動作モード — 「設定したらあとはお任せ」 VP_MANUAL(スイングトレード・重要ライン分析) 垂直ラインをドラッグして分析範囲を手動で設定。 ラインを動かした時のみ再計算されるため軽量。 用途 :指標発表前分析、決算発表、特定の期間分析。 VP_AUTO(スキ
NRP Risk Manager Pro Institutional-Grade Trade Management & Prop Firm Protection Get the MetaTrader 4 Version Here: https://www.mql5.com/en/market/product/179888 Get the MetaTrader 5 Version Here: https://www.mql5.com/en/market/product/179885 Trading isn't just about finding the right entry; it is about flawlessly executing your edge while fiercely protecting your capital. NRP Risk Manager Pro is not an automated trading robot—it is a comprehensive, institutional-grade trade terminal d
このプロダクトを購入した人は以下も購入しています
Trade Assistant MT5
Evgeniy Kravchenko
4.43 (216)
取引 ごとのリスクの 計算、新規注文 の 簡単 な 設置、部分的 な 決済機能 を 持 つ 注文管理、 7 種類 のトレーリングストップなど 、便利 な 機能 を 備 えています 。 追加の資料と説明書 インストール手順   -   アプリケーションの手順   -   デモアカウント用アプリケーションの試用版 ライン機能 チャート上にオープニングライン、ストップロス、テイクプロフィットを表示します。この機能により、新規注文を簡単に設定することができ、注文を出す前にその特徴を確認することができます。   リスク計算 リスク計算機能は、設定されたリスクとストップロス注文のサイズを考慮して、新規注文のボリュームを計算します。ストップロスの大きさを自由に設定できると同時に、設定したリスクを守ることができます。 Lot calc ボタン - リスク 計算 を 有効 / 無効 にします 。 Risk フィールドでは 、必要 なリスクの 値 を 0 から 100 までのパーセンテージまたは 預金通貨 で 設定 します 。 設定」 タブで 、 リスク 計算 の 種類 を 選択 します :「 $ 通
Trade Manager EAへようこそ。これは、取引をより直感的、正確、そして効率的にするために設計された究極の リスク管理ツール です。これは単なるオーダー実行ツールではなく、包括的な取引計画、ポジション管理、リスク管理のためのソリューションです。初心者から上級者、迅速な実行を必要とするスキャルパーまで、Trade Manager EAはあらゆるニーズに対応し、為替、指数、商品、暗号通貨などさまざまな市場で柔軟に対応します。 Trade Manager EAを使用すると、複雑な計算が過去のものになります。市場を分析し、エントリーポイント、ストップロス、テイクプロフィットのレベルをチャート上のラインでマークし、リスクを設定するだけで、Trade Managerが最適なポジションサイズを即座に計算し、SLとTPをピップ、ポイント、口座通貨でリアルタイムに表示します。すべての取引が簡単かつ効果的に管理されます。 主な機能: ポジションサイズ計算機 :定義されたリスクに基づいて取引サイズを瞬時に決定します。 簡単な取引計画 :エントリー、ストップロス、テイクプロフィットを設定するためのド
================================================================================ POC BREAKOUT - V20.72. Full Professional Grade Toolkit ================================================================================ POC Breakout is a full MetaTrader 5 trading dashboard for discretionary traders who want breakout signals, Point of Control (POC) context, volume profiles, order flow, market structure, news, alerts, and advanced trade planning in one professional workspace. Attached directly to you
TradePanel MT5
Alfiya Fazylova
4.88 (168)
Trade Panelは多機能なトレーディングアシスタントです。アプリには手動取引用の50以上のトレーディング機能が搭載されており、ほとんどの取引作業を自動化することができます。 アプリの説明書+ビデオガイド: https://www.mql5.com/en/blogs/post/772292 デモ口座用アプリの試用版: https://www.mql5.com/en/blogs/post/750865 アプリのインストール方法: https://www.mql5.com/en/blogs/post/756239 アプリをビジュアルモードでテストする方法: https://www.mql5.com/en/blogs/post/770277 VPSのMetaTraderにアプリをインストールする方法: https://www.mql5.com/en/blogs/post/770190 取引。 ワンクリックで取引操作を行うことができます: リスクを自動計算して指値注文やポジションを開く。 複数の注文やポジションをワンクリックで開く。 注文のグリッドを開く。 保留中の注文やポジションをグルー
自分の取引ルールで Telegram のシグナルをコピー Telegram to MT5 Signal Trader は、Telegram の公開・非公開チャンネルやグループから、テキスト形式の取引シグナルを MetaTrader 5 へ自動でコピーします。1つのデスクトップアプリで複数の配信者と MT5 口座を管理し、 配信者ごとにリスクと取引設定を個別に指定 できます。 シグナルのコピーに Telegram ボットや API 設定は必要ありません。 電話番号または QR コードでご自身の Telegram アカウントにログインし、すでに参加しているチャンネルやグループを選ぶだけです。ボットの作成や、Telegram API トークン、API ID、API hash の入力は不要です。 ポジションサイズを選び、複数の利確水準に分けて決済し、建値へのストップ移動やトレーリングストップを自動化できます。配信者のシグナルを受け取りながら、実際の取引方法は自分で管理できます。 本製品は、この MT5 エキスパートアドバイザ(EA)と、必須の Windows 連携アプリで構成されます。 インス
Farmed Hedge Yield Farming | All Markets (Manual - Hybrid - Semi/Automated EA) VERIFIED TRADING RESULTS - Farmed Hedge Yield Axi Copy:  https://www.mql5.com/en/signals/2356376 - Farmed Hedge Yield Exn Copy:   https://www.mql5.com/en/signals/2356404 - Farmed Hedge Yield V Copy:  https://www.mql5.com/en/signals/2357156 IMPORTANT NOTICE: FarmedHedge is a MANUAL-FOCUSED TRADING UTILITY ,not a fully automated EA. Results shown on this Signal include manual trades and overall strategic management.
Premium Trade Manager - コーチ内蔵型トレードパネル Premium Trade Manager は、AIトレーディングコーチをあなたのチャートの中に置き、その下に完全な執行エンジンを備えたツールです。いつも通りにトレードをセットアップし、あなた専任のAIトレーディングコーチ Max にそのセットアップをそのまま読み取らせて、発注前に率直な見解を伝えてもらいましょう。ストップの幅が規律あるアプローチに合っているか、リスクサイズは適切か、高影響のニュースイベントが数分後に迫っていないか、プロップファームの制限に近づいていないか。その下には、クリックの後をすべて処理するエンジンが備わっています。ワンクリックのリスクサイズ計算による発注、チャート上でドラッグして組み立て、発注後も動かせるプラン、最大4段階の分割利確、7種類のトレール方式、リアルタイムのプロップファームコンプライアンス、ニュースガード、そしてコストを自ら採点するスプレッド機能。判断はあなたが下す。Max がもう一度確認する。後のことはすべてパネルが担う。 購入前に実際に触れて試せます。 ブラウザ上でライブ
EA Overfitter
Stephen J Martret
5 (1)
That backtest looks great. But will it still be making money tomorrow, next week, next month? EA Overfitter re-runs your EA on 100 price histories it has never seen. One score tells you if the edge is real. A backtest tells you what an EA did on one price history — the one that happened to occur. What you cannot tell from it is how much of that result was the strategy and how much was the particular path. EA Overfitter answers that. It builds up to 100 synthetic price histories your EA has n
FUTURES ORDERFLOW FOOTPRINT CHART Professional OrderFlow EA for MetaTrader 5 Version 1.01| Professional tool for real traders | Institutional-Grade Visualization STRATEGY TESTER USERS - PLEASE SELECT EVERY REAL TICK WHEN TESTING AND YOU HAVE DOWNLOADED HISTORICAL DATA. IF YOU SEE A WAITING SCREEN AND IT IS NOT DOWNLOADING, IT MEANS YOU HAVE LOW HISTORICAL DATA. TRY 1 MIN AND 5 MIN FIRST ON 1 DAY DATA. ONE DAY DATA SHOULD BE THE NEWEST AND MOST CURRENT DATE. PLEASE WAIT UNTIL THE MARKET HAS ROL
The product will copy all telegram signal to MT5 ( which you are member) , also it can work as remote copier.  Easy to set up, copy order instant, can work with almost signal formats, image signal,  s upport to translate other language to English Work with all type of channel or group, even channel have "Restrict Saving Content", work with  multi channel, multi MT5 Work as remote copier: with signal have ticket number, it will copy exactly via ticket number. Support to backtest signal. How to s
Timeless Charts
Samuel Manoel De Souza
5 (8)
Timeless Charts is an all-in-one trading utility for professional traders. It combines custom chart types such as Seconds Charts and Renko with advanced order flow analysis using Footprints , Clusters , Volume Profiles , VWAP studies, and anchored analysis tools for deeper market insight. Trading and position management are handled directly from the chart through an integrated trade management panel , while Market Replay and Virtual Accounts provide environments for practicing trading skills and
Footprint Chart Pro — Professional OrderFlow EA for MetaTrader 5 Version 6.34 | Professional tool for real traders | Institutional-Grade Visualization DEMO USERS - PLEASE SELECT EVERY TICK / REAL TICK WHEN TESTING AND YOU HAVE DOWNLOADED HISTORICAL DATA. IF YOU SEE A WAITING SCREEN AND IT IS NOT DOWNLOADING, IT MEANS YOU HAVE LOW HISTORICAL DATA. TRY 1 MIN AND 5 MIN FIRST ON 1 DAY DATA. ONE DAY DATA SHOULD BE THE NEWEST AND MOST CURRENT DATE. PLEASE WAIT UNTIL THE MARKET HAS ROLLED OVER PERIOD.
Grid Manual MT5
Alfiya Fazylova
4.73 (22)
「Grid Manual」は、注文のグリッドを操作するための取引パネルです。 ユーティリティはユニバーサルで、柔軟な設定と直感的なインターフェイスを備えています。 それは、損失を平均化する方向だけでなく、利益を増やす方向でも注文のグリッドで機能します。 トレーダーは注文のグリッドを作成して維持する必要はありません。 すべてが「Grid Manual」によって行われます。 注文を開くだけで十分であり、「Grid Manual」は注文のグリッドを自動的に作成し、非常に閉じるまでそれに付随します。 完全な説明とデモバージョン ここ。 ユーティリティの主な機能と機能 ユーティリティは、モバイル端末から開かれた注文を含め、あらゆる方法で開かれた注文を処理します。 「制限」と「停止」の2種類のグリッドで機能します。 グリッド間隔の計算には、固定と動的(ATRインジケーターに基づく)の2つの方法で機能します。 オープンオーダーグリッドの設定を変更できます。 チャート上の各注文グリッドの損益分岐点を表示します。 各注文グリッドの利益率を表示します。 ワンクリックでグリッドから収益性の高い注文を閉じるこ
Trade Indicator Assistant   is a powerful MT5 utility designed to turn indicators into automated trading systems. Its main feature is the ability to automatically detect an indicator’s   BUY and SELL signal buffers , without requiring you to know the buffer numbers, search through indicator settings, or modify the indicator source code. Bonus Indicator:   After purchasing Trade Indicator Assistant, contact me to receive   Trade Signal Pro   completely free as a bonus indicator. [Download Demo V
Power Candles Strategy Scanner - 自動最適化型マルチシンボル設定ファインダー パワーキャンドル・ストラテジー・スキャナーは 、パワーキャンドル・インジケーターを駆動するのと全く同じ自己最適化エンジンを、マーケットウォッチに登録されているすべての銘柄に対して並行して実行します。1つのパネルで、現在統計的に取引可能な銘柄、各銘柄で勝率の高い戦略、最適なストップロス/テイクプロフィットの組み合わせが表示され、新たなシグナルが発生した瞬間に通知が届きます。 このツールは、Stein Investmentsのエコシステムの一部です。  18種類以上のツールをすべて閲覧し、AIを活用したセットアップの推奨を受け取り、  https://stein.investments でコミュニティに参加しましょう 市場動向を網羅。銘柄ごとに3,000件以上の自動最適化。2種類のアラート。ワンクリックでチャートを切り替えて即座にアクション。 なぜこれが必要なのか 多くのマルチ銘柄スキャナーは、 価格の動き (ボラティリティ、変動率、銘柄ごとのRSI)を表示するだけです。それ
This Expert Advisor waits a position to be opened, no matter if you open manually or with the EA buttons or eventually via mobile: it creates a Grid in Anti Martingale with pending stop orders in the same direction of the first position. You can specify the number of orders, the size and the distance between the orders. You can also adjust the Monetary Target of the Grid, the monetary Stop Loss, the Intermediate Target (when reached the EA insert an order with opposite direction of the total pos
YuClusters
Yury Kulikov
4.93 (43)
Attention: You can view the program operation in the free version  YuClusters DEMO .  YuClusters is a professional market analysis system. The trader has unique opportunities to analyze the flow of orders, trade volumes, price movements using various charts, profiles, indicators, and graphical objects. YuClusters operates on data based on Time&Sales or ticks information, depending on what is available in the quotes of a financial instrument. YuClusters allows you to build graphs by combining da

Copy your MT5 trades to Interactive Brokers You keep using MT5. Every order you open or close is sent to your IB account. In real time. No coding. No changes to your strategy or EA. Try it first Rent 1 month: $30. Test on a live or paper account. What it does Real-time copying: same direction, reverse, or one side only. Map any MT5 symbol to any IB symbol. Set a lot ratio for each. Forex, Futures, Stocks, CFDs, Metals and Crypto. Position sync: both accounts checked, any difference fixed. Optio
EchoTrade Telegram to MT5 Copier Seamless, Instant, and Reliable Signal Copying - Direct from Telegram to MetaTrader 5! The product does not run in the strategy tester but you can get free trial version here  for testing before purchase. Tired of manually executing trades from Telegram signals? EchoTrade automates the process, instantly copying trades from any Telegram channel or group directly into your MT5 account—accurately, efficiently, and without delay. Key Features: Universal Compatibi
Ultimate Extractor - Professional Trading Analytics for MT5 *****this is the local HTML version of Ultimate Extractor. !!!!!it is not compatible with Cloud!!!! For the online version please reach out to me directly****** Ultimate EA manager also now available when you use cloud pro and above for free!! Ultimate Extractor transforms your MetaTrader 5 trading history into actionable insights with comprehensive analytics, interactive charts, and real-time performance tracking. What It Does Automa
AI Agent Supervisor is NOT an Expert Advisor. AI Agent Supervisor   is a   multi-agent AI risk & portfolio supervisor   that watches every EA on your account and intervenes in real time.  WANT AN AI PORTFOLIO MANAGER WATCHING YOUR FLEET 24/7?   Run your fleet on the same brokers I do:   IC MARKETS , IC TRADING   .  Unlike the centralized stock market, Forex has no single, unified price feed.  Every broker sources liquidity from different providers, creating unique data streams. The Supervisor r
Quant AI Agents are independent trading Expert Advisors. Instead of trading using a fixed strategy like other conventional EAs, Quant AI Agents   is a   multi-agent AI trading framework   that turns natural-language strategy prompts into live.  WANT THE SAME RESULTS AS MY LIVE SIGNAL?   Use the exact same brokers I do:   IC MARKETS , IC TRADING   .  Unlike the centralized stock market, Forex has no single, unified price feed.  Every broker sources liquidity from different providers, creating un
EA Auditor
Stephen J Martret
5 (5)
EA Auditor is an independent analysis tool for traders evaluating Expert Advisors and trading signals on MetaTrader 5. It audits backtest reports, reviews posted developer signals, and cross-verifies the two against each other to help traders assess strategies before committing capital. The MQL5 market offers a wide range of Expert Advisors from many developers, with varying approaches, quality, and transparency. EA Auditor provides a consistent, data-driven framework for reviewing them, answer
Global Investing FX Terminal
Santiago Nicolas Pla Casuriaga
5 (1)
Global Investing FX Terminal は、MetaTrader 5 向けのオールインワン FX ダッシュボードです——中央銀行政策金利、CFTC COT ポジション、キャリーランキング、経済サプライズ、オプションスキュー、リテールセンチメント、相関まで、合計 13 のアナリティクスパネルを、ちらつきのない単一キャンバス上に表示し、単一の EA から 10 秒ごとに更新します。外部ソフトウェア不要です。 プロの FX 分析には、通常は別々のプラットフォームに分散しているデータへの同時アクセスが欠かせません。レートデリバティブ、政府統計ポータル、ブローカーのスワップ仕様、オプションデスク——このEAはそれらすべてを、実際に売買判断を下すトレーディングターミナルの単一画面に集約します。 ダッシュボードの表示内容 マーケットオーバービュー FX ペアテーブル — G10 全 28 ペアに加え、ブローカーの Market Watch に NOK/SEK クロスが存在する場合はそれも含めた最大 36 ペアのリアルタイム Bid/Ask。各行にはスプレッド、日次・週次変化、pip
あなたがメンバーである任意のチャネルから(プライベートおよび制限されたものを含む)シグナルを直接あなたのMT5にコピーします。  このツールは、トレードを管理し監視するために必要な多くの機能を提供しながら、ユーザーを考慮して設計されています。 この製品は使いやすく、視覚的に魅力的なグラフィカルインターフェースで提供されています。設定をカスタマイズして、数分で製品を使用を開始できます! ユーザーガイド + デモ  | MT4版 | Discord版 デモを試してみたい場合は、ユーザーガイドにアクセスしてください。 Telegram To MT5 受信機は、ストラテジーテスターで動作しません! Telegram To MT5の特徴 複数のチャネルから一度にシグナルをコピー プライベートおよび制限されたチャネルからシグナルをコピー BotトークンまたはChat IDは必要ありません   (必要に応じて使用することができます) リスク%または固定ロットを使用して取引 特定のシンボルを除外 すべてのシグナルをコピーするか、コピーするシグナルをカスタマイズするかを選択 すべてのシグナルを認
Prop Firm Os
Gayathiri Gopalakrishnan
5 (1)
PROP FIRM OS Structured Trading Assistant for MetaTrader 5 PROP FIRM OS is a structured trading assistant designed for MetaTrader 5 users who prefer rule-based market analysis and organized trading workflows. The Expert Advisor combines market analysis tools, scanner functions, dashboard monitoring, alerts, risk-control settings, and trade management features inside one system. PROP FIRM OS is designed to help traders follow selected rules, filters, and monitoring conditions during trading activ
Trading Chaos Expert
Gennadiy Stanilevych
5 (11)
This software has no equals in the world and represents a universal trade "console" covering trading signals, automated market entry, setting of Stop Loss and Take Profit, as well as Trailing Profit for multiple trades at the same time in a single open window. Intuitive control of the Expert Advisor in "three clicks" ensures a comprehensive use of all its functions on different computers, including tablets PCs. Interacting with additional signal indicators that mark the chart to give a real mark
Mobile Trade Manager - Professional Trading Management from Your Phone INTRODUCTION Mobile Trade Manager is a professional trading management EA specifically designed to give you complete control over your trades using only your phone, from anywhere. Key Features: THE ONLY EA on the market that can manage trades from anywhere - Features fully optimized for mobile, no computer needed Visual Entry Panel - Drag-and-drop to p
AlgoRadar
Stephen J Martret
5 (4)
AlgoRadar is an on-chart analytics dashboard for MT5 that aggregates Expert Advisor performance across multiple accounts, brokers, and platforms, including both MT4 and MT5 data, into a single live view on your MT5 chart. All analysis runs from the chart interface, with no external applications or manual report processing required. EA Analysis and Ranking For traders running multiple Expert Advisors, AlgoRadar provides a consolidated view of each EA's performance across accounts. Active EAs a
作者のその他のプロダクト
================================================================================ POC BREAKOUT - V20.72. Full Professional Grade Toolkit ================================================================================ POC Breakout is a full MetaTrader 5 trading dashboard for discretionary traders who want breakout signals, Point of Control (POC) context, volume profiles, order flow, market structure, news, alerts, and advanced trade planning in one professional workspace. Attached directly to you
FUTURES ORDERFLOW FOOTPRINT CHART Professional OrderFlow EA for MetaTrader 5 Version 1.01| Professional tool for real traders | Institutional-Grade Visualization STRATEGY TESTER USERS - PLEASE SELECT EVERY REAL TICK WHEN TESTING AND YOU HAVE DOWNLOADED HISTORICAL DATA. IF YOU SEE A WAITING SCREEN AND IT IS NOT DOWNLOADING, IT MEANS YOU HAVE LOW HISTORICAL DATA. TRY 1 MIN AND 5 MIN FIRST ON 1 DAY DATA. ONE DAY DATA SHOULD BE THE NEWEST AND MOST CURRENT DATE. PLEASE WAIT UNTIL THE MARKET HAS ROL
Footprint Chart Pro — Professional OrderFlow EA for MetaTrader 5 Version 6.34 | Professional tool for real traders | Institutional-Grade Visualization DEMO USERS - PLEASE SELECT EVERY TICK / REAL TICK WHEN TESTING AND YOU HAVE DOWNLOADED HISTORICAL DATA. IF YOU SEE A WAITING SCREEN AND IT IS NOT DOWNLOADING, IT MEANS YOU HAVE LOW HISTORICAL DATA. TRY 1 MIN AND 5 MIN FIRST ON 1 DAY DATA. ONE DAY DATA SHOULD BE THE NEWEST AND MOST CURRENT DATE. PLEASE WAIT UNTIL THE MARKET HAS ROLLED OVER PERIOD.

DELTA ATLAS Orderbook Order-Flow Visualization Dashboard for MetaTrader 5 Futures A unified, full-screen dashboard for discretionary futures traders that turns the raw order flow into one clear picture. Every executed trade is rendered as volume bubble scrolling across a live liquidity heatmap, read against a real depth-of- market ladder, a live footprint, the session volume profile and cumulative delta — the whole auction, drawn in real time. On top of the tape sits a graded Analyst and a fam
フィルタ:
レビューなし
レビューに返信