Volume Bubbles Order Flow Footprint
- Utilità
-
Abdul Jalil
 I am a multidisciplinary creator and market technician, combining the visual clarity of a graphics designer with the analytical depth of a trader and trading‑tools developer. My work lives at the intersection of design, technology, and financial markets.
 - Versione: 20.90
- Aggiornato: 6 febbraio 2026
- Attivazioni: 5
VOLUME BUBBLES ORDERFLOW FOOTPRINT PROFESSIONAL
Expert Advisor for MetaTrader 5
Complete Feature Documentation
Introduction:
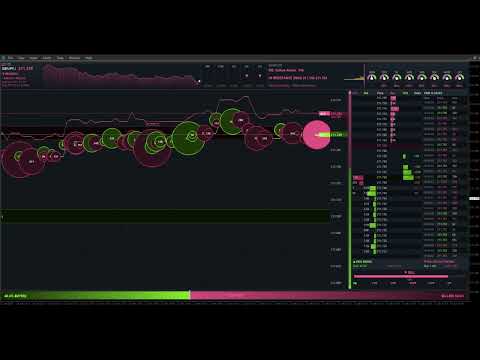
Volume Bubbles OrderFlow Footprint Professional is an advanced order flow visualization tool designed for the MetaTrader 5 platform. It provides institutional-grade market analysis through real-time volume bubbles visualization, volume profiling, and sophisticated order flow analysis. This Expert Advisor transforms raw market data into actionable trading intelligence, helping traders identify high-probability trading opportunities by revealing the underlying market microstructure.
Main Interface Components:
Header Information Panel
The header panel displays critical market information at a glance, providing traders with essential data without cluttering the main chart area.
-
Symbol and Timeframe Display: Shows the current trading instrument and chart timeframe prominently in the top-left corner for quick reference.
-
Real-Time Price Information: Displays current Bid and Ask prices with color-coded directional indicators showing price movement.
-
Spread Monitor: Shows the current bid-ask spread in both points and pips, essential for scalping and high-frequency trading strategies.
-
Session Price Chart: A mini area chart displaying session price movement with gradient fill, providing visual context of the day's price action. Customizable bull and bear colors available.
-
Multi-Timeframe Trend Boxes: Color-coded boxes showing trend direction across M15, H1, H4, D1, and W1 timeframes, enabling traders to align with higher timeframe trends.
Volume Bubbles OrderFlow
The central volume bubbles is the core visualization tool, displaying order flow data in a bubble style format that reveals market liquidity and trading activity.
-
Real-Time Volume Visualization: Each cell represents volume traded at a specific price level during a time column, with color intensity indicating volume magnitude.
-
Configurable Columns: Supports up to 80 columns of historical data, configurable via InpHeatmapColumns parameter.
-
Price Level Resolution: Adjustable price levels (InpPriceLevels) and ticks per level (InpTicksPerLevel) for precise market depth visualization.
-
Column Update Frequency: Customizable update interval (InpColumnUpdateMs) allowing balance between detail and performance.
-
Auto-Scroll Feature: Automatically keeps current price centered in the visible area when enabled (InpAutoScroll), with configurable margin (InpScrollMargin).
-
Cell Background Coloring: Optional background coloring based on cumulative volume at each price level, showing areas of high trading activity.
-
Cell Flash Animation: Visual flash effect when trades occur at specific price levels, with configurable duration (InpCellFlashDuration) and intensity (InpCellFlashCount).
Volume Bubbles
Volume bubbles provide an intuitive visual representation of individual trades, with size proportional to trade volume.
-
Dynamic Sizing: Bubble size scales between minimum (InpBubbleMinSize) and maximum (InpBubbleMaxSize) based on trade volume relative to recent activity.
-
Volume Threshold: Only trades exceeding the minimum volume threshold (InpMinBubbleVolume) generate bubbles, filtering out noise.
-
Color Coding: Buy trades display in the theme's bull color; sell trades display in the bear color for instant directional recognition.
-
Transparency Control: Adjustable alpha transparency (InpBubbleAlpha) allows bubbles to overlay without obscuring underlying data.
-
Outline Enhancement: Configurable outline width (InpBubbleOutlineWidth) improves bubble visibility against varying backgrounds.
-
Flash Animation: New bubbles flash briefly when created (InpBubbleFlash), drawing attention to fresh market activity. Duration controlled by InpBubbleFlashDuration.
-
Smooth Scrolling: Bubbles scroll smoothly with sub-pixel positioning as new columns are added, maintaining visual continuity.
Big Order Detection and Alerts
Large institutional orders are highlighted with special visual treatments to help traders identify significant market participants.
-
Threshold Configuration: Define what constitutes a big order via InpBigOrderThreshold parameter, typically set based on the instrument's average trade size.
-
Visual Text Labels: Large orders display volume text directly on the chart when InpShowBigOrderText is enabled.
-
Flash Size Threshold: Separate threshold (InpBigOrderFlashSize) for triggering flash animations on medium-to-large orders.
-
Custom Font Settings: Big order labels use dedicated font (InpBigOrderFont) and size (InpBigOrderFontSize) for optimal visibility.
-
Large Buy/Sell Detection: System tracks when large buy or sell orders occur, displaying alerts in the DOM Info panel.
Depth of Market (DOM) Panel
The DOM panel provides a traditional order book view, showing pending orders and recent trading activity at each price level.
-
Price Ladder Display: Vertical price ladder showing configurable number of levels (InpDOMLevels) above and below current price.
-
Bid/Ask Volume Bars: Horizontal bars showing cumulative volume at each price level, with separate colors for bid and ask sides.
-
Volume Profile Integration: Mini volume profile bars overlaid on the DOM showing historical volume distribution.
-
Trade Flash Indication: Price levels flash briefly when trades occur (InpDOMFlashDuration), indicating active price levels.
-
Current Bid/Ask Highlighting: Special highlighting for the current bid and ask prices with horizontal separator line.
-
Panel Width Control: Adjustable panel width (InpDOMWidth) to balance detail with screen real estate.
DOM Information Panel
Positioned below the DOM, this panel provides real-time analysis of order book dynamics.
-
Bids Rising/Falling Indicator: Shows whether bid-side pressure is increasing or decreasing, with directional arrow and color coding.
-
Large Order Detection Display: Prominently displays when large buy or sell orders are detected in the market.
-
Market State Indicator: Shows current market conditions when no large orders are present.
Time and Sales Panel
The Time and Sales panel provides a real-time tape of all executed trades, essential for reading market momentum and identifying aggressive buyers or sellers.
-
Trade Tape Display: Scrolling list of recent trades showing time, price, and size with color coding for buy/sell direction.
-
Configurable Row Count: Adjustable number of visible trades (InpTimeSalesRows) to balance information density with readability.
-
Big Order Highlighting: Large trades are highlighted with special styling for quick identification.
-
Panel Width Control: Adjustable width (InpTimeSalesWidth) for optimal display on different screen sizes.
Time and Sales Information Panel
This panel summarizes Time and Sales data to show who currently controls the market.
-
Buyers/Sellers In Control: Displays whether buyers or sellers dominate recent trading activity, calculated from the last 20 trades using a rolling window for responsive updates.
-
Directional Arrow: Up arrow for buyer control, down arrow for seller control, with corresponding color coding.
-
Buy/Sell Volume Totals: Shows cumulative buy and sell volume from the Time and Sales data for the current session.
Bid and Ask Price Lines
Visual markers for current bid and ask prices help traders identify the current market spread and price location.
-
Bid Line: Horizontal line at current bid price, toggleable via InpShowBidLine.
-
Ask Line: Horizontal line at current ask price, toggleable via InpShowAskLine.
-
Line Thickness: Configurable line width (InpLineThickness) for visibility on different screen resolutions.
-
Theme-Based Colors: Lines automatically use the current theme's bull and bear colors.
Price Grid Overlay
Optional grid lines help with price level identification and chart readability.
-
Toggle Control: Grid can be enabled or disabled via InpShowGrid parameter.
-
Custom Color: Set a specific grid color (InpGridColor) or use clrNONE to use the theme default.
-
Alpha Transparency: Adjustable grid opacity (InpGridAlpha) to prevent grid lines from obscuring chart data.
-
Price Labels: Grid lines include price labels on the right side for easy reference.
Support and Resistance Zones
Automatically detected support and resistance zones based on high-volume price clusters.
-
Automatic Detection: Zones are identified by analyzing volume concentration at price levels.
-
Support Zones: Price areas below current market with significant historical buying interest.
-
Resistance Zones: Price areas above current market with significant historical selling interest.
-
Zone Flip Detection: System tracks when price breaks through a zone, potentially flipping support to resistance or vice versa.
-
Visual Display: Zones displayed as shaded areas with color indicating support (blue) or resistance (red) nature.
-
Toggle Control: Enable or disable via InpShowSRZones parameter.
Eight Indicator Dial Panel
Eight mini gauge dials provide quick visual reference for multiple technical indicators, showing bullish, bearish, or neutral conditions.
-
Triple Moving Average (3MA): Analyzes the alignment of fast (8), medium (21), and slow (50) period moving averages. Bullish when fast > medium > slow, bearish when reversed.
-
Standard Deviation (STD): Measures volatility breakout conditions. Shows stronger signals during high volatility periods.
-
SuperTrend (ST): ATR-based trend indicator. Bullish when price is above the upper band, bearish when below the lower band.
-
Average True Range (ATR): Shows volatility expansion or contraction combined with price direction.
-
Trend (TRD): Price action analysis comparing current price to H4 highs/lows and recent candle direction.
-
Relative Strength Index (RSI): Classic momentum oscillator. Bullish in oversold territory (<30), bearish in overbought (>70).
-
MACD (MCD): Moving Average Convergence Divergence. Analyzes histogram direction and MACD line position.
-
Commodity Channel Index (CCI): Momentum indicator. Strong signals above +100 or below -100.
-
Configurable Periods: Each indicator's period is adjustable via input parameters (InpMAPeriodFast, InpMAPeriodMid, InpMAPeriodSlow, InpRSIPeriod, etc.).
-
Needle Animation: Each dial features a needle that rotates based on signal strength, from -90 degrees (strong sell) to +90 degrees (strong buy).
Signal Analysis Panel
The signal panel synthesizes multiple data sources into a clear directional bias.
-
Overall Signal Display: Shows BULLISH, BEARISH, or NEUTRAL based on combined analysis of indicators, volume, and price action.
-
Confidence Arrows: Visual arrows below the signal meter indicating confidence level and direction.
-
Multi-Factor Analysis: Signal incorporates 8 indicator dials, volume pressure, price vs VWAP, and cumulative delta.
Market Advisor Panel
Text-based market analysis providing actionable trading guidance.
-
5-Minute Delta Analysis: Shows recent delta trend with percentage change, indicating short-term buying or selling pressure.
-
Key Level Status: Reports price position relative to POC, VWAP, and Value Area boundaries.
-
Action Advice: Suggests trading actions based on current market conditions and indicator alignment.
-
Mini Volume Profile: Small volume profile display within the advisor panel showing recent volume distribution with POC line.
Bulls vs Bears Pressure Gauge
The bottom pressure bar provides a visual representation of the ongoing battle between buyers and sellers.
-
Real-Time Calculation: Calculates bull and bear pressure from visible heatmap columns' buy and sell volumes.
-
Percentage Display: Shows exact percentage of volume attributed to bulls (left side) and bears (right side).
-
Gradient Fill: Gradient color fill from bull color to bear color, with center marker showing the dividing line.
-
Control Indicator: Center text shows 'BULLS WINNING', 'BEARS WINNING', or 'BULLS vs BEARS' based on which side exceeds 55%.
-
Smoothed Movement: Gauge moves gradually based on order size - big orders cause bigger movement, small orders cause smaller movement. This prevents constant jittering and shows true control.
Panel Theme
Choose between dark and light panel backgrounds to suit your trading environment and personal preference.
-
Dark Theme (PANEL_DARK): Dark background optimized for extended screen time, reducing eye strain during long trading sessions.
-
Light Theme (PANEL_LIGHT): Bright background suitable for well-lit environments or traders who prefer lighter interfaces.
Color Themes
Eight color themes provide different visual styles for bull and bear representation.
-
Classic: Traditional green for bullish, red for bearish.
-
Blue-Orange: Blue for bullish, orange for bearish.
-
Cyan-Magenta: Cyan for bullish, magenta for bearish.
-
Lime-Pink: Lime for bullish, pink for bearish.
-
Gold-Purple: Gold for bullish, purple for bearish.
-
Teal-Coral: Teal for bullish, coral for bearish.
-
Sky-Crimson: Sky blue for bullish, crimson for bearish.
-
Mint-Rose: Mint for bullish, rose for bearish.
Font Customization
Customize text appearance throughout the interface.
-
Font Name (InpFontName): Default is 'Segoe UI'. Any system-installed font can be used.
-
Font Size (InpFontSize): Base font size in points. Default is 9.
-
Font Color (InpFontColor): Override theme text color with a custom color, or use clrNONE for theme default.
Panel Layout
Control the size and position of the main panel.
-
Panel X Position (InpPanelX): Horizontal offset from chart left edge. Default is 10 pixels.
-
Panel Y Position (InpPanelY): Vertical offset from chart top edge. Default is 10 pixels.
-
Panel Width (InpPanelWidth): Total panel width in pixels. Default is 1500.
-
Panel Height (InpPanelHeight): Total panel height in pixels. Default is 850.
Session Time Configuration
Configure the trading session boundaries for accurate volume profile and data analysis.
-
Session Start (InpSessionStart): Time when the trading session begins in HH:MM format. Default is '00:00'.
-
Session End (InpSessionEnd): Time when the trading session ends in HH:MM format. Default is '23:59'.
-
Automatic Reset: Volume Profile, session volumes, VWAP, cumulative delta, and Time and Sales tracking automatically reset at session start.
Performance Optimization
The Expert Advisor is optimized for efficient operation even on lower-specification hardware.
-
Rendering: Uses MQL5 library for efficient drawing, minimizing chart object overhead.
-
Strategy Tester Compatible:Functionality in Strategy Tester with manual indicator calculations when indicator handles are unavailable.
-
Memory Management: Efficient array management with configurable maximum sizes for bubbles, columns, and DOM levels.
Data Sources
The EA processes multiple data streams to generate its visualizations.
-
Tick Data: Real-time tick data for precise trade detection and price updates.
-
Trade Direction Detection: Analyzes tick flags and price movement to determine whether trades are buyer or seller initiated.
-
Volume Generation: Uses power-law distribution to generate realistic trade sizes from tick data when real volume is unavailable.
Calculated Metrics
The EA calculates numerous derived metrics for comprehensive market analysis.
-
Volume Weighted Average Price (VWAP): Session VWAP calculated from cumulative price-volume and total volume.
-
Cumulative Delta: Running total of buy volume minus sell volume for the session.
-
Delta Percentage: Five-minute delta as a percentage of total five-minute volume.
-
Value Area: Calculated as the price range containing 70% of session volume, centered on POC.
Platform Requirements
-
MetaTrader 5: Build 2500 or later recommended for full functionality.
-
Chart Mode: Works on any chart timeframe.
-
Allow DLL Imports: Not required - EA uses only native MQL5 functions.
Recommended Display
-
Minimum Resolution: 1920 x 1080 for full panel display at default size.
-
Optimal Resolution: 2560 x 1440 or higher for best visibility with additional chart space.
-
Panel Scaling: Adjust InpPanelWidth and InpPanelHeight for different screen sizes.
Strategy Tester Demo Download
Although the expert advisor works in strategy tester, it needs live data to perform and render as intended as seen in the videos and images. Please select every tick and have relevant historical data downloaded for your instrument or it might not load correctly. Also make sure its after market opens, optimal time when the markets opening times are in view and not in the rollover period in strategy tester.
Videos available for EA in demonstration