ROC acceleration deceleration indicator
- インディケータ
- バージョン: 1.10
- アップデート済み: 22 9月 2022
- アクティベーション: 5

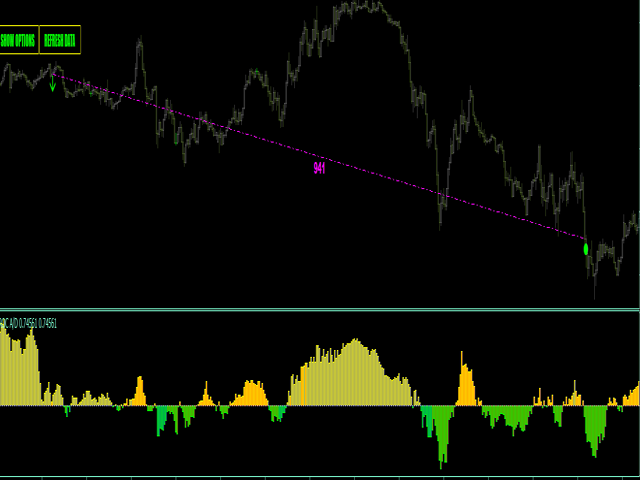
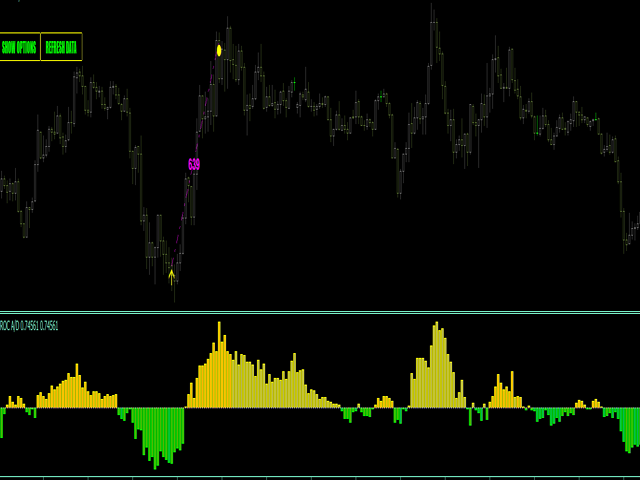
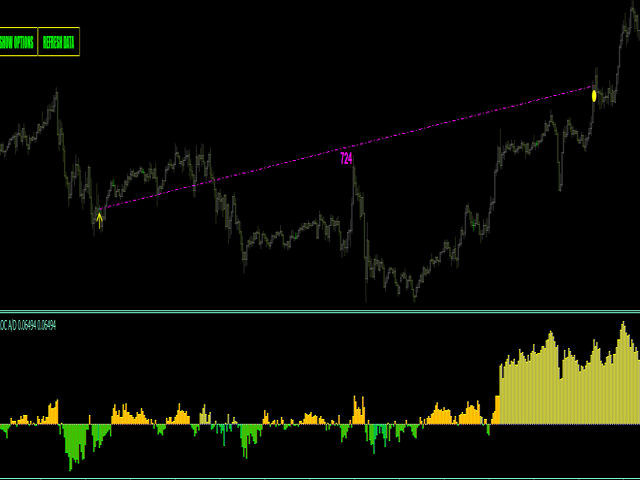
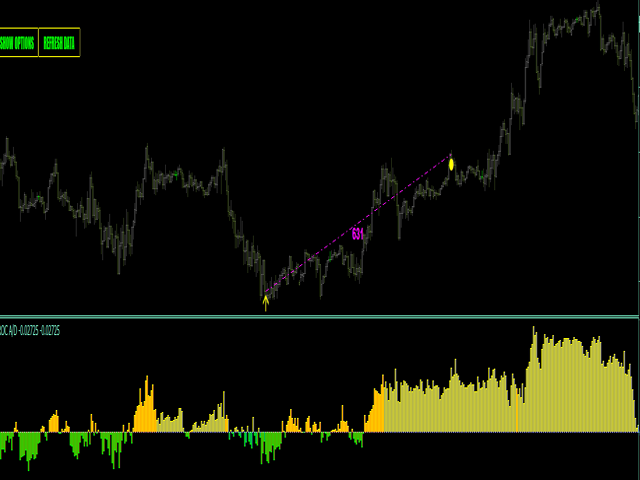
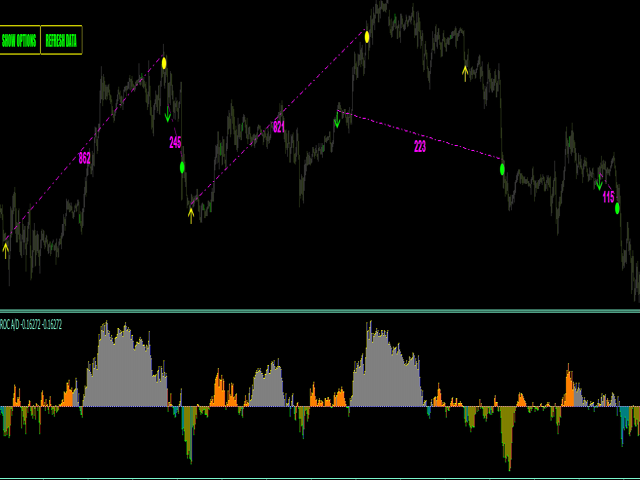
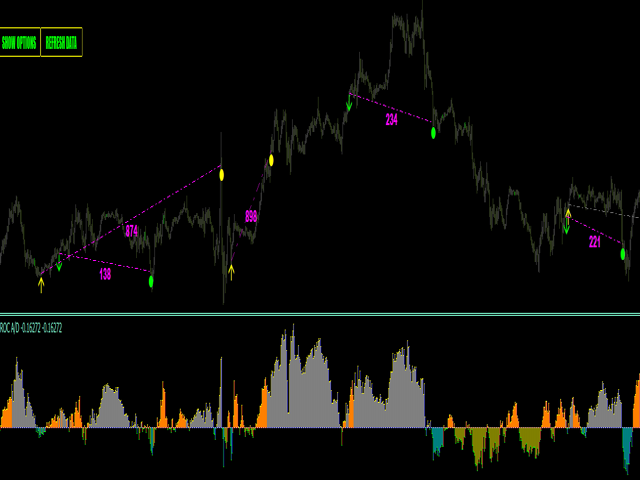
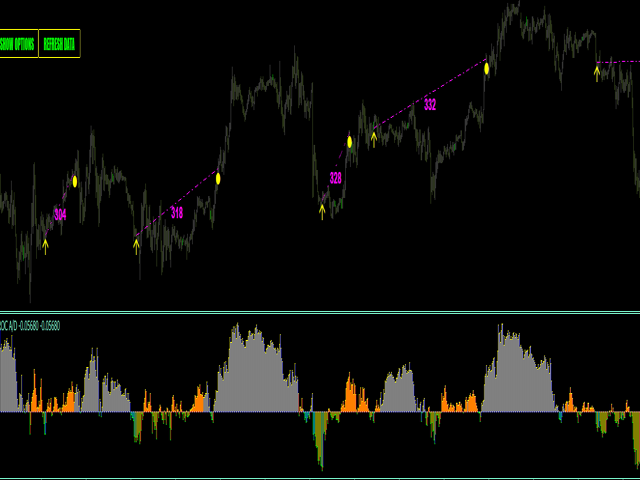
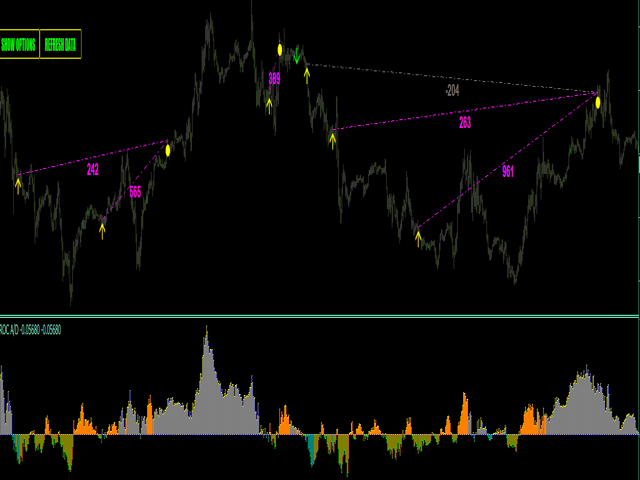
ROC acceleration-deceleration is the manual system for medium-term scalping. Indicator based on custom ROC system which defines bullish/bearish market and especially acceleration-deceleration of tendention in the market's main direction. Buy arrow is plotted during bearish market when current trend decelerates and sell arrow is plotted during bullish market when current trend decelerates.
Main Indicator's Features
- Signals are not repaint,non-late or disappear(exept cases when system recalculates all history datas,refreshing main settings);
- Every signal comes at the open of new bar(system uses only confirmed signals);
- Indicator has Alerts, Mail and Push notifications(allow to trade out of PC, from smartphone/mobile app);
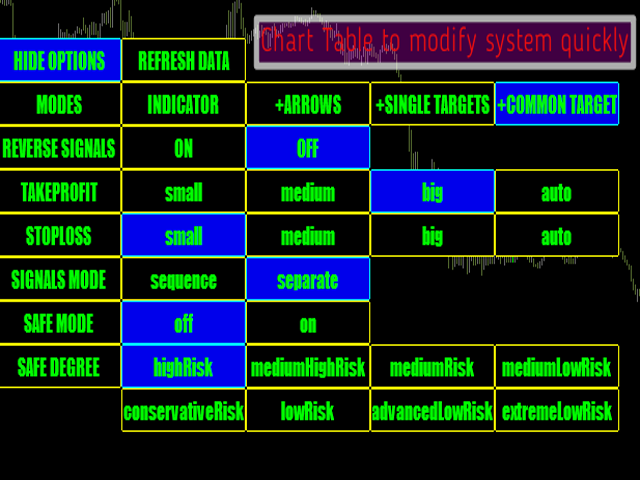
- System has screen table. Using it - you can adjust settings quickly and simply
Recommendations for trading
- M1,M5, M15 till 1hour;
- EURUSD,GBPUSD,USDCAD, Gold ,Crypto;