RSI of OsMA Bands On Array

📘 Product Description: OsMA‑iRSI‑iBands 1.0

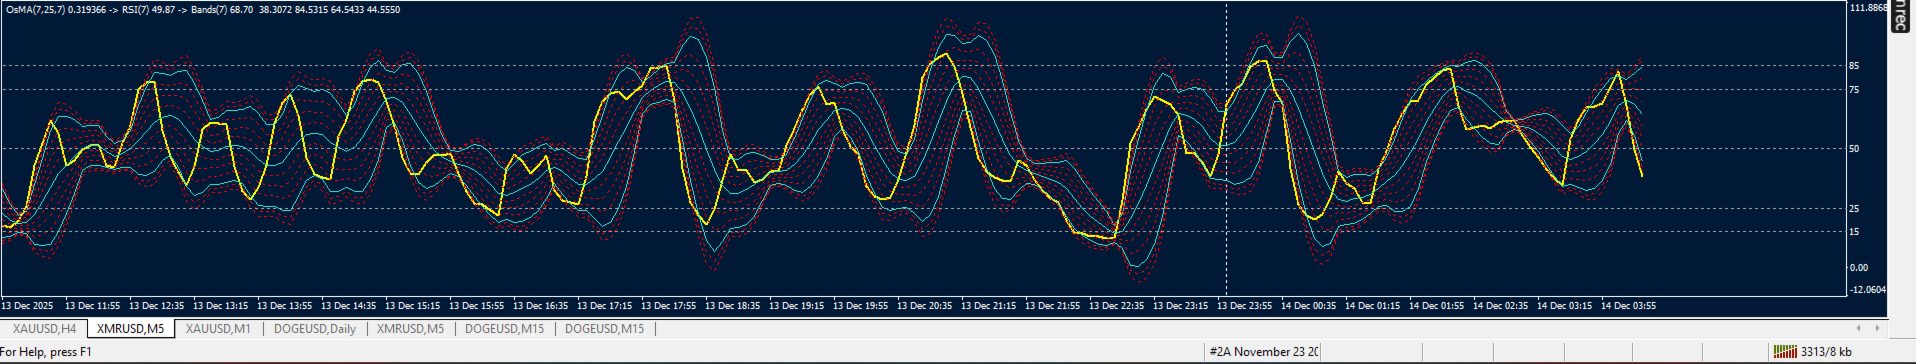
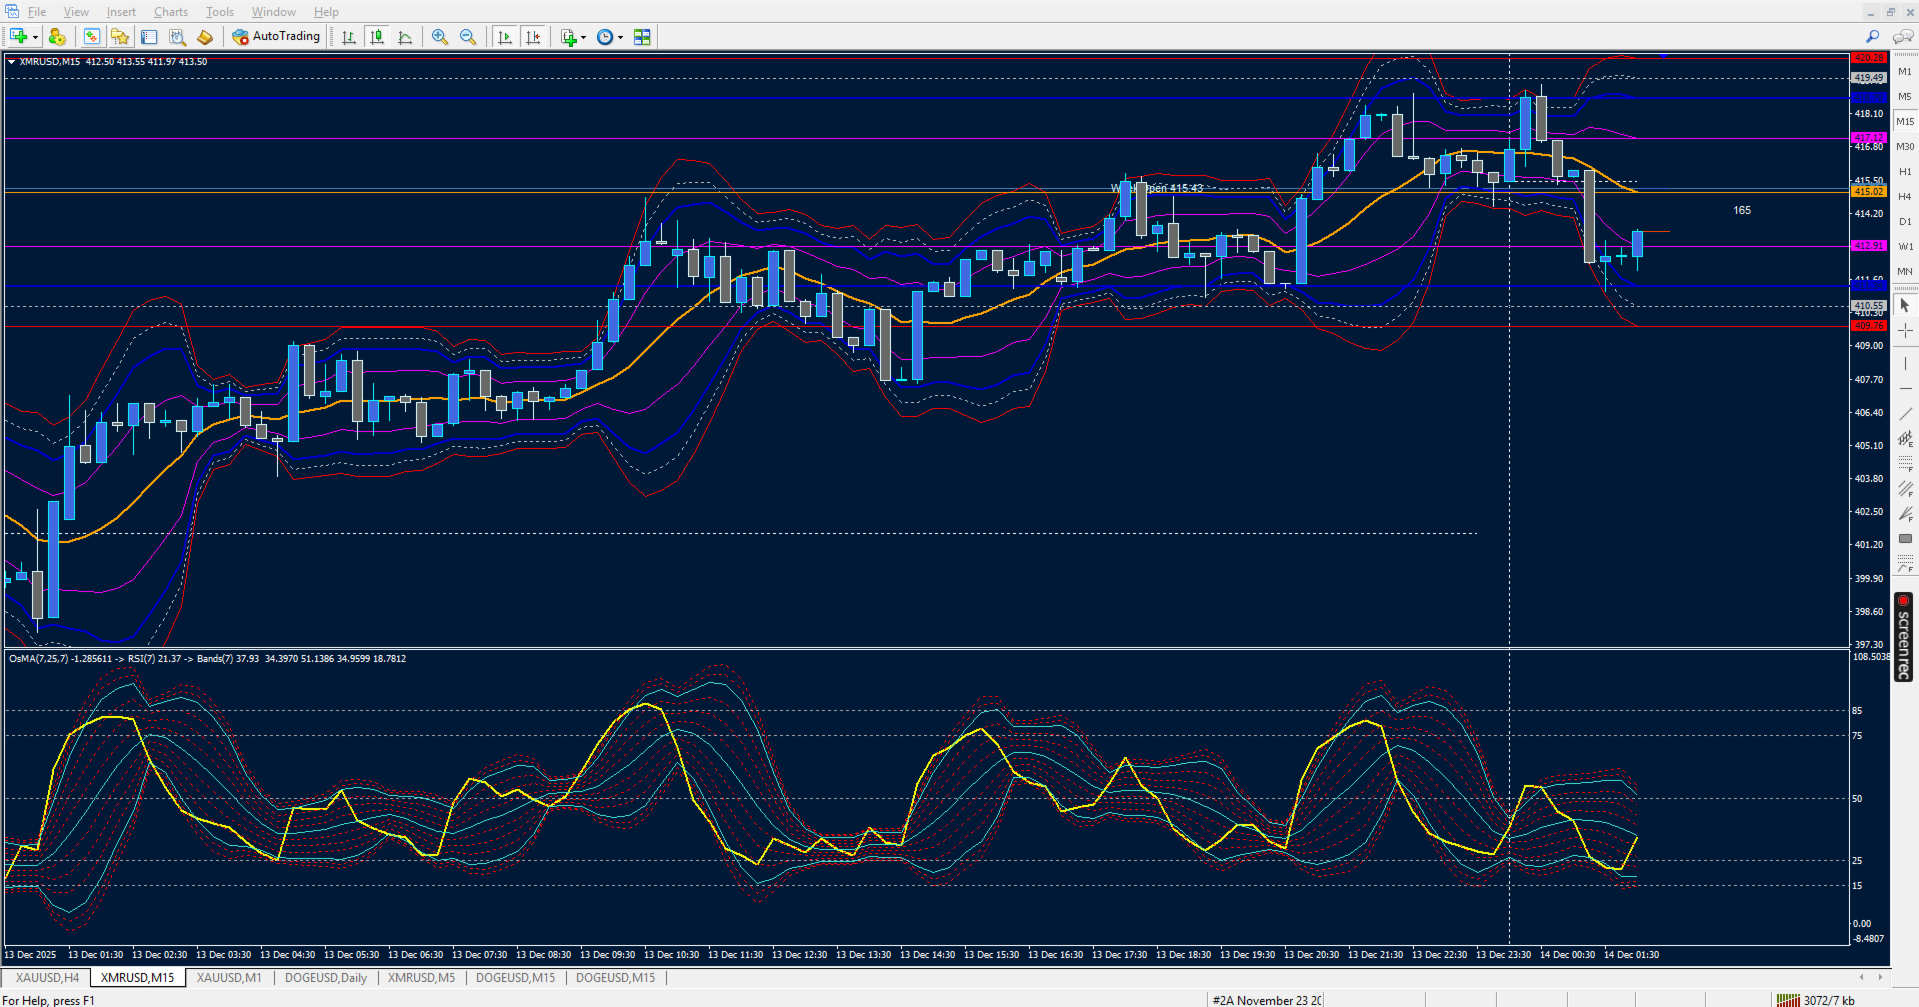
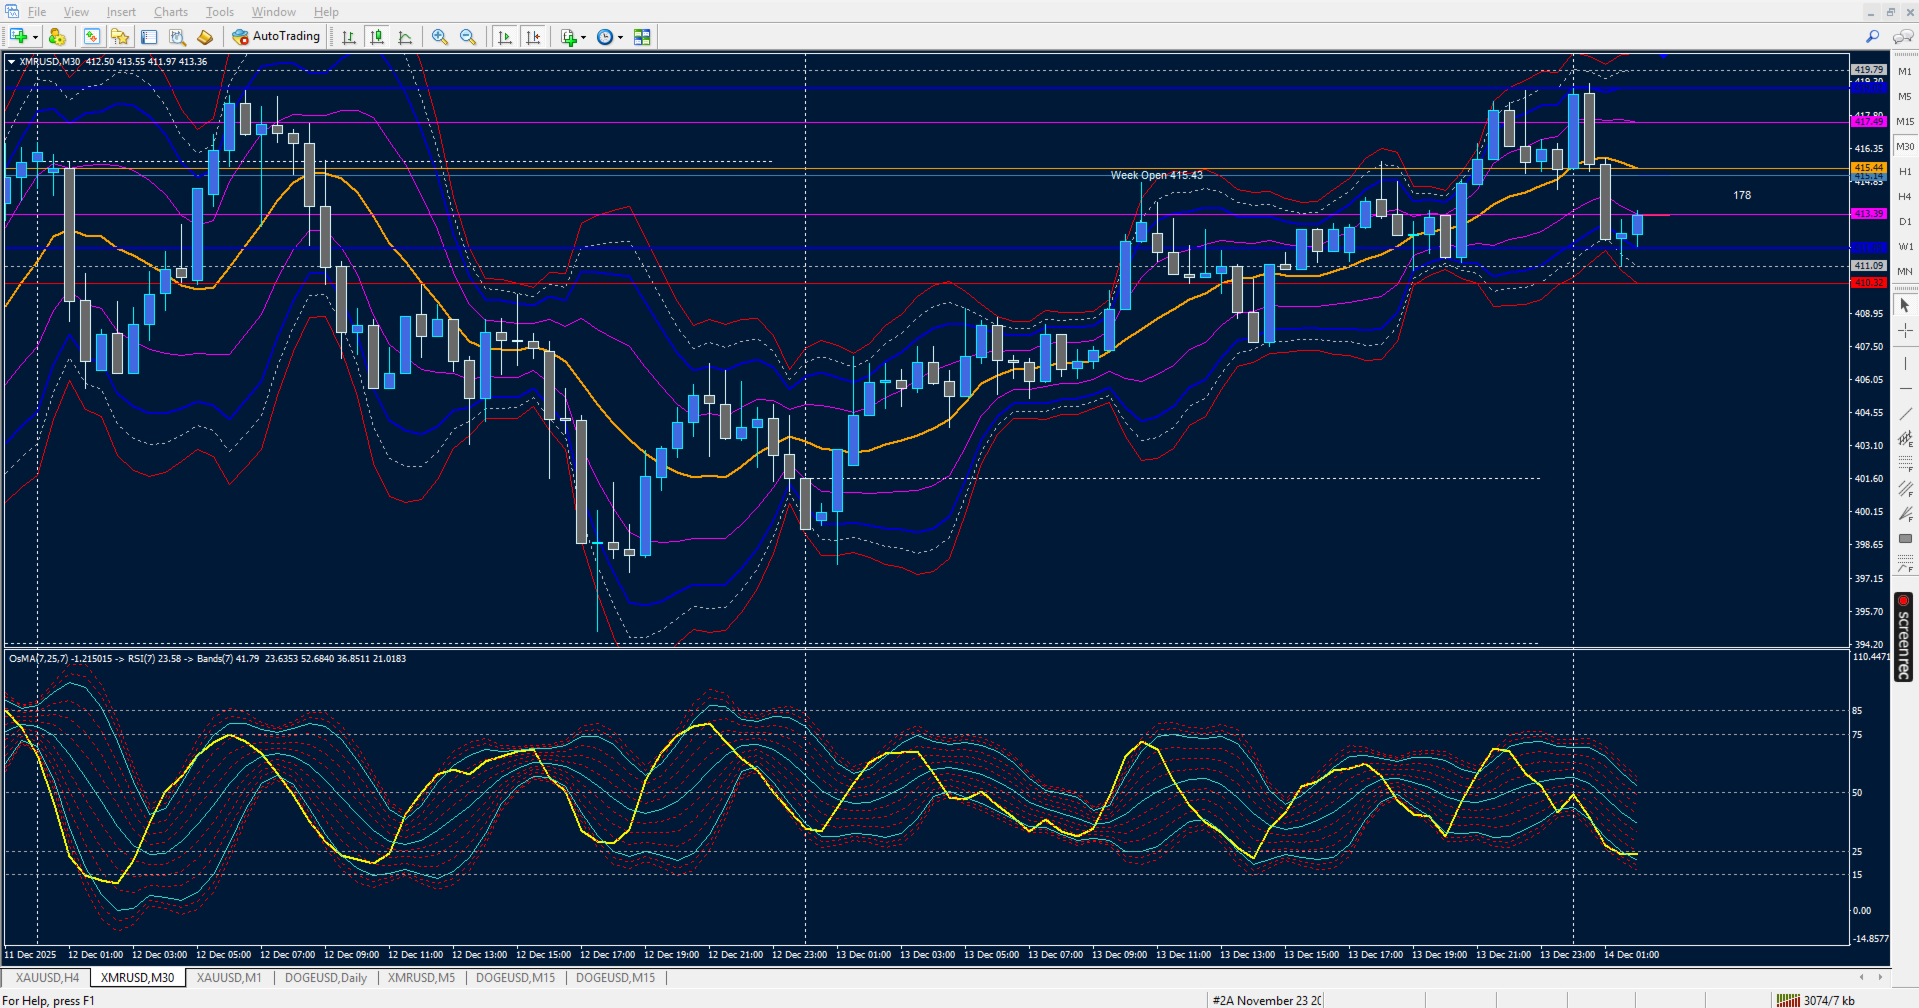
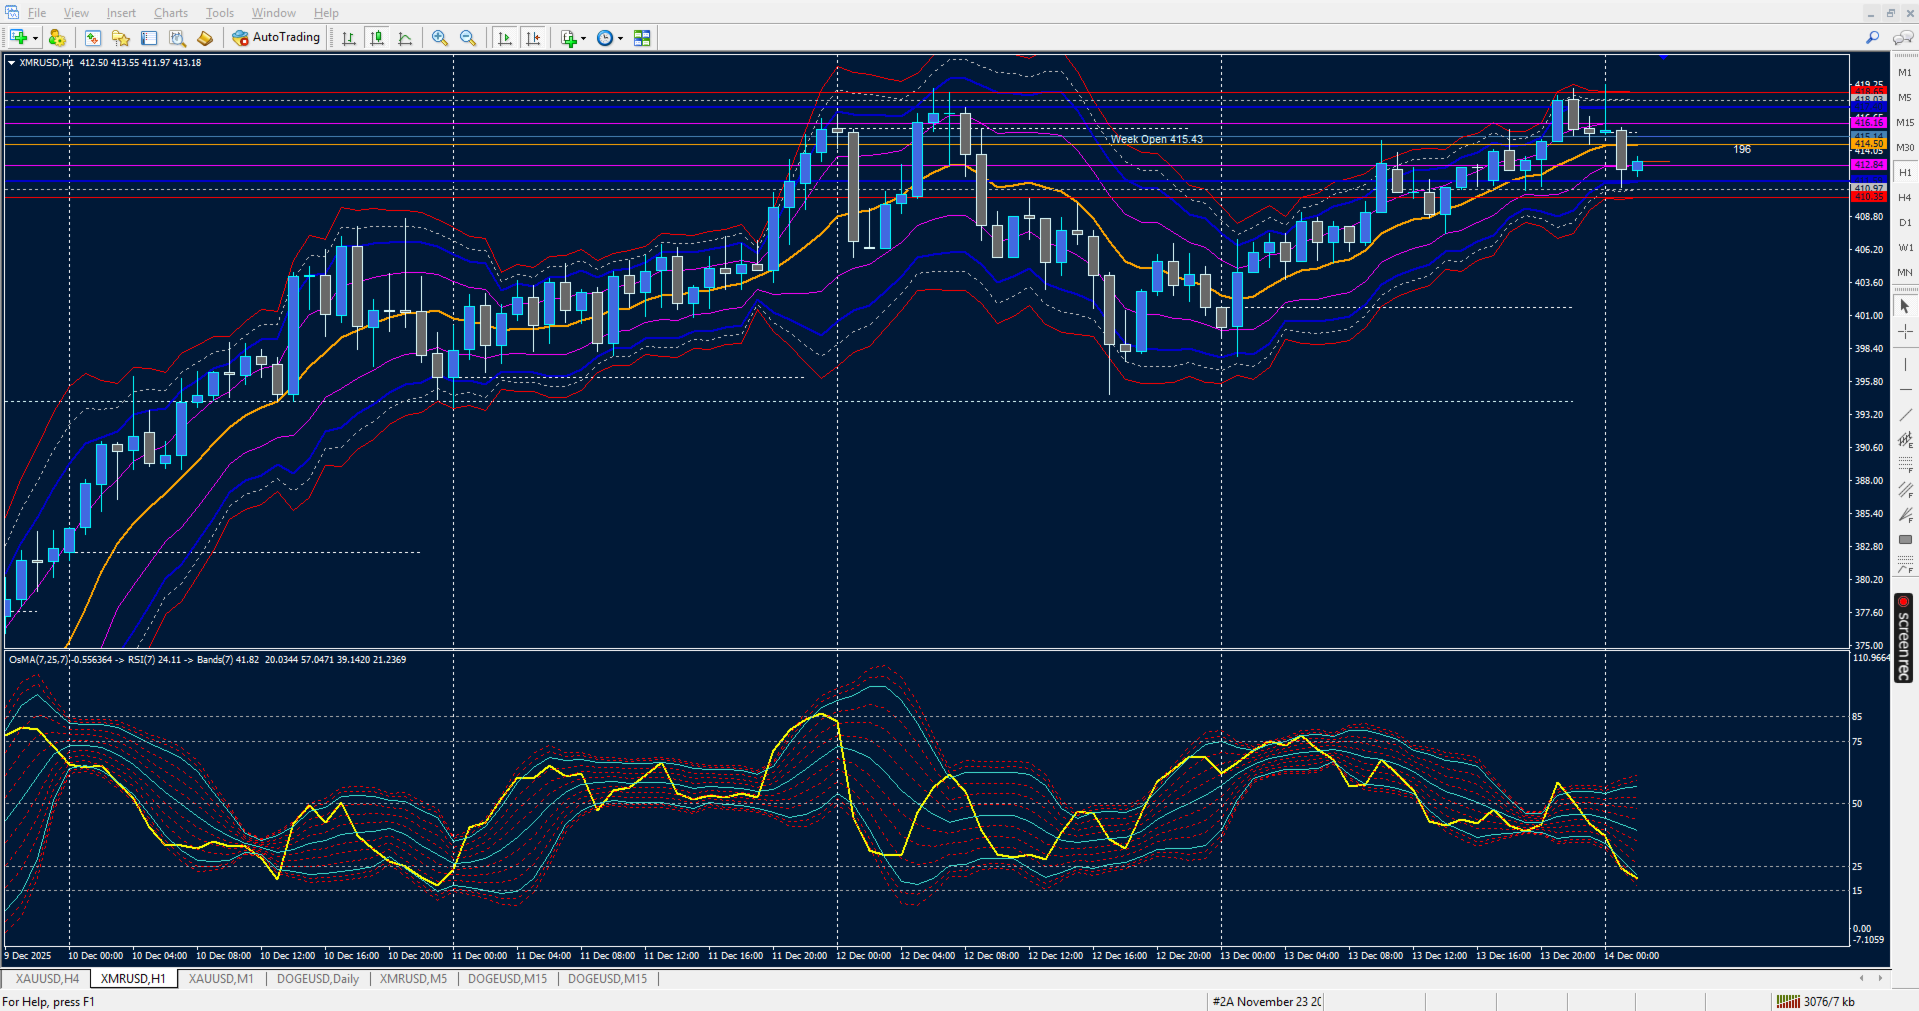
OsMA‑iRSI‑iBands 1.0 fuses the Moving Average of Oscillator (OsMA) with RSI on array and overlays a dynamic band array to give traders a multi-layered view of momentum divergence, trend bias, and volatility compression. This hybrid design helps traders detect early shifts in momentum, confirm overbought/oversold zones, and frame breakout setups with precision. Does not yet displays OsMA histogram.
🔍 Core Components
OsMA Array of RSI on Array of Bollinger Bands
Measures the difference between MACD and its signal line, highlighting momentum divergence and trend acceleration.
RSI on OsMA
Smooths the OsMA signal into a bounded oscillator, making threshold detection and band framing more intuitive.
Bands Levels Array
Six deviation layers plus a central midline:
🔴 Upper Band → potential resistance zone
🟢 Middle Band → equilibrium line (trend bias)
🔵 Lower Band → potential support zone
Additional dotted warning lines frame volatility compression and breakout zones.
🎯 Use Cases
Detect OsMA‑driven momentum shifts with RSI confirmation
Spot volatility compression across band layers before explosive moves
Confirm overbought/oversold signals with band context
Layer OsMA divergence with RSI and adaptive bands for high‑precision trade setups
🛠 Design Philosophy
Explicit buffer mapping for OsMA, RSI, and band arrays
Color separation for immediate visual audit
Minimalist design for clarity in subwindows
Debug mode for diagnostic output and audit transparency

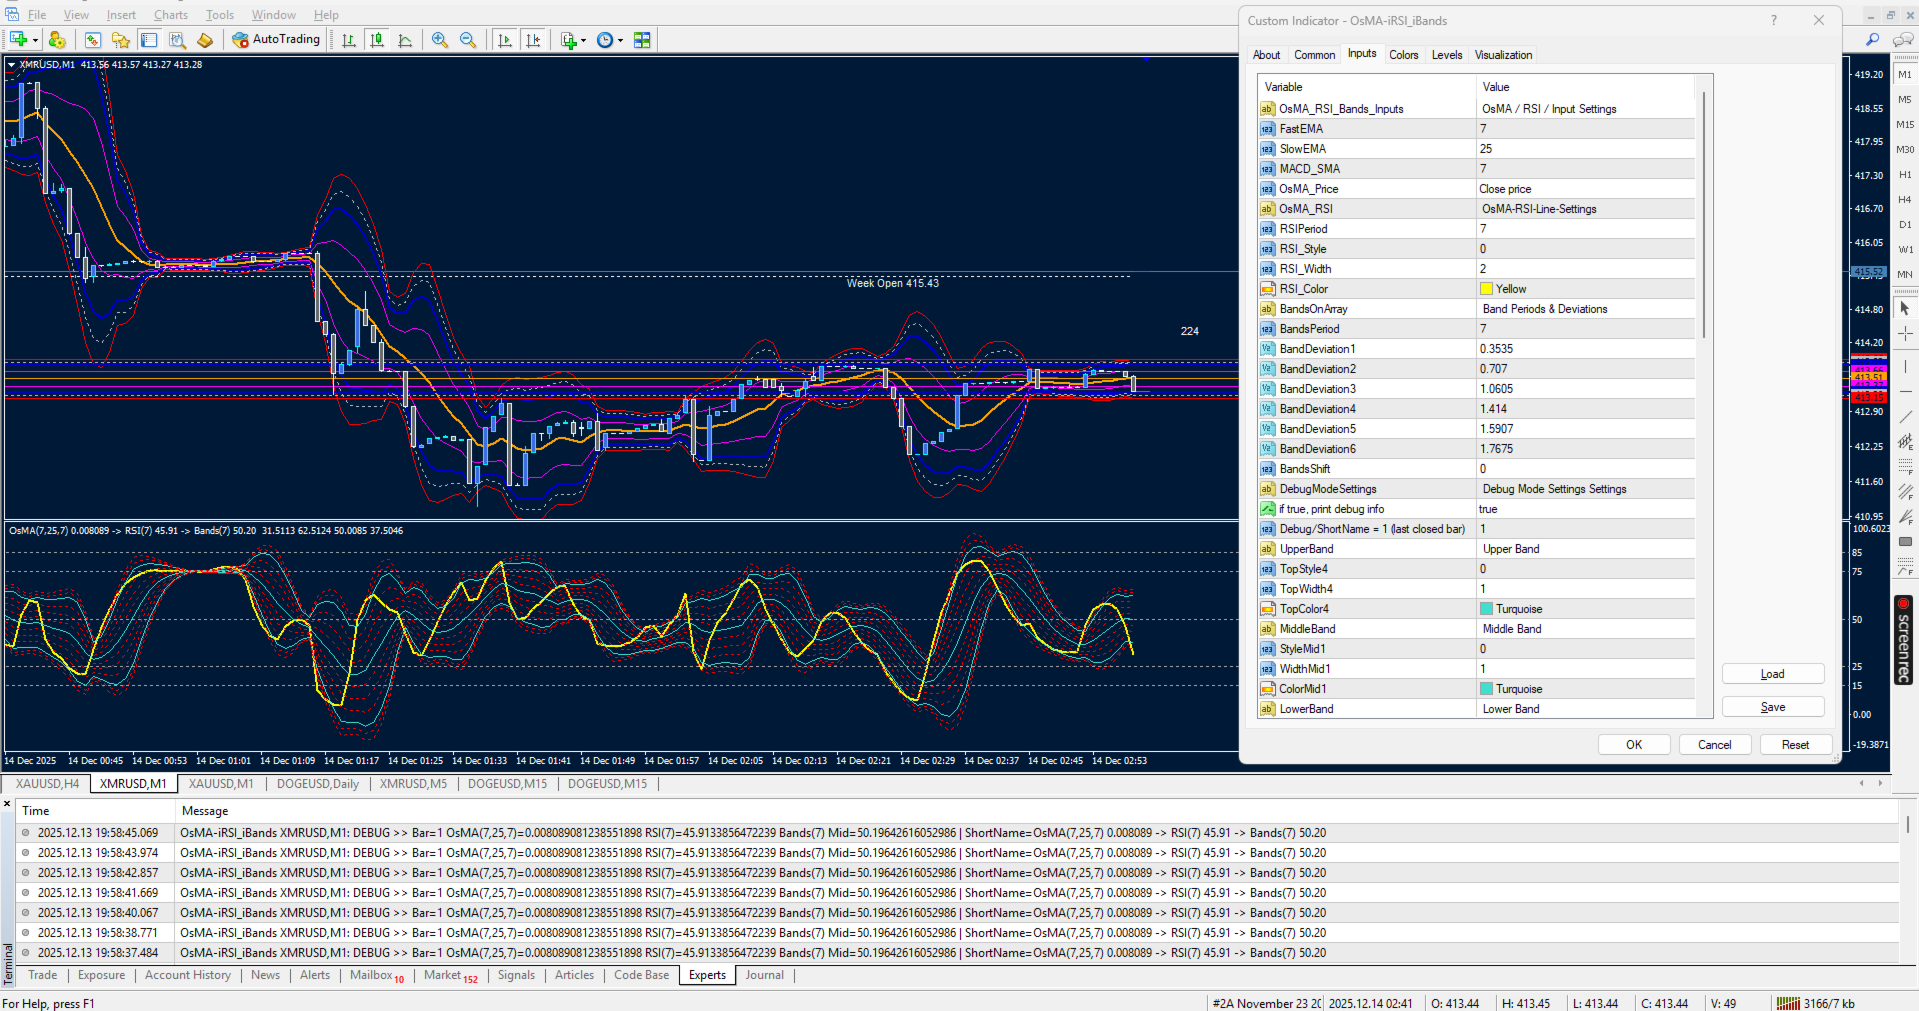
🎛 User Input Controls for OsMA‑iRSI‑iBands 1.0
This indicator gives traders full flexibility to customize the OsMA calculation, RSI smoothing, and band levels. Buyers will have control over the following inputs:

📊 OsMA Settings
⏱ FastEMA → Set the fast EMA period for MACD calculation
⏱ SlowEMA → Set the slow EMA period for MACD calculation
⏱ MACD_SMA → Set the signal line smoothing period
🎚 OsMA_Price → Choose the applied price (Close, Open, High, Low, etc.)

📈 RSI Settings
⏱ RSIPeriod → Define the lookback period for RSI calculation on the OsMA array
🎨 RSI Line Style → Solid or dotted line options
📏 RSI Line Width → Adjust thickness for visibility
🌈 RSI Line Color → Select your preferred color (default: Yellow)

📐 Band Levels Settings
📏 BandsPeriod → Define the moving average period used for band calculations
↔️ BandsShift → Shift bands forward/backward on the chart
📊 Deviation Controls → Six independent deviation inputs for upper/lower bands:
BandDeviation1 (0.3535)
BandDeviation2 (0.707)
BandDeviation3 (1.0605)
BandDeviation4 (1.414)
BandDeviation5 (1.5907)
BandDeviation6 (1.7675)
Each deviation produces its own upper and lower band line, plus a middle line.

🎨 Style & Appearance Controls
🔴 Upper Band Style, Width, Color → Customize the main upper band
🟢 Middle Band Style, Width, Color → Customize the central equilibrium line
🔵 Lower Band Style, Width, Color → Customize the main lower band
🟠 Warning Lines (Upper & Lower) → Six dotted line styles with independent width and color controls for fine‑tuned visual alerts

🐾 Debug Settings
🐾 DebugMode → Toggle debug information printing (true/false)
📍 LastBarIndex → Choose whether to calculate on the current forming bar (0) or last closed bar (1)

おすすめのプロダクト
Forex Gump
Andrey Kozak
2.4 (5)
Forex Gump is a fully finished semi-automatic trading system. In the form of arrows, signals are displayed on the screen for opening and closing deals. All you need is to follow the instructions of the indicator. When the indicator shows a blue arrow, you need to open a buy order. When the indicator shows a red arrow, you need to open a sell order. Close orders when the indicator draws a yellow cross. In order to get the most effective result, we recommend using the timeframes H1, H4, D1. There
The new update makes this indicator a complete tool for studying, analyzing and operating probabilistic patterns. It includes: On-chart Multi-asset percentage monitor. Configurable martingales. Twenty-one pre-configured patterns , including Mhi patterns and C3. An advanced pattern editor to store up to 5 custom patterns. Backtest mode to test results with loss reports. Trend filter. Hit operational filter. Martingale Cycles option. Various types of strategies and alerts. Confluence between patte
Pivot Points MT4
KEENBASE SOFTWARE SOLUTIONS
KT Pivot Points は、最新の市場データに基づいて、日足・週足・月足のピボットレベルをチャート上に自動で表示します。ピボットポイントは、特にFX市場において、テクニカル分析で広く利用されている指標の一つです。 特徴 価格がピボットレベルに到達した際にアラートを送信します。  各種類のピボットレベルに対して完全なカスタマイズが可能です。   シンプルな表示で、日足・週足・月足のピボットレベルを一目で確認できます。 最小限のCPUリソースを使用し、高速な計算を実現します。 チャート上の他のインジケーターとも互換性があります。 ピボットポイントとは ピボットポイントは、前の取引日の高値、安値、終値の平均から算出されます。  この計算により、将来のサポートおよびレジスタンスレベルを予測でき、価格がこれらのレベル付近でどのように動くかを判断する手助けとなります。 また、価格がピボットポイントの上にあるときは強気傾向、下にあるときは弱気傾向とされるのが一般的です。 ピボットの計算式 ピボットレベルの計算には、前日、週、または月の高値、安値、終値が使用されます。 P = (H +
Platinum FX индикатор для скальпинга. идеально подходит для торговли бинарными опционами. работает на всех валютных парах мультитаймфреймовый. когда появляемся красная стрелка мы покупаем когда появляемся красная мы продаем. он должен был достичь успеха в трейдинге. Полное отсутствие перерисовки. Точность сигнала. точность данного инструмента можете увидеть в тестере Всем удачных торгов By Lilyyy
The indicator allows you to trade binary options. The recommended time frame is М1 and the expiration time is 1,2,3 minutes. The indicator suitable for auto and manual trading. A possible signal is specified as a arrows above/under a candle. You should wait until the candle closes! Arrows are not re-painted Trade sessions: TOKYO section (Half-end) Currency pairs: USD/JPY Working time frame: M1 Expiration time: 1,2,3 minutes. The indicator also shows good results when using the martingale strateg
FREE
Binary Options Assistant (BOA) ICE Signals Indicator provides signals based on gkNextLevel Binary Options Strategy.  Indicators: 2 Bollinger Bands & Stochastic Stop missing trades, stop jumping from chart to chart looking for trade set-ups and get all the signals on 1 chart! U se any of the BOA Signals Indicator with the  Binary Options Assistant (BOA) Multi Currency Dashboard .   All BOA Signal Indicator settings are adjustable to give you more strategy combinations. The signals can be seen
FREE
This indicator has been created for finding the probable reversal points of the symbol price. A small candlestick reversal pattern is used it its operation in conjunction with a filter of extremums. The indicator is not redrawn! If the extremum filter is disabled, the indicator shows all points that have a pattern. If the extremum filter is enabled, the condition works – if the history Previous bars 1 candles back contains higher candles and they are farther than the Previous bars 2 candle, such
FREE
Price Action Map is an advanced trading indicator meticulously designed to provide clear visual insights into market structure by precisely labeling Higher Highs (HH) , Higher Lows (HL) , Lower Highs (LH) , and Lower Lows (LL) . Traders who find it challenging to accurately identify higher highs, lower lows, or understand different market phases will find this tool exceptionally valuable. Price Action Map significantly simplifies the analysis process, enabling traders at all skill levels to con
Smart Gread Ultimate Edition (SGUL) indicator - based on smart order grid strategy. Maximum customization and flexibility of strategies are the main features of this indicator. In the right corner there is a table with the number and volume of orders. List of adjustable parameters: K: 2.0 - Factor of the next order increase (if the price moves in the other direction). TP: 50 - The number of points at which the order is closed with a profit (minimum profit per 1 lot). Step: 80 - The numb
Intraday Secret Levels Pro Intraday Secret Levels Pro は、取引日の中で価格が自然に反応する 重要な日中サポートおよびレジスタンスレベル を明確に表示するために設計された、プロフェッショナルグレードのインジケーターです。 売買シグナルを生成するのではなく、本ツールは 明確で構造化された価格フレームワーク を提供し、価格の動き、反応、市場構造に基づいた判断をトレーダーが行えるよう支援します。 このインジケーターは、 明瞭さ、正確性、安定性 を重視するトレーダー向けに設計されており、リペイントや不要な複雑さは一切ありません。 このインジケーターは何をしますか? Intraday Secret Levels Pro は、自動的に 水平な価格レベル を描画し、以下の役割を果たします。 日中サポートゾーン 日中レジスタンスゾーン 均衡および価格反応レベル これらのレベルにより、トレーダーは次の点を把握できます。 価格が一時的に停滞しやすいエリア 反発や保ち合いが発生しやすいゾーン エントリー、エグジット、リスク管理のための重要な価格レベル すべ
Pivot Points are a classic technical analysis indicator that calculates the central pivot point (PP) as well as support (S1–S3) and resistance (R1–R3) levels based on the previous day’s High, Low, and Close. The indicator allows you to: • identify key zones where the price may bounce or break through • determine the direction of the trend • find good entry points, as well as set stop loss and take profit levels Indicator settings: • enable/disable PP, R1/S1, R2/S2, R3/S3 • enable/disable price l
FREE
Provides instant signals on the chart in panel form. Equipped with signal description and trading analysis tools such as drawing auto trendlines, support/resistance area, regression channel, Fibonacci levels, Pivot levels and current signal price, signal time, signal expiry and stoploss recommendation. Also sending alert messages to all available mt4 alert tool. A detailed description panel provides information about where the signal comes from and what indicators are behind the signal. Includin
This tool draws all the pivot point lines on chart. It is important to remind/tell you that there are 5 pivot method according to BabyPips website. All these methods have their unique mathematical formula. 1. Floor Method. 2. Woodie Method. 3. Camarilla Method. 4. DeMark Method. 5. Fibonacci Method. What makes this pivot tool unique is that you can click the "Fibonacci" button to select the pivot method you want. You can click the "Monthly" button to select the Period you want to use for the piv
Indicator for binary options arrow is easy to use and does not require configuration works on all currency pairs, cryptocurrencies buy signal blue up arrow sell signal red down arrow tips do not trade during news and 15-30 minutes before their release, as the market is too volatile and there is a lot of noise it is worth entering trades one or two candles from the current period (recommended for 1 candle) timeframe up to m 15 recommended money management fixed lot or fixed percentage of the depo
Introducing the Pivot Point Selector Indicator: Your Ultimate Tool for Custom Pivot Levels Are you ready to take your trading to the next level? Say hello to the Pivot Point Selector Indicator, a game-changing tool that puts you in control of your pivot levels. This innovative indicator empowers you to choose three specific points that will determine the pivot level calculations, giving you unparalleled customization and precision in your trading strategy. Key Features and Benefits: Custom Pivo
FREE
Market Structure Zig Zag
Lesedi Oliver Seilane
4.66 (29)
Free Market structure zig zag to assist in price action trading the screenshots describe how to use and how to spot patterns new version comes with alerts, email alert and  push notification alert can be used on all pairs  can be used on all timeframes  you can add additional confirmation indicators the indicator shows you your higher high and low highs as well as your lower lows and lower highs  the indication makes price action analysis easier to spot.
FREE
Price Magnet — Price Density and Attraction Levels Indicator Price Magnet is a professional analytical tool designed to identify key support and resistance levels based on statistical Price Density. The indicator analyzes a specified historical period and detects price levels where the market spent the most time. These zones act as “magnets,” attracting price action or forming a structural base for potential reversals. Unlike traditional Volume Profile tools, Price Magnet focuses on price-time d
The Pivot Indicator is a vital tool for technical analysis used by traders in the financial markets. Designed to assist in identifying potential reversal points or trend changes, this indicator provides valuable insights into key levels in the market. Key features of the Pivot Indicator include: Automatic Calculations: The Pivot Indicator automatically calculates Pivot Point, Support, and Resistance levels based on the previous period's high, low, and close prices. This eliminates the complexity
FREE
The "Market Profile" indicator displays the profiles and volumes of periods – weekly, daily, session (8-hour), 4-hour, hour, summary. The VAH/VAL price area is automatically highlighted by a dotted line for each profile (except for the summary). The indicator includes chroma Delta, which colors the profile areas. The areas of prevailing Buys is colored in green, that of Sells - in red. The intensity histogram features blue/red respectively. In the filter mode, the indicator displays the volume a
We present you the indicator "Candle closing counter", which will become your indispensable assistant in the world of trading. That’s why knowing when the candle will close can help: If you like to trade using candle patterns, you will know when the candle will be closed. This indicator will allow you to check if a known pattern has formed and if there is a possibility of trading. The indicator will help you to prepare for market opening and market closure. You can set a timer to create a pre
Indicator FiboZag - transfer the indicator to the chart and the Fibonacci levels will be built automatically on the last ZigZag turn. The main advantage lies in the correct construction of Fibonacci levels and markup of price levels. Simple, visual and effective use. The indicator is not redrawn and does not lag. Works on all currency pairs and on all timeframes.
Raymond Cloudy Day Indicator for MT4 – Pivot-Based Reversal and Trend Levels Raymond Cloudy Day Indicator is a pivot-based level indicator for MetaTrader 4 (MT4). It was developed by Ngo The Hung based on Raymond’s original idea and is designed to give a structured view of potential reversal zones, trend extensions and support/resistance levels directly on the chart. The default settings are optimised for XAUUSD on the H1 timeframe, but the indicator can be tested and adjusted for other symbols
The Urgently indicator is designed to quickly determine the situation in the market, reflect the state of the market and signal profitable levels for opening trades. Market conditions change quickly enough, requiring constant calibration of trading strategies. Recommended for use in conjunction with any of the oscillators. The Urgently forex market trend indicator shows the trend direction and entry points. It smooths out price fluctuations when generating a signal by averaging the data and the
The indicator allows you to trade binary options. The recommended time frame is М1 and the expiration time is 1 minutes. The indicator suitable for auto and manual trading. A possible signal is specified as a arrows above/under a candle. You should wait until the candle closes! Arrows are not re-painted Trade sessions: London and New York section Currency pairs: AUD/CAD Working time frame: M1 Expiration time: 1 minute The indicator also shows good results when using the martingale strategy - "Ma
FREE
Pips 外国為替はすぐに使える取引システムです。 このインジケーターは、いつ、どの方向で注文をオープンする必要があるかをチャート上の矢印で示します。 矢印が緑の場合は買い取引をオープンし、矢印が赤の場合は売り取引をオープンします。 すべてが非常にシンプルで非常に効果的です。 テイクプロフィットは15~25ポイントを設定。 ストップロスはポイントレベルで設定されます。 ドットが移動すると、すぐに StopLoss をオーバーライドします。 M1 と M5 の取引に推奨される時間枠。 これはスキャルピング戦略であり、最小の時間枠で最も効果的です。 通貨ペアは任意です。 推奨される通貨のうち、GBPUSD、EURUSD、XAUUSD、USDCHF を提供できます。 設定はデフォルトのままにすることができます。 この戦略を使用すると、毎日 10 ~ 20 件の取引を開始できます。 Pips 外国為替インジケーターの利点: これは、あらゆる通貨ペアに対応する既成の取引戦略です。 これは最小の時間枠 M1 および M5 で取引するためのスキャルピング取引戦略です。 この戦略は非常にシンプルで
「ダイナミック・スキャルピング・オシレーター」は、MT4向けの高度なカスタムCrypto_Forexインジケーターです。効率的な取引ツールです! - 新世代のオシレーター - 使い方は画像をご覧ください。 - ダイナミック・スキャルピング・オシレーターは、適応型の売られ過ぎ/買われ過ぎゾーンを備えています。 - オシレーターは、動的な売られ過ぎ/買われ過ぎエリアから正確なエントリーポイントを見つけるための補助ツールです。 - 売られ過ぎ値:グリーンラインより下、買われ過ぎ値:オレンジラインより上。 - このインジケーターは、プライスアクションパターンと組み合わせるのに最適です。 - 標準的なオシレーターよりもはるかに正確です。対応時間枠:M30、H1、H4、D1、W1。 - PCとモバイルの両方でアラート機能付き。 高品質のトレーディングロボットとインジケーターをご覧になるにはここをクリックしてください! これは、このMQL5ウェブサイトでのみ提供されるオリジナル製品です。
Gioteen Volatility Index (GVI)   - your ultimate solution to overcoming market unpredictability and maximizing trading opportunities. This revolutionary indicator helps you in lowering your losing trades due to choppy market movements. The GVI is designed to measure market volatility, providing you with valuable insights to identify the most favorable trading prospects. Its intuitive interface consists of a dynamic red line representing the volatility index, accompanied by blue line that indicat
SMC Venom Model BPR インジケーターは、スマート マネー (SMC) コンセプトで取引するトレーダー向けのプロフェッショナル ツールです。価格チャート上の 2 つの主要なパターンを自動的に識別します。 FVG   (フェアバリューギャップ) は、3 本のローソク足の組み合わせで、最初のローソク足と 3 番目のローソク足の間にギャップがあります。ボリュームサポートのないレベル間のゾーンを形成し、価格修正につながることがよくあります。 BPR   (バランス価格範囲) は、2 つの FVG パターンの組み合わせで、「ブリッジ」を形成します。これは、価格がボリュームアクティビティの少ない動きで動くときに、ブレイクアウトしてレベルに戻るゾーンで、ローソク足の間にギャップを作成します。 これらのパターンは、大規模な市場プレーヤーと一般参加者の相互作用が発生するチャート上のボリュームと価格動向の分析に基づいて、トレーダーが主要なサポート/レジスタンス レベル、ブレイクアウト ゾーン、エントリ ポイントを識別するのに役立ちます。 インジケーターは、長方形と矢印の形でパターンを視
ナイト ゴースト - バイナリ オプションの矢印インジケーター。 これからのあなたの頼もしいアシスタントです! 11 - チャートの再描画なし - すべての通貨ペアで大活躍! -インジケータの精度は最大 90% (特に夜間) ・長時間の設定不要(バイナリーオプションに最適な設定) - 信号が遅れない - 現在のローソク足でのシグナルの出現 ・M1期にピッタリ(No More!) ・目に優しいキャンドルカラー(赤・青) -インストールされたアラート それを扱う: - 青い矢印は信号アップを示します -赤い下向き矢印 M1 以上のインジケーターをチャートに配置しないでください. シグナルの精度が低下します! インジケーターのスクリーンショットとビデオを見る
Introduction To Time Box Indicator Time Box Indicator is a must have indicator for any trader. It will display daily, weekly and Monthly box according to your preferences. Yet, you can extend any important price levels in your chart automatically. You can use them as the significant support and resistance levels. It is very simple but effective tool for your trading. Graphic Setting Use White Chart Line Style for Current Open price Daily Setting Update Timeframe for daily box Number of days to
FREE
このプロダクトを購入した人は以下も購入しています
Ultimate Sniper Dashboard
Hispraise Chinedum Abraham
4.82 (22)
299ドルで割引中! 今後値上げの可能性あり! 下の説明を読んでください! 究極のスナイパーダッシュボードのための最高のエントリーシステム。究極のダイナミックレベル。(私の製品をチェックしてください) 究極のスナイパーダッシュボードはMT4多通貨テスト制限のため、ライブマーケットでのみ作動します。 究極のスナイパーダッシュボードをご紹介します。HA-Sniper、MA-Sniper、その他多くの特別なモードが含まれる最高の製品です。究極のスナイパーダッシュボードは絶対的な獣です! 初心者やエキスパートトレーダーにとって最高のソリューションです。もう二度と動きを見逃さない! シンプルさとピップを愛するトレーダーのために、特別な製品をご用意しました。シンプルでありながら、ダッシュボードは複数のカスタムアルゴリズムに基づき28の通貨ペアを監視し、すべての作業を行います。たった一つのチャートで、プロのように市場を読み解くことができます。もし、為替ペアが動き出したときに、その方向性を正確に特定することができれば、あなたの取引はどれほど改善されることでしょう。   当社のシステムは、高い確率
Scalper Inside PRO – Since 2020. An exclusive indicator that utilizes an innovative algorithm to swiftly and accurately determine the market trend. The indicator automatically calculates opening, closing, and profit levels, providing detailed trading statistics. With these features, you can choose the most appropriate trading instrument for the current market conditions. Additionally, you can easily integrate your own arrow indicators into Scalper Inside Pro to quickly evaluate their statistics
まず第一に、この取引ツールはノンリペイント、ノンリドロー、ノンラグの指標であり、プロの取引に理想的ですことを強調する価値があります。 オンラインコース、ユーザーマニュアル、デモ。 スマートプライスアクションコンセプトインジケーターは、新米から経験豊富なトレーダーまで、非常 に強力なツールです。Inner Circle Trader AnalysisやSmart Money Concepts Trading Strategiesなど、20以上の有用な指標を1つに組み合わせています。このインジケーターはスマートマネーコンセプトに焦点を当て、大手機関の取引方法を提供し、彼らの動きを予測するのに役立ちます。 特に、流動性分析に優れており、機関がどのように取引しているかを理解しやすくしています。市場のトレンドを予測し、価格の動きを慎重に分析するのに優れています。機関の戦略とトレードを合わせることで、市場の動向についてより正確な予測ができます。このインジケーターは多目的であり、市場構造を分析し、重要な注文ブロックを特定し、さまざまなパターンを認識するのに優れています。 このインジケーターは
Route Lines Prices -は、価格の方向性を予測するために設計されたインジケーターです。シンプルなインターフェースには、価格変動と将来の方向性を計算するための複数のアルゴリズムが搭載されています。これらのアルゴリズムには、使用する時間枠に基づいたボラティリティ計算と価格平滑化が含まれています。 このインジケーターには、「 Calculating price values 」値を変更するためのパラメーターが1つだけあります。デフォルト値の1は、バランスの取れた自動計算を提供し、インジケーターを手動で設定することなく使用できます。 値を2から500まで手動で変更することで、インジケーターを独自のトレーディングシステムに合わせてカスタマイズできます。 このインジケーターは、M1からH4の時間枠での使用を推奨します。あらゆる取引銘柄で使用できます。 シグナル矢印はローソク足の終値で生成され、過去の履歴には再描画されません。 メインチャートには、重複した矢印が表示されます。 複数のアラートタイプが利用可能です。内蔵のライン軌跡カウンターは、終値に基づいて動作します。これ
「 Dynamic Scalper System 」インジケーターは、トレンド波の中でスキャルピング取引を行う手法のために設計されています。 主要通貨ペアと金でテスト済みで、他の取引商品との互換性があります。 トレンドに沿った短期的なポジションオープンのシグナルを提供し、追加の価格変動サポートも提供します。 インジケーターの原理 大きな矢印はトレンドの方向を決定します。 トレンド波の中では、小さな矢印の形でスキャルピングシグナルを生成するアルゴリズムが機能します。 赤い矢印は強気方向、青い矢印は弱気方向です。 トレンドの方向には敏感な価格変動ラインが描かれ、小さな矢印のシグナルと連動します。 シグナルは次のように機能します。適切なタイミングでラインが現れるとエントリーシグナルが形成され、ラインが開いている間はポジションが保持され、完了すると取引が終了します。 推奨される動作時間枠はM1~H4です。 矢印は現在のローソク足に形成され、次のローソク足が開いている場合は、前のローソク足の矢印は再描画されません。 入力パラメータ Trend Wave Period - トレンド方向
Ultimate Dynamic Levels
Hispraise Chinedum Abraham
4.7 (10)
現在、ホリデーディスカウントで399ドル! 今後値上がりする可能性があります。以下の説明をお読みください。 Ultimate Dynamic Levelsの紹介 - Ultimate Sniper DashboardのBESTエントリーインジケーター! 極めてローリスクなタイムリーエントリーと高RR!!! アルティメットスナイパーダッシュボードはこちら。 初心者はもちろん、プロのトレーダーにとっても最も重要な能力は、いつどこで相場が転換するかを正確に判断し、いかに安全に参入し、利益を得て退場するかを見極めることです。 アルティメット・ダイナミック・レベルズ・インディケーターは、相場が転換する可能性が最も高い場所を簡単に教えてくれるので、極めてローリスクなトレードを自信を持って行うことができ、同時にチャートをクリーンでシンプルに保ちながら、$$$を稼ぐことができるのです! アルティメット・ダイナミック・レベルズ・インディケーターは、複数の時間枠で重要な隠れたレベルを一度に見つけるユニークで強力なアルゴリズムを持っています。また、他の典型的なSRインジケーターのように、レベルを再描
Super Signal – Skyblade Edition プロ仕様のノンリペイント / ノーラグ・トレンドシグナルシステム。卓越した勝率を実現 | MT4 / MT5 対応 1分足、5分足、15分足などの低い時間足で最も効果を発揮します。 主な特徴: Super Signal – Skyblade Edition は、トレンド取引に特化したスマートなシグナルシステムです。マルチレイヤーのフィルターロジックを用いて、明確な方向性と実際のモメンタムに支えられた強力なトレンドのみを検出します。 このシステムは 天井や底を予測するものではありません 。次の3つの条件がすべて満たされた場合にのみシグナルを発生させます: 明確なトレンド方向 モメンタムの増加 健全なボラティリティ構造 市場セッションに基づく流動性分析と組み合わせることで、シグナルの精度とタイミングがさらに向上します。 シグナルの特性: すべての矢印シグナルは 100% 非リペイント / 遅延なし 一度出現したシグナルは固定され、点滅・消失しません チャート上の矢印、情報パネル、ポップアップ通知、音声アラート、プッシュ通知
ON Trade Waves Patterns Harmonic Elliot Wolfeをご紹介します。これは手動および自動の方法を使用して市場のさまざまなパターンを検出するために設計された高度なインジケーターです。以下はその動作方法です: ハーモニックパターン: このインジケーターは、チャートに表示されるハーモニックパターンを識別できます。これらのパターンは、Scott Carneyの「Harmonic Trading vol 1および2」で説明されているように、ハーモニックトレーディング理論を実践するトレーダーにとって重要です。手動で描画するか、自動検出に頼るかにかかわらず、ON Trade Waves Patternsがお手伝いします。 コントロールパネル: このインジケーターはユーザーフレンドリーなコントロールパネルを備えています。チャートと時間枠の設定を保存し、異なる構成間をスムーズに切り替えることができます。チャートスペースを最大限に活用するために最小化することもできます。他の分析ツールで作業することを好む場合、閉じるボタンをクリックするだけで、すべてのインジケーターデ
現在20%OFF! 初心者やエキスパートトレーダーに最適なソリューションです。 このインディケータは、エキゾチックペア・コモディティ・インデックス・先物など、あらゆるシンボルの通貨の強さを表示することに特化したインディケータです。金、銀、原油、DAX、US30、MXN、TRY、CNHなどの通貨の強さを表示するために、9行目にどのシンボルでも追加することができます。独自の機能を多数搭載し、新しい計算式を採用したため、ユニークで高品質、かつ手頃な価格のトレーディングツールとなっています。新しいトレンドやスキャルピングチャンスのトリガーポイントを正確に把握することができるため、あなたのトレードがどのように改善されるか想像してみてください。 ユーザーマニュアル:ここをクリック   https://www.mql5.com/en/blogs/post/708876 すべての時間枠に対応します。あなたはすぐにトレンドを見ることができるようになります! 新しいアルゴリズムに基づいて設計されているため、潜在的な取引の特定と確認がより簡単になります。これは、8つの主要通貨と1つのシンボルの強弱
BTMM State Engine Pro is a MetaTrader 4 indicator for traders who use the Beat The Market Maker approach: Asian session context, kill zone timing, level progression, peak formation detection, and a multi-pair scanner from a single chart. It combines cycle state logic with a built-in scanner dashboard so you do not need the same tool on many charts at once. What it does Draws the Asian session range; session times can follow broker server offset or be set in inputs. Tracks level progression (L
Linear Trend Predictor ー - エントリ ポイントと方向サポート ラインを組み合わせたトレンド インジケーター。高値/安値チャネルを突破するという原理に基づいて機能します。 インジケーターのアルゴリズムは市場のノイズをフィルタリングし、ボラティリティと市場の動向を考慮します。 インジケーターの機能  平滑化手法を使用して、市場のトレンドと、買い注文または売り注文を開くためのエントリー ポイントを表示します。  任意の時間枠のチャートを分析して、短期および長期の市場の動きを判断するのに適しています。  あらゆる市場や時間枠に適応可能な入力パラメータにより、トレーダーはインジケーターを独自にカスタマイズできます。  設定されたインジケーター信号は消えず、再描画もされません。ローソク足の終値で決定されます。  いくつかの種類の通知が矢印と組み合わされています。  このインジケーターは、独立した取引システムとして使用することも、他の取引システムへの追加として使用することもできます。  あらゆるレベルの経験を持つトレーダーが使用できます。 主なパラメータ Vol
GOLD Impulse with Alert
Bernhard Schweigert
4.67 (12)
このインディケータは、当社の2つの製品 Advanced Currency IMPULSE with ALERT  +   Currency Strength Exotics . のスーパーコンビネーションです。 このインジケーターは全ての時間枠で作動し、8つの主要通貨と1つのシンボルの強弱のインパルスをグラフで表示します。 このインジケータは、金、エキゾチックペア、商品、インデックス、先物など、あらゆるシンボルの通貨強度の加速度を表示することに特化されています。金、銀、原油、DAX、US30、MXN、TRY、CNHなどの通貨強度の加速度(インパルスまたは速度)を表示するために、任意のシンボルを9行目に追加できる、この種の最初のものです。 新しいアルゴリズムに基づいて構築され、潜在的な取引の特定と確認がさらに容易になりました。これは、通貨の強さや弱さが加速しているかどうかをグラフィカルに表示し、その加速の速度を測定するためです。加速すると物事は明らかに速く進みますが、これはFX市場でも同じです。つまり、反対方向に加速している通貨をペアリングすれば、潜在的に利益を生む取引を特定
Volatility Trend System - a trading system that gives signals for entries. The volatility system gives linear and point signals in the direction of the trend, as well as signals to exit it, without redrawing and delays. The trend indicator monitors the direction of the medium-term trend, shows the direction and its change. The signal indicator is based on changes in volatility and shows market entries. The indicator is equipped with several types of alerts. Can be applied to various trading ins
Miraculous Indicator – ガン・スクエア・オブ・ナインに基づく100%非リペイントのFXおよびバイナリーツール この動画では、FXおよびバイナリーオプションのトレーダー向けに特別に開発された、非常に正確で強力な取引ツールである Miraculous Indicator を紹介しています。このインジケーターがユニークなのは、伝説的な ガン・スクエア・オブ・ナイン と ガンの振動の法則 に基づいている点で、現代の取引で利用できる最も正確な予測ツールの一つとなっています。 Miraculous Indicatorは 完全に非リペイント であり、ローソク足が確定した後にシグナルが変化したり消えたりすることはありません。つまり、見たものがそのまま利用できます。これにより、トレーダーは自信を持ってエントリーおよびエグジットを行うための信頼性と一貫性のある根拠を得ることができます。 主な特徴: ガン・スクエア・オブ・ナインとガン理論に基づいて構築 100%非リペイントのシグナルシステム すべての時間枠(M1、M5、H1、H4、日足、週足)で機能 FXおよびバイナリーオプション取引
現在40%OFF! 初心者やエキスパートトレーダーのためのベストソリューション! このダッシュボードソフトウェアは、28の通貨ペアで動作しています。それは私達の主要な指標(高度な通貨の強さ28と高度な通貨インパルス)の2に基づいています。それは全体の外国為替市場の大きい概観を与えます。それは、すべての(9)時間枠で28の外国為替ペアのための高度な通貨の強さの値、通貨の動きの速度と信号を示しています。チャート上で1つのインディケータを使用して市場全体を観察し、トレンドやスキャルピングの機会をピンポイントで見つけることができたら、あなたのトレードがどのように改善されるか想像してみてください。 このインディケータには、強い通貨と弱い通貨の識別、潜在的な取引の識別と確認がより簡単になるような機能が搭載されています。このインディケータは、通貨の強さや弱さが増加しているか減少しているか、また、すべての時間枠でどのように機能しているかをグラフィカルに表示します。 新機能として、現在の市場環境の変化に適応するダイナミックなマーケットフィボナッチレベルが追加され、すでに当社のAdvanced
Добрый День уважаемые трейдеры!  Вашему вниманию индикатор созданный и работающий на базе трендовика ADX,  для торговли на смене направления движения который учитывает коррекцию и даёт возможность на ней заработать.  Применяю этот индикатор для скальпинга. Рекомендую таймфреймы от 15 ти минутного(М15) до часового (Н1) периодов.  Красный кружок сигнал на продажу- Sell) Зелёный кружок  сигнал на покупку Buy) Чем меньше ваш таймфрейм тем меньше пунктов вы зарабатываете.   Важно выставлять стопы! !В
NAM Order Blocks
NAM TECH GROUP, CORP.
3.67 (3)
MT4マルチタイムフレームオーダーブロック検出インジケーター。 特徴 -チャートコントロールパネルで完全にカスタマイズ可能で、完全な相互作用を提供します。 -必要な場所でコントロールパネルを表示および非表示にします。 -複数の時間枠でOBを検出します。 -表示するOBの数量を選択します。 -さまざまなOBユーザーインターフェイス。 -OBのさまざまなフィルター。 -OB近接アラート。 -ADRの高線と低線。 -通知サービス(画面アラート|プッシュ通知)。 概要 注文ブロックは、金融機関や銀行からの注文収集を示す市場行動です。著名な金融機関と中央銀行が外国為替市場を牽引しています。したがって、トレーダーは市場で何をしているのかを知る必要があります。市場が注文ブロックを構築するとき、それは投資決定のほとんどが行われる範囲のように動きます。 注文の構築が完了すると、市場は上向きと下向きの両方に向かって急激に動きます。注文ブロック取引戦略の重要な用語は、機関投資家が行っていることを含むことです。それらは主要な価格ドライバーであるため、機関投資家の取引を含むあらゆる戦
ご紹介     Quantum Breakout PRO は 、ブレイクアウト ゾーンの取引方法を変革する画期的な MQL5 インジケーターです。 13年以上の取引経験を持つ経験豊富なトレーダーのチームによって開発された Quantum Breakout PROは 、革新的でダイナミックなブレイクアウトゾーン戦略により、あなたの取引の旅を新たな高みに押し上げるように設計されています。 クォンタム ブレイクアウト インジケーターは、5 つの利益ターゲット ゾーンを備えたブレイクアウト ゾーン上のシグナル矢印と、ブレイクアウト ボックスに基づいたストップロスの提案を提供します。 初心者トレーダーにもプロのトレーダーにも適しています。 量子EAチャネル:       ここをクリック MT5バージョン:   ここをクリック 重要!購入後、インストールマニュアルを受け取るためにプライベートメッセージを送ってください。 推奨事項: 時間枠: M15 通貨ペア: GBPJPY、EURJPY、USDJPY、NZDUSD、XAUUSD アカウントの種類: ECN、Raw、またはスプレッドが非
MetaForecast M4
Vahidreza Heidar Gholami
5 (2)
MetaForecastは、価格データのハーモニクスに基づいて、どんな市場の未来を予測し視覚化します。市場が常に予測可能ではありませんが、価格にパターンがある場合、MetaForecastは可能な限り正確な未来を予測できます。他の類似製品と比較して、MetaForecastは市場のトレンドを分析することでより正確な結果を生成することができます。 入力パラメータ Past size (過去のサイズ) MetaForecastが将来の予測を生成するために使用するバーの数を指定します。モデルは選択したバー上に描かれた黄色の線で表されます。 Future size (将来のサイズ) 予測すべき将来のバーの数を指定します。予測された将来は、ピンクの線で表示され、その上に青い回帰線が描かれます。 Degree (程度) この入力は、MetaForecastが市場で行う分析のレベルを決定します。 Degree 説明  0 Degree 0の場合、価格の全てのピークや谷、そして詳細をカバーするために、「Past size」の入力に大きな値を使用することが推奨されています。  1 (推奨) Degre
Precautions for subscribing to indicator This indicator only supports the computer version of MT4 Does not support MT5, mobile phones, tablets The indicator only shows the day's entry arrow The previous history arrow will not be displayed (Live broadcast is for demonstration) The indicator is a trading aid Is not a EA automatic trading No copy trading function The indicator only indicates the entry position No exit (target profit)  The entry stop loss point is set at 30-50 PIPS Or the front hi
Fxland Price Reversal Zones (MT4) FXLAND Smart Reversal Indicator is a professional technical analysis tool designed to help traders identify potential price reversal zones and key market turning points with clarity and precision. The best reversal indicator and price return by choosing only one ceiling or floor in each time frame A masterpiece of combining mathematics and Gann, fractal matrix, Fibonacci, movement angle and time. Completely intelligent Key Features Detects potential pr
Dynamic Forex28 Navigator - 次世代の Forex 取引ツール。 現在 49% オフ。 Dynamic Forex28 Navigator は、長年人気のインジケーターを進化させたもので、3 つの機能を 1 つにまとめています。 Advanced Currency Strength28 インジケーター (レビュー 695 件)  + Advanced Currency IMPULSE with ALERT (レビュー 520 件) + CS28 コンボ シグナル (ボーナス)。 インジケーターの詳細 https://www.mql5.com/en/blogs/post/758844 次世代の Strength インジケーターが提供するもの  オリジナルで気に入っていたすべての機能が、新機能と精度の向上によって強化されました。 主な機能: 独自の通貨強度計算式。 すべての時間枠でスムーズかつ正確な強度ライン。 トレンドの特定と正確なエントリーに最適です。 ダイナミックマーケットフィボナッチレベル (マーケットフィボナッチ)。 このインジケーターに固有
MTF Supply Demand Zones
Georgios Kalomoiropoulos
4.82 (22)
次世代の自動化された需要と供給のゾーン。どのチャートでも機能する新しい革新的なアルゴリズム。すべてのゾーンは、市場の価格行動に従って動的に作成されています。 2種類のアラート --> 1) 価格がゾーンに達したとき 2) 新しいゾーンが形成されたとき もう 1 つの役に立たない指標はありません。実績のある完全な取引戦略を手に入れることができます。     新機能:     価格が需給ゾーンに達したときにアラートを出す     新しい需給ゾーンが作成されたときにアラートを発します     プッシュ通知アラート     ピップ単位のゾーン幅ラベル     MTF のもう 1 つのタイムフレーム。したがって、現在より 2 時間足高いのではなく、現在より 3 時間足し上に見えるようになります。     アラート/ゾーン/MTF 機能を有効/無効にするボタン あなたが得る利点:     取引から感情を取り除きます。     取引エントリをオブジェクト化します。     確率の高いセットアップで利益を上げましょう。     描画ゾーンから時間を節約します。
Introducing the Delta Volume Profile Indicator - Unleash the Power of Institutional Precision!  Technical Indicator: Are you ready to trade like the pros? The Delta Volume Profile Indicator is no ordinary tool. It’s a high-precision, cutting-edge indicator that puts the power of institutional-grade trading in your hands. This unique indicator analyses delta volume distribution in real-time, revealing the market's hidden buy/sell imbalances that the biggest financial institutions rely on to antic
Looking for a powerful yet lightweight swing detector that accurately identifies market structure turning points? Want clear, reliable buy and sell signals that work across any timeframe and any instrument? Buy Sell Arrow MT Swing is built exactly for that — precision swing detection made simple and effective. This indicator identifies Higher Highs (HH) , Higher Lows (HL) , Lower Highs (LH) , and Lower Lows (LL) with remarkable clarity. It is designed to help traders easily visualize market stru
Advanced version of CyberZingFx Volume Plus, the ultimate MT4 indicator for traders seeking highly accurate buy and sell signals. With an additional strategy and price action dot signals that enhances its effectiveness, this indicator offers a superior trading experience for professionals and beginners alike. The CyberZingFx Volume Plus Advanced version combines the power of volume analysis and historical price data with an additional strategy, resulting in even more precise and reliable signals
CRT Multi-Timeframe Market Structure & Liquidity Sweep Indicator Non-Repainting | Multi-Asset | MT5 Version Available MT5 Version:   https://www.mql5.com/en/market/product/162075 Full User Guide — explains what each feature does and why:   https://www.mql5.com/en/blogs/post/767525 Quick Start User Guide  — explains how to configure and in what order:  https://www.mql5.com/en/blogs/post/767540 Indicator Overview CRT Ghost Candle HTF Fractal is a complete institutional-grade market structure too
ゴールドラッシュ・トレンド・アロー・シグナル ゴールドラッシュ・トレンド・アロー・シグナル 指標は、XAU/USDにおける高速・短期スキャルパー向けに最適化された、正確でリアルタイムのトレンド分析を提供します。 1分足専用に設計されたこのツールは、明確なエントリーポイントを示す方向矢印を表示し、スキャルパーが変動の激しい市場状況でも自信を持って取引できるよう支援します。 この指標は、PRIMARY(主要)とSECONDARY(補助)のアラート矢印で構成されています。PRIMARYシグナルは、トレンドの方向転換を示す白と黒の方向矢印であり、SECONDARYシグナルは、PRIMARY矢印が示す方向を確認し、潜在的なエントリーポイントを示す青と赤の矢印です。 注意:トレンド方向の変化後にPRIMARYアラート矢印が1つだけ表示される場合、複数のSECONDARY青/赤矢印が表示される点に注意が必要です。SECONDARYシグナルは、シグナル基準を満たす任意のローソク足後に表示されます。したがって、長期的なトレンド移動の場合、画面に多くのSECONDARY矢印が表示されます(添付の
Pulse Scalping Line - an indicator for identifying potential pivot points. Based on this indicator, you can build an effective Martingale system. According to our statistics, the indicator gives a maximum of 4 erroneous pivot points in a series. On average, these are 2 pivot points. That is, the indicator shows a reversal, it is erroneous. This means that the second signal of the indicator will be highly accurate. Based on this information, you can build a trading system based on the Martingale
System Trend Pro - This is the best trend trading indicator!!! The indicator no repaint!!!  The indicator has   MTF   mode, which adds confidence to trading on the trend (   no repaint   ). How to trade? Everything is very simple, we wait for the first signal (big arrow), then wait for the second signal (small arrow) and enter the market in the direction of the arrow. (See screens 1 and 2.) Exit on the opposite signal or take 20-30 pips, close half of it, and keep the rest until the opposite
作者のその他のプロダクト
User Controls for BandLevels+Plus 1.0 This indicator extends standard band levels by plotting seven horizontal lines (three upper, one middle, three lower) based on multiple deviations. Buyers have full control over the following inputs: Band Calculation Settings • Period (BB_Period) → Define the moving average period used for band calculations • Shift (BB_Shift) → Shift bands forward/backward on the chart • Applied Price (BB_Applied_Price) → Choose the price type (Close, Open, High, Low,
User Controls for iMomentum–iOBV–iBands 1.0 This indicator combines On‑Balance Volume (OBV), Momentum, and adaptive Bands. Buyers have full control over the following inputs and style settings: ShortName updated in download. OBV Settings • Applied Price (OBVPrice) → Choose how OBV is calculated (Close, Weighted, Typical, etc.) Momentum Settings • Momentum Period → Define the lookback period for Momentum calculation • Momentum Line Style → Solid or dotted line options • Momentum Line Wid
User Controls for iStochastics‑iBands 1.0 This indicator gives traders full flexibility to customize both the Stochastic Oscillator calculation and the band levels. Buyers will have control over the following inputs: ShortName updated in download. Stochastic Settings • Price Field → Choose between Low/High or Close/Close for stochastic calculation • %K Period → Set the lookback period for the %K line • %D Period → Define the smoothing period for the %D line • Slowing → Add addi
Band Levels Plus Bands 2.1 product description: Band Levels Plus Bands is a precision‑engineered Bands indicator designed for traders who demand both audit clarity and visual elegance. Unlike standard bands, it layers both horizontal  Band price lines and multiple deviation bandwidth classes (±1.75, ±3.5, ±4.5) to give you a richer sense of volatility zones and potential breakout levels. Every band is drawn as a continuous curve across history, while horizontal reference lines mark the curre
User Input Controls for BandsOnMomentum 1.0 This indicator gives traders full flexibility to customize the Momentum calculation and the band levels. Buyers will have control over the following inputs: Momentum Settings • MomentumPeriod → Define the lookback period for Momentum calculation • MomentumPrice → Choose the applied price (Close, Open, High, Low, etc.) • Momentum Line Style → Solid or dotted line options • Momentum Line Width → Adjust thickness for visibility • Mome
Product Overview: WPR–iRSI–iBands 1.0 This indicator combines Williams Percent Range (WPR), Relative Strength Index (RSI), and volatility Bandwidth to deliver an indicator array data RSI of WPR. It’s ideal for traders who want to track Supply & Demand zones, trend reversals, and volatility thresholds, in one sub window. Core Components • WPR Curve → Measures overbought/oversold conditions based on recent highs/lows • RSI on WPR → Smooths WPR into a normalized oscillator for clearer signal
Order_Blocks_LBW Pro Indicator. Video shows OB_Pairs=2; and this means when one OB is broken a new OB appears immediately.   Update to Version 1.01, User nth candle extend OB's to the right of open candle and added debug for candle extend. Update to internal tf usage only. Indicator remains MTF. A pure candle‑based Order Block engine with multi‑timeframe scanning, POI logic, and full visual control. I hope to be releasing real TVI that is as close to original MT4 style as possible, once pass
フィルタ:
レビューなし
レビューに返信