Currency Correlation pro

Currency Correlation pro


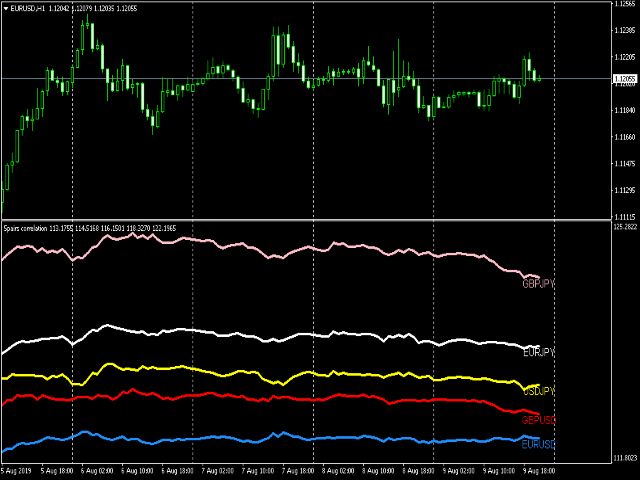
Currency correlation happens when the price of two or more currency pairs moves in conjunction with one another. There can be both positive correlation, where the price of the currency pairs moves in the same direction and negative correlation, where the price of the currency pairs moves in opposite directions.

this indicator put the price of 5 pairs on sub-windows so you see what happens in one chart.


How to use Correlation Indicator?

You can simply choose currency pairs you want to be watched by the Indicator and write their names at   Inputs
A line will appear in indicator sub window contains symbols you've entered and their instant Ask price
for watching the correlation history of any of them you simply go back and see the all history for them.
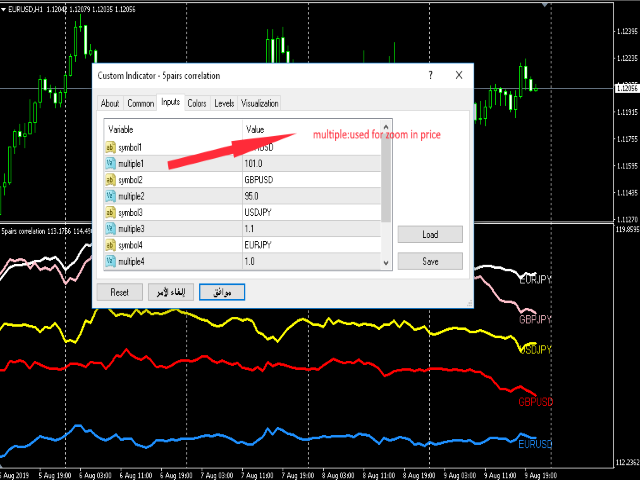
Indicator Inputs

  1. symbole: it refer to Currency Pairs names Or Symbols that you want to monitor
  2. multiple: it refers to price zoom in( if you put EURUSD and USDJPY..the price different between them too big..so you muliple eurusd by:usdjpy/eurusd...112.23/1.1205 = 100.16) so the two prices will be close


おすすめのプロダクト
Hello This EA for send Orders Signals when you open or close order and send statics to your channel in Telegram with sum of profit or Loss Pips you can share your orders with your clients in your telegram please watch our video  to see how it is fast. https://www.youtube.com/watch?v=u_7twtYZhyI you must have Telegram channel then make bot and give it Permission and get token (watch this video to know how do it) https://www.youtube.com/watch?v=x1bKWFOjSBE and you must download this files https
This powerful indicator intercepts 21 patterns simultaneously on 28 Pairs and on all timeframes. Just put the indicator on a single chart to see all patterns that appear on all pairs in all timeframes The patterns found are: For Bearish: Bearish Abandoned Baby; Bearish Engulfing; Bearish Harami; Bear Kicker; Dark Cloud Cover; Evening Doji Star; Evening Star; Shooting Star; Three Black Crows; Three Inside Down; Three Outside Down; For Bullish: Bullish Abandoned Baby; Bullish Engulfing; Bullish Ha
このツールは、取引プラットフォームで利用可能なすべての通貨ペアの詳細なスワップレートを表示するように設計されています。 これにより、トレーダーは視覚的に強化された別個のウィンドウでロングとショートの両方のスワップ値をすばやく確認できます。 このツールは、ロット サイズのユーザー定義の入力を提供し、現在のスワップ レートと取引量に基づいて正確な計算を保証します。 さらに、標準レートと週末調整レートの両方を考慮して、スワップ手数料が適用される時期も提供されます。 注: スワップ情報は取引プラットフォームに応じて毎日変わります。   ------------------------------------------------------------------------------------------------------------------------------------------------------------- このツールは、取引プラットフォームで利用可能なすべての通貨ペアの詳細なスワップレートを表示するように設計されています。 これにより、トレーダーは視覚的
The Market Heart indicator scans market entries after high volatility is noticed. Most big moves occur a short time after market volatility.  Most big moves occur a short time after market volatility. The idea is to look for entries after the rectangles form and not necessarily as trade entry signals. . For example, you could use the  Retracement Feeder   indicator that generates arrow signals. Market Heart MT5  Version How to use:  1.  Primary use The White Box is the first to be formed and
Description A universal colored multicurrency/multi-symbol indicator RAVI. Was proposed by T. Chand as a trend indicator. RAVI means Range Action Verification Index. The indicator may be used with any broker, irrespective of the name of the financial instrument since it is necessary to manually enter the name as an input parameter. If you enter a non-existent or incorrect name of a financial instrument, you will receive an error message that this financial instrument is unknown (does not exist).
API Tz Strength Indicator MT4 – All-in-One Strength Dashboard for 28 Symbols and 9 Timeframes Take your Strength analysis to the next level with one powerful dashboard. The API Tz Strength Indicator MT4 is designed for traders who want to track market strength and reversals across multiple symbols and timeframes – all from a single chart. With advanced clickable controls, customizable watchlists, and smart alerts, this tool simplifies multi-symbol, multi-timeframe analysis like never before. ___
This indicator compares the pips of the current day with the average of pips made in the previous three days. The "Percentage today range" is red if today's figure is less than the range of the previous three days, but turns green when the percentage exceeds 100%. When the range exceeds 100% there are good trading opportunities because we are in the presence of increased volatility of the past three days. Best use with Banks Day Levels indicator. Parameters settings corner (indicator display po
Currency Spread Calculator
Opengates Success International
Currency Spread Calculator This indicator is created with the aim of letting the Traders know the exact points of the spread on the currency pair they are about to buy or sell. This will safe them of paying exorbitant spread over a single currency pair procurement. Imagine a normal spread become wider from 2 or 3 pips to 15pips or more when there is volatility in the market. It is absolutely outrageous looking for just 20 pips and paying another 20 pips as spread over a currency pair! Actuall
The NASDAQ Stock Exchange Session's Hours This indicator facilitates observing the currency pair's quotations during subsequent parts of the stock exchange session live. Before the session starts, a rectangle is drawn on the chart but not filled in with color. It means the extent of the session duration. Before the first bar enters the rectangle of the session, a sound signal or pop-up window will notify us that the session will just start. When the price graph crosses the edge of the session
複数ペアでの高確率セットアップを見逃すのをやめましょう トレーダー各位、 Aero Pulse Dashboard をご紹介します。プロフェッショナルグレードのマルチペア・マルチタイムフレームスキャナーで、ノイズなしにクリアな 買い と 売り シグナルをお届けします。   私たちが直面する共通の問題: 20以上のペアを複数タイムフレームで物理的に監視できません 手動でセットアップを見つける頃には、動きはすでに半分終わっています ほとんどのインジケーターはシグナルを再描画し、バックテストを無意味にします 複数のインジケーターでチャートが乱雑になり、意思決定が困難になります 機会を逃すのが怖くて何時間も画面に張り付いています   Aero Pulse Dashboardの違い:   マルチペア監視 最大20通貨ペアを同時にスキャン トレンド方向、シグナル状態、シグナル年齢を一目で確認 任意のペア/タイムフレーム組み合わせへワンクリックで移動   非再描画シグナル 履歴で見えるものがリアルタイムで表示されたものと完全に一致 シグナルの移動も消失する矢印もトリックもなし
Fair Value Gap Scanner 4
Usiola Oluwadamilol Olagundoye
Next Arrival : Flip or Die Trading Arena. Flip a trading account:  https://flipordie.com/chapter-1-thirteen-doublings-double-a-trading-account/ Fair Value Gap Scanner 4 is a sophisticated MetaTrader 5 indicator designed to detect fair value gaps (FVGs) in price action and display them as rectangles directly on the chart. This powerful tool empowers traders by providing visual representations of FVGs, enabling them to identify potential trading opportunities with ease and precision. With customi
FREE
The Trend Champion indicator works on all timeframes and currency pairs. The indicator should be used as an auxiliary tool for technical analysis, it helps to determine the direction of the trend: either upward or downward price movement for a particular currency pair. Can be used along with oscillators as filters. Trend Champion is a trend indicator. Arrows indicate favorable moments and directions for entering the market. The indicator can be used both for pipsing on small periods and for lo
The "Dagangduit Spread Indicator" is a versatile tool designed to provide traders with essential information about the current spread in the chart window. This indicator offers customizable features, including font parameters, display location on the chart, spread normalization, and alerts to enhance your trading experience. Key Features: Real-time Spread Display : The indicator displays the current spread in real-time on your trading chart, allowing you to stay informed about the cost of execut
It's a variation of mid of HH and LL since it compares the higher of HH or LL against a period and twice the number of bars back to avoid whipsaws. I used to display this against lines on a chart, but made a histogram out of it and it looks interesting. It looks good at gauging trend strength and general turns (see image below). The name of the indicator is BAM, which is an acronym for "Below and Above Mid". Ways to use it: 1. To see general trend on longer TFs (more than 60 bars back).
Ultimate ADX Multi-timeframe Indicator This indicator provides real-time ADX values for multiple timeframes in one unobtrusive label panel. It i s especially useful for gauging trend strength across timeframes without constantly switching charts. Choose which periods to display, anchor the panel to any chart corner, and color-code ADX strength levels to your taste. Key Features & Personalization Multi-Timeframe ADX - Toggle visibility for 9 built-in periods (M1, M5, M15, M30, H1, H4, D1, W1, MN1
FREE
Candle Timer Countdown (CTC) – Minimalist & Precise Candle Timer Candle Timer Countdown (CTC) is a lightweight and non-intrusive MetaTrader indicator that displays the remaining time of the current candlestick on your chart. Designed with simplicity and clarity in mind, this tool helps traders stay aware of candle closures without cluttering the chart. Key Features: Real-Time Candle Countdown Always know how many seconds are left before the current candle closes – works on all timeframes. Minima
FREE
This is a multi-timeframe candle patterns indicator. It scans the chart for Hammer , Engulfing candle , Doji candle and Three white soldiers / black crows setups. FEATURES: Main panel showing timeframe s from M5 - W1, last signal and last signal time of the selected candle pattern. You can switch between the timeframes by clicking on them. A panel with buttons to switch from one candle pattern to another on the main panel. Arrows to help you locate the candle pattern. A scale showing you what ca
The indicator plays sound alerts when the price reaches certain levels, specified by trader. You only need to draw a trendline and then press the alert button in the panel. The texts of the notification you determine. Notification via a smartphone or email address is possible. Note for "Free Demo" : MetaTrader 4 does not support displaying an alert window or playing sounds in the strategy tester, only in live or demo accounts. How it works Draw a trendline Click the "Alert" button (Trendline m
その   ドンチャンブレイクアウトスキャナープロ   包括的な   マルチシンボル監視ツール   自動的に追跡する   ドンチャンチャネルブレイクアウト   様々な取引商品と時間枠にわたって、この高度なスキャナーは、古典的な手法を用いて継続的に価格動向を分析します。     ドンチャンチャネル法は 、選択した銘柄のポートフォリオ全体にわたって重要なブレイクアウトパターンを特定します。システムは、これらの取引機会を直感的な画面で提示します。     色分けされたボタンインターフェース 。緑色のボタンは   強気のブレイクアウト   赤いボタン信号   弱気なブレイクアウトは それぞれ時間枠が明確にラベル付けされており、すぐに評価できます。 これ   マルチタイムフレーム機能   トレーダーは、短期的なM1の動きから長期的なD1とW1のトレンドまで、さまざまな時間軸でブレイクアウトの収束を監視できます。スキャナーの   ダッシュボードスタイルのディスプレイ   現在の市場状況を体系的に概観し、どの商品が最も有望であるかを強調します。     ブレイクアウトの機会   様々な時間軸でシグナル
Coral Trade Planner is a 3-in-1 tool for making smart trades.   The Lot Size Calculator lets you determine the appropriate lot size based on risk, and see the impact on your risk as you change the stop loss distance and/or lot size.   The Trade Planner is an innovative tool for visualizing your planned trades on the chart, and gives you immediate feedback on the value of the trade (both the risk of hitting your stop loss and the reward of hitting your take profit).  Both Market and Pending order
This indicator is used to visualize the profit of closed and open orders on the symbol. To control using four buttons which are located on the chart after the indicator is started: Button "C" - show/hide on chart open and close points of closed orders from account history by current symbol; Button "O" - show/hide on chart open points of opened orders and distance between open point and current order close price point; Button "$" - show (if button "C" and/or button "O" activated) / hide every ord
This is the ADX Dashboard MT5. This dashboard will scan multiple timeframes in MT4 platform, from M1 chart to D1 chart. It will send the buy/sell signals by alert on the platform or sending notification to your phone or message you via a email. The buy signal is the cross over of DI+ and DI- The sell signal is the cross under of DI+ and DI-. The up trend color will be displayed when DI+ is greater than DI- The down trend color will be displayed when DI+ is less than DI- The value of ADX value wi
Description Keltner's colored multicurrency/multisymbol channel indicator, also called STARC band, drawn in a separate window below the chart of the main financial symbol. The indicator uses the calculation technique of the three drawing options:  basic, improved and modified . The first two were proposed by Keltner, the third one - by a successful trader L. Rakshe. You can also search for your own best parameters of the indicator. The upper, middle and lower bands can be colored. The indicator
The Magic MA Moving Average Indicator is a market analysis tool that has more than 30 types of moving averages that the trader can use to gauge the market trend. Among the types of moving averages that the trader can visualize are the most common MAs (SMA, EMA and SMMA), adaptive moving averages such as FRAMA and KAMA and other MAs based on innovative calculation and analysis methods such as LSMA, ZLEMA and others. The indicator is designed to display all these moving averages on a single cha
The super trade signals channel index system automatically calculates the supporting lower track and resistance upper track according to the fluctuation amplitude of K line at the present stage and the spatial position The super trade signals channel indicator will automatically calculate the supporting lower rail line and resistance upper rail line at the position where the K line is located in real time. When the K line price reaches the supporting lower rail line, it will automatically promp
Trend reversal indicator, no repainting. Clean and light rendering There is no alternative buy-sell signal without taking into account the trend. Noise filtering capability. Works with all pairs. Ideal for beginners and experienced traders It is best used on timeframes above the M30, from the beginning of the London session to America. It should be remembered that there are no indicators that are not wrong. Any strategy requires confirmation of its signals. When building your own system, it i
OCTO TACK TREND INDICATOR Summary/Description: Trend indicator showing signals to execute orders in favor of the current trend Get ready to have the best trend indicator you've ever tried. No repainting in any way, guaranteed It generates clear signals and always in favor of the trend (see screenshots) You just have to wait for the alert to indicate it and earn pip Are you tired of indicators that never work? Here we have the solution, try the free version and if you want to have more signals
FREE
TrendSeeker Pro ― 究極のトレンド&ターニングポイント・ダッシュボード + H4レンジ検出器 Ultimate Trend & Turning Point Dashboard は、トレーダーを常にトレンドの正しい方向へ導き、低確率なレンジ相場を排除し、高精度なターニングポイントエントリーを自信をもって提供する、完全なマルチタイムフレーム市場判断システムです。 これは単なるインジケーターではありません。 取引前に必ず答えを出す、完成されたトレードフレームワークです。 このツールは、エントリー前に次の 3つの重要な質問 に答えます: 市場は トレンド相場 か レンジ相場 か? 上位足(H4)の バイアス は何か? 最も 安全で精度の高いエントリーポイント はどこか? 1. スマート・マルチシンボル・トレンドダッシュボード(H4ベース) 内蔵ダッシュボードは、すべての取引可能シンボルを自動スキャンし、H4時間足における EMA・ADX・ATR ロジックを用いて各通貨ペアを即座に分類します。 ダッシュボードには以下が明確に表示されます: PAIR(通貨ペア) TREND → U
Индикатор виртуального эквити, представляемый здесь, может работать по нескольким символам одновременно. Для каждого символа задается направление ( Buy/Sell ) и размер позиции. В настройках также указывается размер предполагаемого депозита, дата открытия и закрытия позиции.   На графике при этом устанавливаются вертикальные линии, обозначающие указываемые в настройках даты.  После установки индикатора на график, можно изменять время открытия и закрытия позиции, передвигая эти линии.   Дату закр
Rira Renko
Vitor Palmeira Abbehusen
RENKO on Time Chart This indicator is an enhanced Renko, so you can watch the Renko bricks on the chart to understand price movement more clearly the other improvement is automated box size according to ATR (Average True Range) period you can set the ATR number as you want and the box size of Renko changes automatically based on price movement Inputs Mode: Box size is the input to specify the size of the Renko box you want to print on the chart. This input lets you choose the fixed box siz
このプロダクトを購入した人は以下も購入しています
Genesis Matrix Pro is a professional multi-timeframe trend detection indicator designed to help traders identify high-quality market alignment with clarity and structure. It combines 12 different technical indicators into one visual alignment matrix, allowing traders to quickly see when market conditions are bullish, bearish, or neutral. A signal is generated only when the selected strategies are aligned, helping reduce noise and improve decision-making. PLEASE CONTACT ME AFTER PURCHASE TO GET
Gann Made Easy は、ミスター・ギャンの理論を使用した取引の最良の原則に基づいた、プロフェッショナルで使いやすい外国為替取引システムです。 W・D・ガン。このインジケーターは、ストップロスとテイクプロフィットレベルを含む正確な買いと売りのシグナルを提供します。 PUSH通知を利用して外出先でも取引可能です。 ご購入後、取引方法の説明と優れた追加インジケーターを無料で入手するには、私にご連絡ください! おそらく、ギャンの取引手法についてはすでに何度も聞いたことがあるでしょう。通常、ギャンの理論は初心者のトレーダーだけでなく、すでにある程度の取引経験がある人にとっても非常に複雑なものです。なぜなら、ギャンの取引手法は理論的にはそれほど簡単に適用できるものではないからです。私はその知識を磨き、最良の原則を私の外国為替インジケーターに組み込むために数年を費やしました。 このインジケーターは非常に簡単に適用できます。必要なのは、それをチャートに添付し、簡単な取引推奨事項に従うだけです。このインジケーターは常に市場分析の仕事を行い、取引の機会を探します。適切なエントリーポイントを検出す
The Propfolio Master Suite is the ultimate all-in-one analytical workstation for professional traders. Combining the power of the Beat The Market Maker (BTMM) methodology, Smart Money Concepts (SND/Liquidity), and Advanced Volume Profile, this suite replaces multiple different indicators with one optimized engine. Monitor up to 14 pairs simultaneously from a single chart, instantly identify market cycles, and seamlessly map institutional footprints with the click of a button. The Command Center
Scalper Inside PRO Scalper Inside PRO は、MetaTrader 4 向けの短期トレンドおよびスキャルピング用インジケーターです。独自アルゴリズムを用いて、市場の方向性と主要なターゲットレベルを素早く検出します。エントリー、イグジット、複数の利確ターゲットを自動計算し、詳細なパフォーマンス統計を表示することで、さまざまな銘柄やストラテジーがどのように機能してきたかを確認できます。これにより、現在のマーケットコンディションに最も適した取引銘柄を選択するのに役立ちます。さらに、Scalper Inside PRO には、お使いの矢印インジケーターを簡単に接続でき、その統計と過去のパフォーマンスを素早く評価できます。 本インジケーターは、あらゆる銘柄と時間足で動作し(短期トレードには M5 を推奨)、複数の内蔵ストラテジーを備えています。そのため、単体のスキャルピングツールとしても、トレーディングシステム内の強力な分析コンポーネントとしても活用できます。 主な機能 独自アルゴリズム(Next‑Generation Trend Detection Algor
M1 SNIPER は使いやすいトレーディングインジケーターシステムです。M1時間足向けに設計された矢印インジケーターです。M1時間足でのスキャルピングのためのスタンドアロンシステムとして、また既存のトレーディングシステムの一部としても使用できます。このトレーディングシステムはM1時間足での取引に特化して設計されていますが、他の時間足でも使用できます。元々、この手法はXAUUSDとBTCUSDの取引用に設計しましたが、他の市場においても役立つと考えています。 インジケーターのシグナルは、トレンドの方向と逆方向に取引できます。インジケーターのシグナルを利用して両方向に取引するのに役立つ特別な取引テクニックをご紹介します。この手法は、特別な動的なサポートとレジスタンスの価格帯を利用することに基づいています。 ご購入後、M1 SNIPER矢印インジケーターをすぐにダウンロードできます。さらに、M1 SNIPERツールのすべてのユーザーに、以下のスクリーンショットに表示されているApollo Dynamic SRインジケーターを無料で提供しています。この2つのインジケーターを組み合わせることで
PRO Renko Systemは、特別にRENKOチャートを取引するために設計された高精度の取引システムです。 これは、様々な取引商品に適用することができる普遍的なシステムです。 システムは効果的に正確な逆転信号へのアクセスを与えるいわゆる市場の騒音を中和する。 表示器は非常に使いやすく、信号の生成に責任がある1つの変数だけがあります。 あなたは簡単にお好みの任意の取引ツールとレンコバーのサイズにツールを適応させることができます。 私はいつもあなたが私のソフトウェアで収益性の高い取引を支援するために余分なサポートを提供する準備ができています! 私はあなたに幸せで収益性の高い取引をしたいです! ご購入後にご連絡ください! 私はあなたに私のレンコチャートジェネレータを送信します。 私はまた、私の個人的な推奨事項やシステムの他のモジュールを無料で共有します!
Auto Optimized Parabolic RSI: 高度な3Dモメンタムエンジン ほとんどのリテール向けインジケーターは、市場のボラティリティが変化した瞬間に破綻する静的な入力値に依存しているため、失敗に終わります。Auto Optimized Parabolic RSIは、自らの数学的優位性を継続的に再計算することで「インジケーターの陳腐化」問題を解決し、機関投資家レベルの定量的適応力をMT5ターミナルに直接もたらします。 最大の強み: カスタムインメモリ3D最適化   標準的な自動最適化ツールは、インジケーターの呼び出しで端末に過負荷をかけるため、頻繁にMT5プラットフォームをフリーズさせます。本ツールは、このボトルネックを完全に回避しています。RAMベースのカスタムネイティブ計算機を内蔵した内部エンジンは、チャートを読み込んだりタイムフレームを変更したりするたびに、超高速の3Dグリッド探索を実行します。RSI期間(頻度)、SARステップ(加速度)、SAR最大値(制限速度)を同時にスイープし、プラットフォームを遅延させることなく、数万通りものパラメーターの組み合わせを絶対的
NAM Order Blocks
NAM TECH GROUP, CORP.
3.67 (3)
MT4マルチタイムフレームオーダーブロック検出インジケーター。 特徴 -チャートコントロールパネルで完全にカスタマイズ可能で、完全な相互作用を提供します。 -必要な場所でコントロールパネルを表示および非表示にします。 -複数の時間枠でOBを検出します。 -表示するOBの数量を選択します。 -さまざまなOBユーザーインターフェイス。 -OBのさまざまなフィルター。 -OB近接アラート。 -ADRの高線と低線。 -通知サービス(画面アラート|プッシュ通知)。 概要 注文ブロックは、金融機関や銀行からの注文収集を示す市場行動です。著名な金融機関と中央銀行が外国為替市場を牽引しています。したがって、トレーダーは市場で何をしているのかを知る必要があります。市場が注文ブロックを構築するとき、それは投資決定のほとんどが行われる範囲のように動きます。 注文の構築が完了すると、市場は上向きと下向きの両方に向かって急激に動きます。注文ブロック取引戦略の重要な用語は、機関投資家が行っていることを含むことです。それらは主要な価格ドライバーであるため、機関投資家の取引を含むあらゆる戦
LHおよびHLブレイクアウトを見つけるための純粋な価格アクションによって行われる高度な計算。 それはあなたに市場で素晴らしい逆転ポイントを与えるでしょう。LHとHL信号は同様にトレイングルブレイクアウトに使用することができます。 ブレイクアウトが発生すると、強い反転を示します。移動平均の優れたフィルターです。トレンドインジケーターと一緒に使用することを強くお勧めします。 サポートとレジスタンス、供給需要指標の追加確認として使用できます。 詳細については、次の外国為替スレッドをご覧ください。 インジケーターは再描画されていません。 Buffers :   SetIndexBuffer ( 0 ,UpBar);      SetIndexBuffer ( 1 ,UpBar2);           SetIndexBuffer ( 2 ,DnBar);      SetIndexBuffer ( 3 ,DnBar2);           SetIndexBuffer ( 4 ,UpBarTop);      SetIndexBuffer ( 5 ,UpBarLow);     
Dynamic Forex28 Navigator - 次世代の Forex 取引ツール。 現在 49% オフ。 Dynamic Forex28 Navigator は、長年人気のインジケーターを進化させたもので、3 つの機能を 1 つにまとめています。 Advanced Currency Strength28 インジケーター (レビュー 695 件)  + Advanced Currency IMPULSE with ALERT (レビュー 520 件) + CS28 コンボ シグナル (ボーナス)。 インジケーターの詳細 https://www.mql5.com/en/blogs/post/758844 次世代の Strength インジケーターが提供するもの  オリジナルで気に入っていたすべての機能が、新機能と精度の向上によって強化されました。 主な機能: 独自の通貨強度計算式。 すべての時間枠でスムーズかつ正確な強度ライン。 トレンドの特定と正確なエントリーに最適です。 ダイナミックマーケットフィボナッチレベル (マーケットフィボナッチ)。 このインジケーターに固有
これはほぼ間違いなく、MetaTraderプラットフォームで見つけることができる最も完全な調和価格形成自動認識インジケーターです。 19種類のパターンを検出し、フィボナッチプロジェクションをあなたと同じように真剣に受け止め、潜在的逆転ゾーン(PRZ)を表示し、適切なストップロスとテイクプロフィットレベルを見つけます。 [ インストールガイド | 更新ガイド | トラブルシューティング | よくある質問 | すべての製品 ] 19の異なる調和価格形成を検出します プライマリ、派生および補完フィボナッチ投影(PRZ)をプロットします 過去の価格行動を評価し、過去のすべてのパターンを表示します この指標は、独自の品質とパフォーマンスを分析します 適切なストップロスとテイクプロフィットのレベルを表示します ブレイクアウトを使用して適切な取引を通知します すべてのパターン比をグラフにプロットします 電子メール/音声/視覚アラートを実装します スコット・M・カーニーの本に着想を得て、この指標は最も純粋で急を要するトレーダーのニーズを満たすように設計されています。ただし、トレードを容易にする
このインジケーターは、反転ポイントと価格戻りゾーンを正確に表示します。     主要プレーヤー 。新たなトレンドが形成される場所を把握し、最大限の精度で意思決定を行い、すべての取引をコントロールします。 TREND LINES PRO インジケーターと組み合わせることで、その潜在能力を最大限に発揮します。 VERSION MT5 インジケーターが示す内容: 新しいトレンドの始まりに活性化する反転構造と反転レベル。 リスクと報酬の比率を最小限に抑えた利益 確定 と 損失停止の レベルの表示     RR 1:2   。 インテリジェントな削減ロジックによるストップロス。 指定されたインジケーターから 2 つのトレンド タイプの反転パターンを表示します。 指標: トレンドを追う   TREND LINES PRO   (世界的なトレンドの変化) TREND PRO   (クイックトレンド変更) シンプルで効果的   スキャナー   リアルタイムトレンド(新機能)。 マルチタイムフレームのインストゥルメント フィルタリング。 画面   利益     LOGIC AI信号の後。 当日プラス方
トレンドキャッチャーインジケーター トレンドキャッチャーインジケーターは、開発者独自の適応型トレンド分析指標を組み合わせることで、市場価格の動きを分析します。短期的なノイズを除去し、根底にあるモメンタムの強さ、ボラティリティの拡大、価格構造の挙動に焦点を当てることで、真の市場方向性を特定します。また、移動平均線、RSI、ボラティリティフィルターなどの平滑化およびトレンドフィルタリング機能を備えたカスタマイズ指標も使用します。 実際の運用状況のモニタリングやその他の製品については、こちらをご覧ください: https://www.mql5.com/en/users/mechanic/seller ご注意ください。私はTelegramでEAや設定を販売していません。詐欺です。すべての設定はブログで無料で公開しています。 重要!ご購入後すぐにご連絡ください。手順とボーナスをお送りします!
Apollo SR Master は、サポート/レジスタンスゾーンを利用した取引をより容易かつ確実にする特別な機能を備えたサポート/レジスタンスインジケーターです。このインジケーターは、ローカル価格の高値と安値を検出することで、タイムラグなしでリアルタイムにサポート/レジスタンスゾーンを計算します。そして、新たに形成されたSRゾーンを確認するために、インジケーターは特別なシグナルを表示します。このシグナルは、SRゾーンを実際の売りまたは買いシグナルとして考慮して使用できることを示します。この場合、SRゾーンの強度が高まり、SRエリアからの取引が成功する確率も高まります。これがこのインジケーターの基本的な考え方です。 SRゾーンは、ストップロスとテイクプロフィットの設定を容易にします。シグナルの方向に応じて、SRゾーンの上または下のスペースをストップロスとして設定できます。さらに、反対側のSRゾーンは、潜在的なテイクプロフィットエリアとして設定できます。 また、Apollo SRマスターインジケーターをご利用のすべてのユーザーには、「Apollo Price Action System」
優れたテクニカルインジケーター「Grabber」をご紹介します。これは、すぐに使える「オールインワン」トレーディング戦略として機能します。 ひとつのコードに、市場のテクニカル分析ツール、取引シグナル(矢印)、アラート機能、プッシュ通知が強力に統合されています。 このインジケーターを購入された方には、以下の特典を無料で提供します: Grabberユーティリティ:オープンポジションを自動で管理するツール ステップバイステップのビデオマニュアル:インジケーターのインストール、設定、取引方法を解説 カスタムセットファイル:インジケーターをすばやく自動設定し、最大限の成果を出すための設定ファイル 他の戦略はもう忘れてください!Grabberだけが、あなたを新たなトレードの高みへと導いてくれるのです。 Grabber戦略の主な特徴: 推奨タイムフレーム:M5〜H4 対応通貨ペア・資産:どれでも使用可能ですが、私が実際に検証した以下を推奨します(GBPUSD、GBPCAD、GBPCHF、AUDCAD、AUDUSD、AUDSGD、AUDCHF、NZDUSD、NZDCAD、EURCAD、EURUSD、E
デイトレーダーマスターは、デイトレーダーのための完全なトレーディングシステムです。システムは2つのインジケーターで構成されています。 1つの指標は売買する矢印信号です。それはあなたが得る矢印インジケーターです。 2つ目のインジケーターを無料で提供します。 2番目のインジケーターは、これらの矢印と組み合わせて使用​​するために特別に設計されたトレンドインジケーターです。 インジケーターは繰り返さず、遅れないでください! このシステムの使用は非常に簡単です。 2色の線で表示されている現在のトレンドの方向に矢印信号をたどる必要があります。青は買いの傾向です。赤い色は売りの傾向です。青い矢印は買いシグナルです。赤い矢印は売りの合図です。トレンドラインの色と一致するように、矢印の色と信号の方向が必要です。 矢印インジケーターは、主に時間間隔M5とM15での日中取引のために作成されました。ただし、技術的には、システムは他の時間間隔で使用できます。 インジケータには、PUSHメッセージ機能を備えたポップアップアラートが装備されています。 購入後、必ず私に書いてください!私はあなたにシステムとの取引の
ゴールドラッシュ・トレンド・アロー・シグナル ゴールドラッシュ・トレンド・アロー・シグナル 指標は、XAU/USDにおける高速・短期スキャルパー向けに最適化された、正確でリアルタイムのトレンド分析を提供します。 1分足専用に設計されたこのツールは、明確なエントリーポイントを示す方向矢印を表示し、スキャルパーが変動の激しい市場状況でも自信を持って取引できるよう支援します。 この指標は、PRIMARY(主要)とSECONDARY(補助)のアラート矢印で構成されています。PRIMARYシグナルは、トレンドの方向転換を示す白と黒の方向矢印であり、SECONDARYシグナルは、PRIMARY矢印が示す方向を確認し、潜在的なエントリーポイントを示す青と赤の矢印です。 注意:トレンド方向の変化後にPRIMARYアラート矢印が1つだけ表示される場合、複数のSECONDARY青/赤矢印が表示される点に注意が必要です。SECONDARYシグナルは、シグナル基準を満たす任意のローソク足後に表示されます。したがって、長期的なトレンド移動の場合、画面に多くのSECONDARY矢印が表示されます(添付の
Introduction to Fractal Pattern Scanner Fractal Indicator refers to the technical indicator that makes use of the fractal geometry found in the financial market. Fractal Pattern Scanner is the advanced Fractal Indicator that brings the latest trading technology after the extensive research and development work in the fractal geometry in the financial market. The most important feature in Fractal Pattern Scanner is the ability to measure the turning point probability as well as the trend probabi
現在40%オフ 初心者やエキスパートトレーダーに最適なソリューション! このインジケーターは、独自の機能と新しい計算式を取り入れた、ユニークで高品質、かつ手頃な価格のトレーディングツールです。たった1枚のチャートで28の為替ペアの通貨強度を読み取ることができます。新しいトレンドやスキャルピングチャンスの引き金となるポイントを正確に特定することができるので、あなたのトレードがどのように改善されるか想像してみてください。 ユーザーマニュアルはこちら  https://www.mql5.com/en/blogs/post/697384 これが最初の1本、オリジナルだ! 価値のないクローンを買わないでください。 特別な サブウィンドウの矢印で強い通貨の勢いを表示 GAPがあなたのトレードを導く! 基準通貨や気配値が売られすぎ・買われすぎのゾーン(外相フィボナッチレベル)にあるとき、個別チャートのメインウィンドウに警告表示。 通貨がレンジの外側から反落した場合、プルバック/リバーサルのアラート。 クロスパターンの特別なアラート 複数の時間枠を選択可能で、トレンドを素早く確認できます
Advanced Supply Demand
Bernhard Schweigert
4.91 (300)
現在40%オフ 初心者にもエキスパートトレーダーにも最適なソリューション このインジケーターは独自の機能と新しい公式を多数内蔵しており、ユニークで高品質かつ手頃な取引ツールです。このアップデートでは、2つの時間枠ゾーンを表示できるようになります。より長いTFだけでなく、チャートTFとより長いTF(ネストゾーンを表示)の両方を表示できます。すべてのSupply Demandトレーダーの皆さんのお気に召すはずです。:) 重要情報の公開 Advanced Supply Demandの可能性を最大化するには、 https://www.mql5.com/ja/blogs/post/720245 にアクセスしてください。   エントリーまたはターゲットの正確なトリガーポイントを正確に特定できれば取引がどのように改善されるか想像してみてください。新しい基盤となるアルゴリズムに基づいて構築されているため、買い手と売り手の間の潜在的な不均衡をさらに簡単に特定できます。これは、最も強い需要と供給のゾーンと、過去のパフォーマンス(古いゾーンを表示)がグラフィカルに表現されるためです。これらの機能は、最適な
Market Structure Patterns   is an indicator based on   smart money concepts   that displays   SMC/ICT   elements that can take your trading decisions to the next level. Take advantage of the   alerts ,   push notifications   and   email messages   to keep informed from when an element is formed on the chart, the price crosses a level and/or enters in a box/zone. Developers can access the values of the elements of the indicator using the   global variables  what allows the automation of trading d
Advanced UT BOT ALERTS for MT4 プロフェッショナル多重フィルター型トレンド検出システム|強化版 UT BOT エンジン 私たちは高品質なインジケーターのみを提供します。 Advanced UT BOT はプロフェッショナル向けに設計されており、安定したシグナルロジックと安全な計算構造によって遅延や誤更新を防止します。 過去のシグナルを 再描画・修正・削除することはありません 。 すべての BUY / SELL シグナルは ローソク足の確定後に生成され固定されます 。 リアルタイム取引中に 再描画は一切なく 、足が確定した時点で即座に表示されます。 期間限定オファー — 次回価格は 49 ドルになります。 価格が上がる前に今すぐ入手してください。 製品概要 Advanced UT BOT ALERTS   は、 UT BOT   のコアロジックに基づいて再構築された次世代のトレンドシグナルシステムです。 MT5 に完全対応し、複数のフィルター、動的ビジュアル化、高精度アラートを統合しています。 UT Bot インジケーターはもともと   Yo_adrii
購入後、このインジケーターに基づいたボーナスEAを受け取るためにご連絡ください。 Self Optimizing Double MA Strategyは、パラメータ推測の必要性を排除するために設計されたプロフェッショナルグレードの取引ツールです。組み込みの自動最適化エンジンを搭載し、バックグラウンドで何千ものパラメータの組み合わせをシミュレートすることで、変化する市場状況に継続的に適応し、統計的な優位性を維持します。 静的で時代遅れの設定に依存するのではなく、インジケーターは自身のロジックを動的に更新し、現在の時間枠と取引商品にとって最も収益性の高い構成を見つけ出します。 主な機能 組み込みの自動最適化: 選択した更新頻度に基づいて、システムはFast MA、Slow MA、およびRSIの期間を定期的に再計算し、設定が常に現在の市場のリズムと一致するようにします。 MAダイバージェンスフィルター: 移動平均線が明確に乖離している(広がっている)場合にのみシグナルを検証する、トレンド強度のコア指標です。これにより、移動平均線が収束している相場や平坦なレンジ相場での誤ったエントリーを防ぎ
もしあなたがFX取引をしているなら、通貨の強さと通貨ペアの相関関係に関する詳細な情報を持つことは、取引パフォーマンスを飛躍的に向上させることができます。相関関係を活用すればリスクを半減でき、強さの分析を活用すれば利益を最大化することが可能です。 このインジケーターは、通貨の強さ分析と通貨ペアの相関関係を組み合わせたハイブリッドなアプローチにより、最適な通貨ペアを選択するサポートをします。 通貨の強さ分析の使い方 例えば、あなたの取引戦略でAUD/JPYの買いシグナルが出たとします。しかしKTの通貨強さ分析を使うと、JPYがAUDよりも強くなっていることがわかりました。この場合、その取引は損失に終わる可能性が高いです。このインジケーターがあれば、そのような損失を未然に防ぐことができます。 通貨ペア相関関係の使い方 例えば、NZD/USDとGBP/JPYの同時売りシグナルが出たとします。KTの通貨ペア相関ツールを使うと、これらのペアの相関率が77%であることが判明します。  これらのペアは強く相関しているため、同時に取引するとリスクが二重になります。もしNZD/USDで損失が出れば、
KURAMA GOLD SIGNAL PRO(MT4版)— 7層フィルター・自動TP/SL・品質スコア搭載 XAUUSD完全トレードシステム リペイントなし。リドローなし。ラグなし。すべてのサインは確定後に変わりません。見たままが結果です。 特典:買い切りライセンスをご購入いただいた方に、AI Zone Radar($59相当)+PDFマニュアルを無料プレゼント。購入後にMQL5でメッセージをお送りください。 AI Zone Radar: https://www.mql5.com/en/market/product/175834 トレーダーから信頼されています:ゴールドトレーダーのコミュニティで実際に使用され、精度と使いやすさで高く評価されています。 あなたの問題 — そしてその解決策 ゴールドは1日$30〜$50動く。チャンスがあるのは分かっている。でもこういう経験はないか: - エントリーが早すぎて、$10逆行してから思った方向に動く - MAタッチのたびに入って、半分は負ける - TP/SLの基準がないから、持ちすぎるか早すぎる決済をする - 動かない時間帯にトレ
「 Dynamic Scalper System 」インジケーターは、トレンド波の中でスキャルピング取引を行う手法のために設計されています。 主要通貨ペアと金でテスト済みで、他の取引商品との互換性があります。 トレンドに沿った短期的なポジションオープンのシグナルを提供し、追加の価格変動サポートも提供します。 インジケーターの原理 大きな矢印はトレンドの方向を決定します。 トレンド波の中では、小さな矢印の形でスキャルピングシグナルを生成するアルゴリズムが機能します。 赤い矢印は強気方向、青い矢印は弱気方向です。 トレンドの方向には敏感な価格変動ラインが描かれ、小さな矢印のシグナルと連動します。 シグナルは次のように機能します。適切なタイミングでラインが現れるとエントリーシグナルが形成され、ラインが開いている間はポジションが保持され、完了すると取引が終了します。 推奨される動作時間枠はM1~H4です。 矢印は現在のローソク足に形成され、次のローソク足が開いている場合は、前のローソク足の矢印は再描画されません。 入力パラメータ Trend Wave Period - トレンド方向
頭と肩のパターンは、3つのピークを持つベースラインに似たチャート構成であり、外側の2つは高さが近く、中央は最高です。強気から弱気のトレンド反転を予測し、最も信頼性の高いトレンド反転パターンの1つと考えられています。これは、トレンドが終わりに近づいていることをさまざまな精度で知らせるいくつかのトップパターンの1つです。 [ インストールガイド | 更新ガイド | トラブルシューティング | よくある質問 | すべての製品 ] クリアな取引シグナル カスタマイズ可能な色とサイズ パフォーマンス統計を実装します カスタマイズ可能なフィボナッチリトレースメントレベル 適切なストップロスおよび利益レベルを表示します インジケーターを使用して、継続パターンまたは反転パターンを見つけることができます 再描画および非再描画ではありません 電子メール/音声/視覚アラートを実装します 設定 チャートにインジケーターをロードすると、入力パラメーターとして一連のオプションが表示されます。パラメーターが自明のブロックにグループ化されているため、それらが多すぎると思う場合でも、絶望しないでください。これは、パ
このインディケーターはダブルトップとダブルボトムの反転パターンを見つけ、ブレイクアウトを使用して取引シグナルを発生させます。 [ インストールガイド | 更新ガイド | トラブルシューティング | よくある質問 | すべての製品 ] クリアな取引シグナル カスタマイズ可能な色とサイズ パフォーマンス統計を実装します カスタマイズ可能なフィボナッチリトレースメントレベル 適切なストップロスとテイクプロフィットのレベルを表示します 電子メール/音声/視覚アラートを実装します これらのパターンは拡張でき、インジケーターは再描画によってパターンに追従します。ただし、インジケーターはトレードを容易にするためにツイストを実装します。トレードをシグナルする前に正しい方向へのドンチャンブレイクアウトを待機し、シグナルを非常に信頼性が高く、ほとんど再描画しません。 入力パラメータ 振幅:振幅は、代替価格ポイント間のバーの最小量を表します。大きなパターンを見つけるには、振幅パラメーターを大きくします。小さなパターンを見つけるには、振幅パラメーターを小さくします。 最小リトレースメント:パターンに
Special offer : ALL TOOLS , just $35 each! New tools   will be   $30   for the   first week   or the   first 3 purchases !  Trading Tools Channel on MQL5 : Join my MQL5 channel to update the latest news from me スリーバーレバーサルパターンインジケーター は、トレーダーに強力なツールを提供し、価格チャート上で三本の反転パターンを自動的に識別して強調表示します。このインジケーターは、潜在的なトレンドの反転を検出するための貴重なリソースであり、統合されたトレンドインジケーターを通じて信号精度を向上させることができます。 MT5バージョンの詳細はこちら: Three Bar Reversal Pattern MT5 その他の製品はこちら:   すべての製品 主な機能 パターンの自動検出: このインジケーターは、三本の反転パターンをスキャンし、視覚的に明確なシグナルで表示し、潜在的なト
チャートを構成し、周期的な価格変動を識別するテクニカル指標。 どのチャートでも動作します。 いくつかの種類の通知。 グラフ自体に追加の矢印があります。 履歴を再描画せずに、キャンドルのクローズに取り組みます。 M5以上のTFを推奨します。 パラメータの使用と設定が簡単です。 異なるパラメータを持つ 2 つのインジケーターを使用する場合、他のインジケーターなしで使用できます。 入力パラメータは2つあります 周期性と信号持続時間 これら 2 つのパラメータは、チャート構造の処理を扱います。 Cyclicity - 反転サイクルが変化する頻度を調整し、サイクルを滑らかにします。 Signal duration - 最小数では価格変動の衝動を検出し、最大数では長期的なトレンドの動きを検出します。
作者のその他のプロダクト
Time Bubble ***Specialized for GBPJPY 1H time frame*** (tested for two years with success rates about 82%) Time Circle's smart algorithm detects the price circles with time . give strong signals at the right time as result of combine the price and time. our team spent months to develop this indicator specially for GBPJPY ..with high success rates about 82% win trades over two years .tested from December 2016 to November 2018. *** in last two years total signals 1012 with 829 Wins and 183 Lo
Scalping Trender ***Specialized for scalping trading on timeframe 5m & 15m*** work best with: **USDMXN m5 **USDMXN m15 **GBPJPY m15 **EURJPY m15 **USDTRY m15 **EURTRY m15 Scalping Trender use smart algorithm detects the price circles with time . give strong signals at the right time as result of combine the price and time. our team spent months to develop this indicator specially for Scalping..with high success rates about 89% win trades .   Advantages Easy, visual and effective Signals.
***Specialized for scalping trading on any timeframe*** Scalping Train use smart algorithm detects the price circles with time . give strong signals at the right time as result of combine the price and time. our team spent months to develop this indicator specially for Scalping..with high success rates about 89% win trades . Advantages Easy, visual and effective Signals. Gives you the ability to filter and further improve your trading strategies. Never repaints, never backpaints, never recalc
G99 GRAVITY G99 Gravity is a channel indicator for the MetaTrader 4 terminal. This indicator allows finding the most probable trend reversal points. Unlike most channel indicators, G99 Gravity does not redraw. Attach the indicator to a chart, and the alert will trigger once a signal emerges. With our alerting system, you will never miss a single position opening signal! Advantages of the indicator Perfect for scalping. Excellent for identifying trend reversals. Suitable for beginners and exper
フィルタ:
レビューなし
レビューに返信