ICT Strategy
- インディケータ
- バージョン: 1.0
- アクティベーション: 5

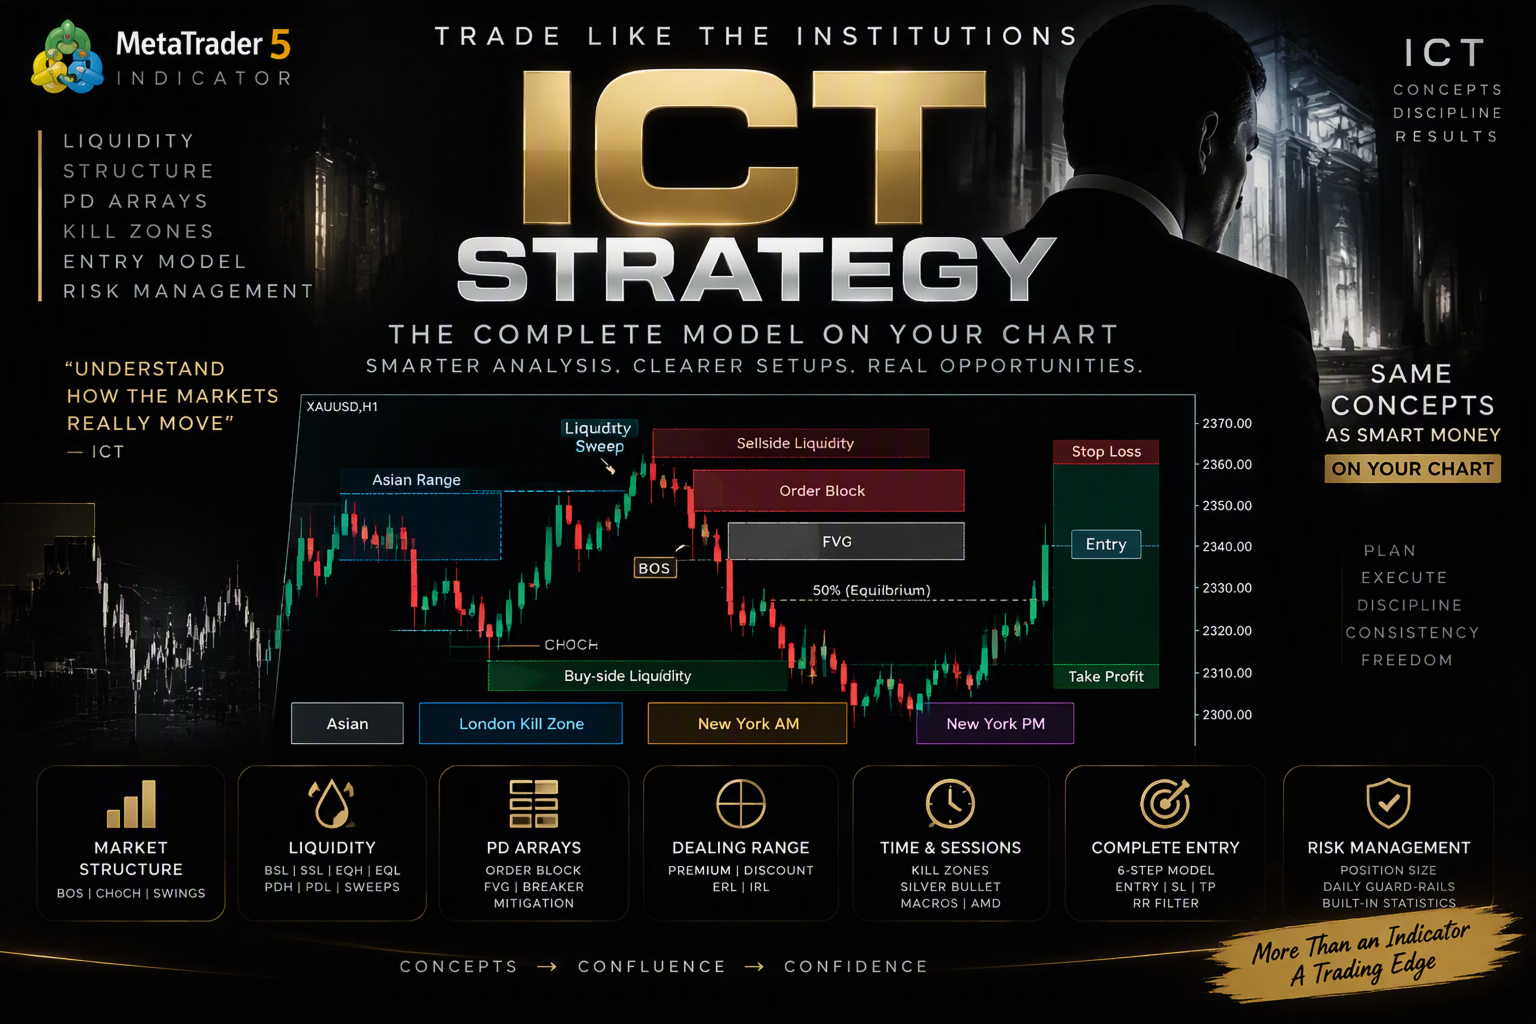
ICT Strategy — Professional MetaTrader 5 Indicator
ICT Strategy built for traders who want a clearer, more organized view of the market through the concepts of Inner Circle Trader (ICT) and Smart Money trading. It brings important market structures, liquidity levels, price delivery zones, and trading-session information together in one professional charting tool.
Designed with clarity and precision in mind, ICT Strategy helps traders identify and visualize important ICT-related areas directly on the chart. Its clean presentation makes complex market information easier to read while helping reduce unnecessary chart clutter. For traders looking for a powerful, all-in-one ICT indicator, ICT Strategy offers a practical and professional trading companion.
Key Features
1. Market Structure Analysis
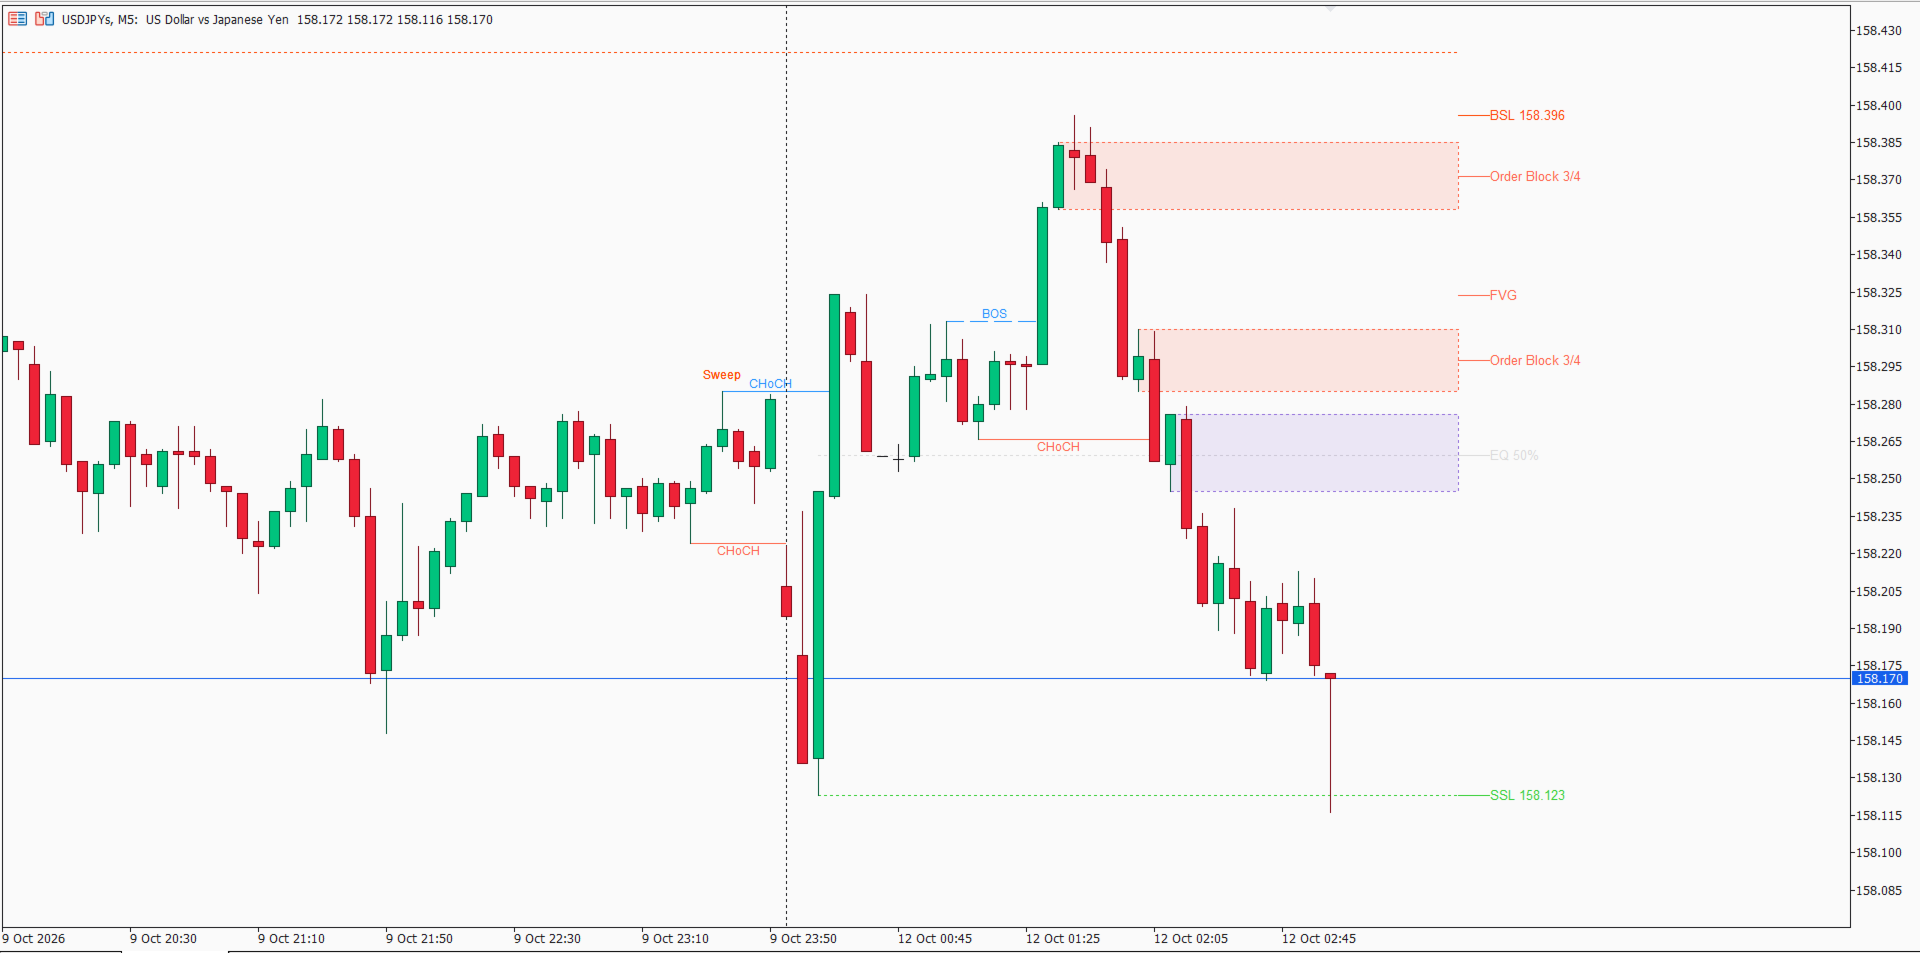
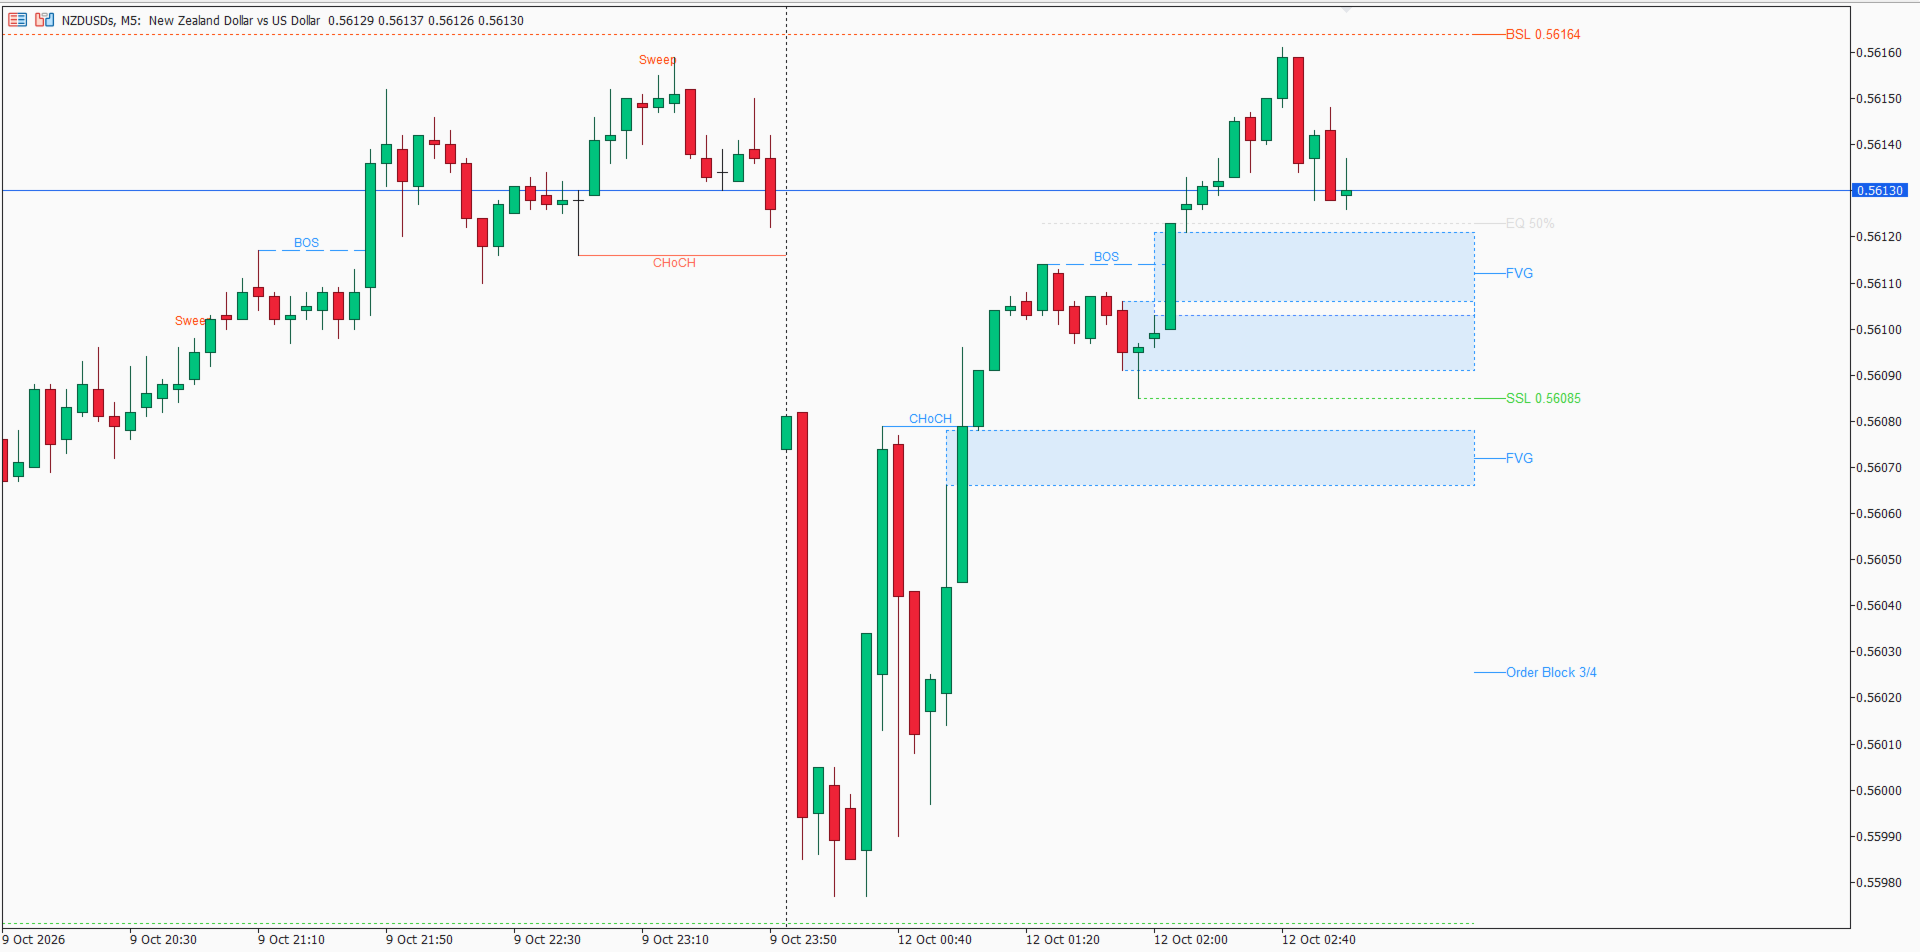
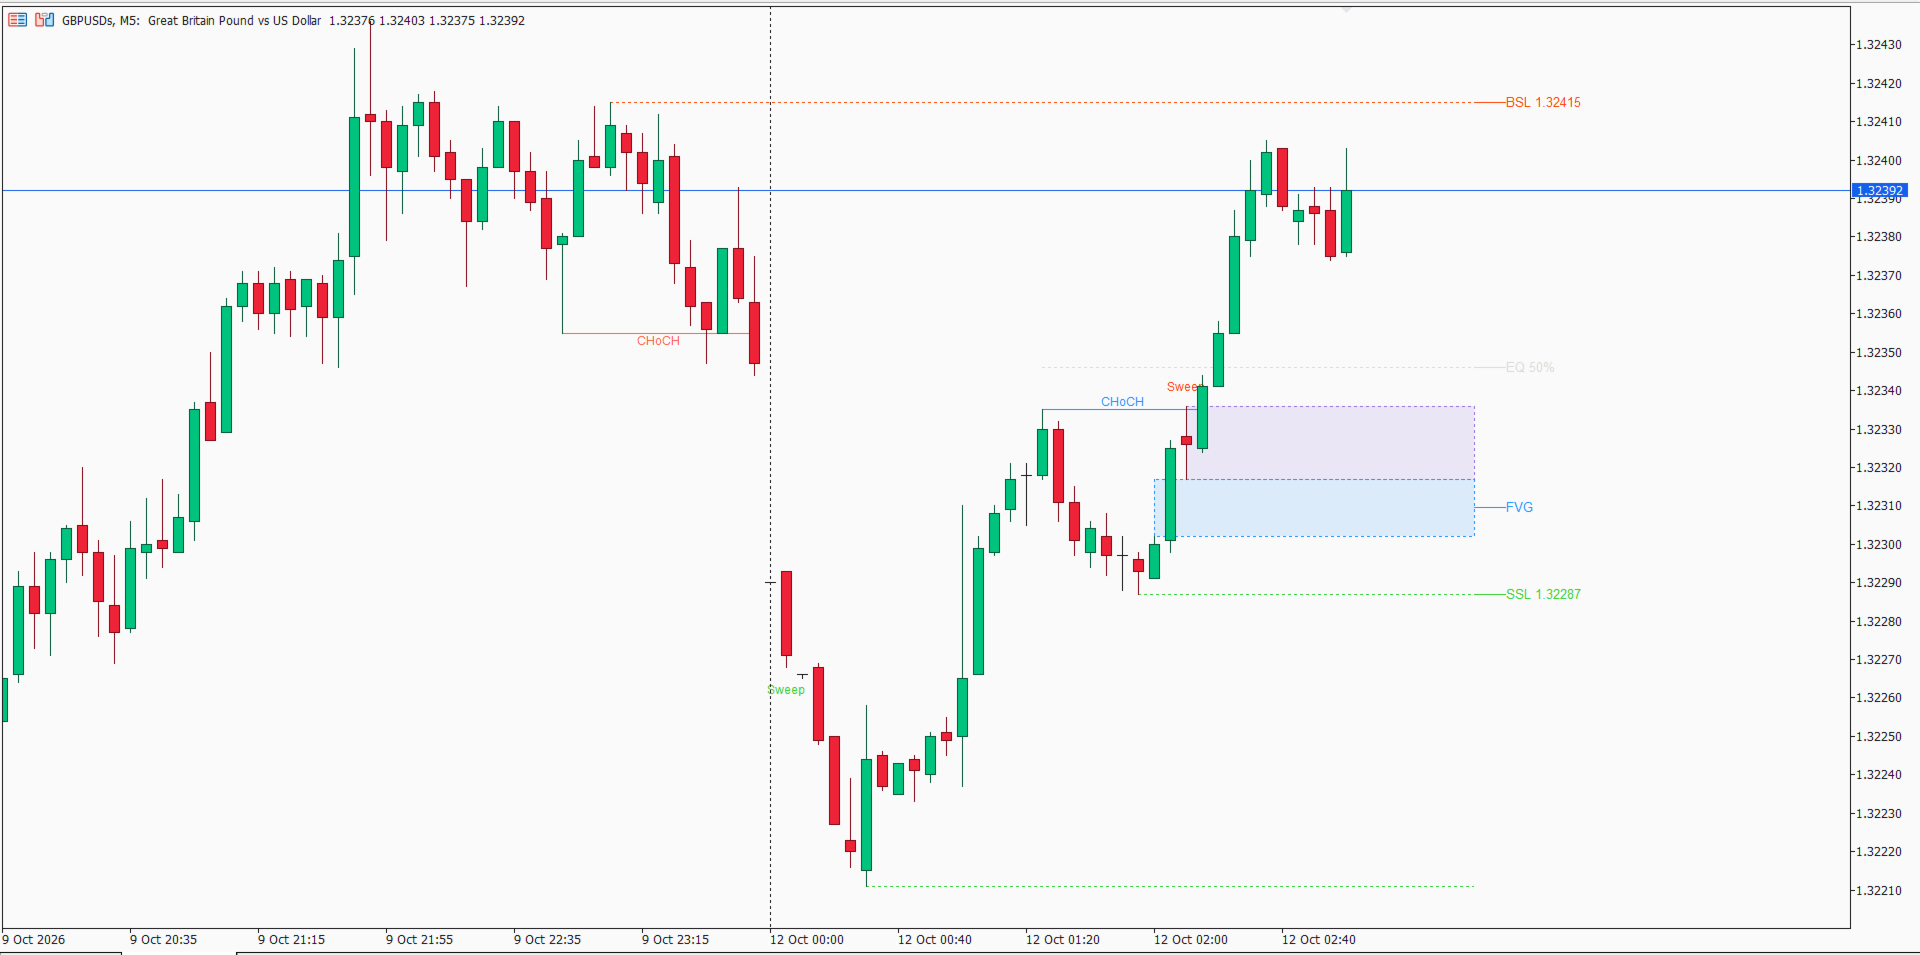
Visualizes important market structure events and swing behavior to help traders understand potential changes in market direction and structure.
2. Fair Value Gaps (FVG)
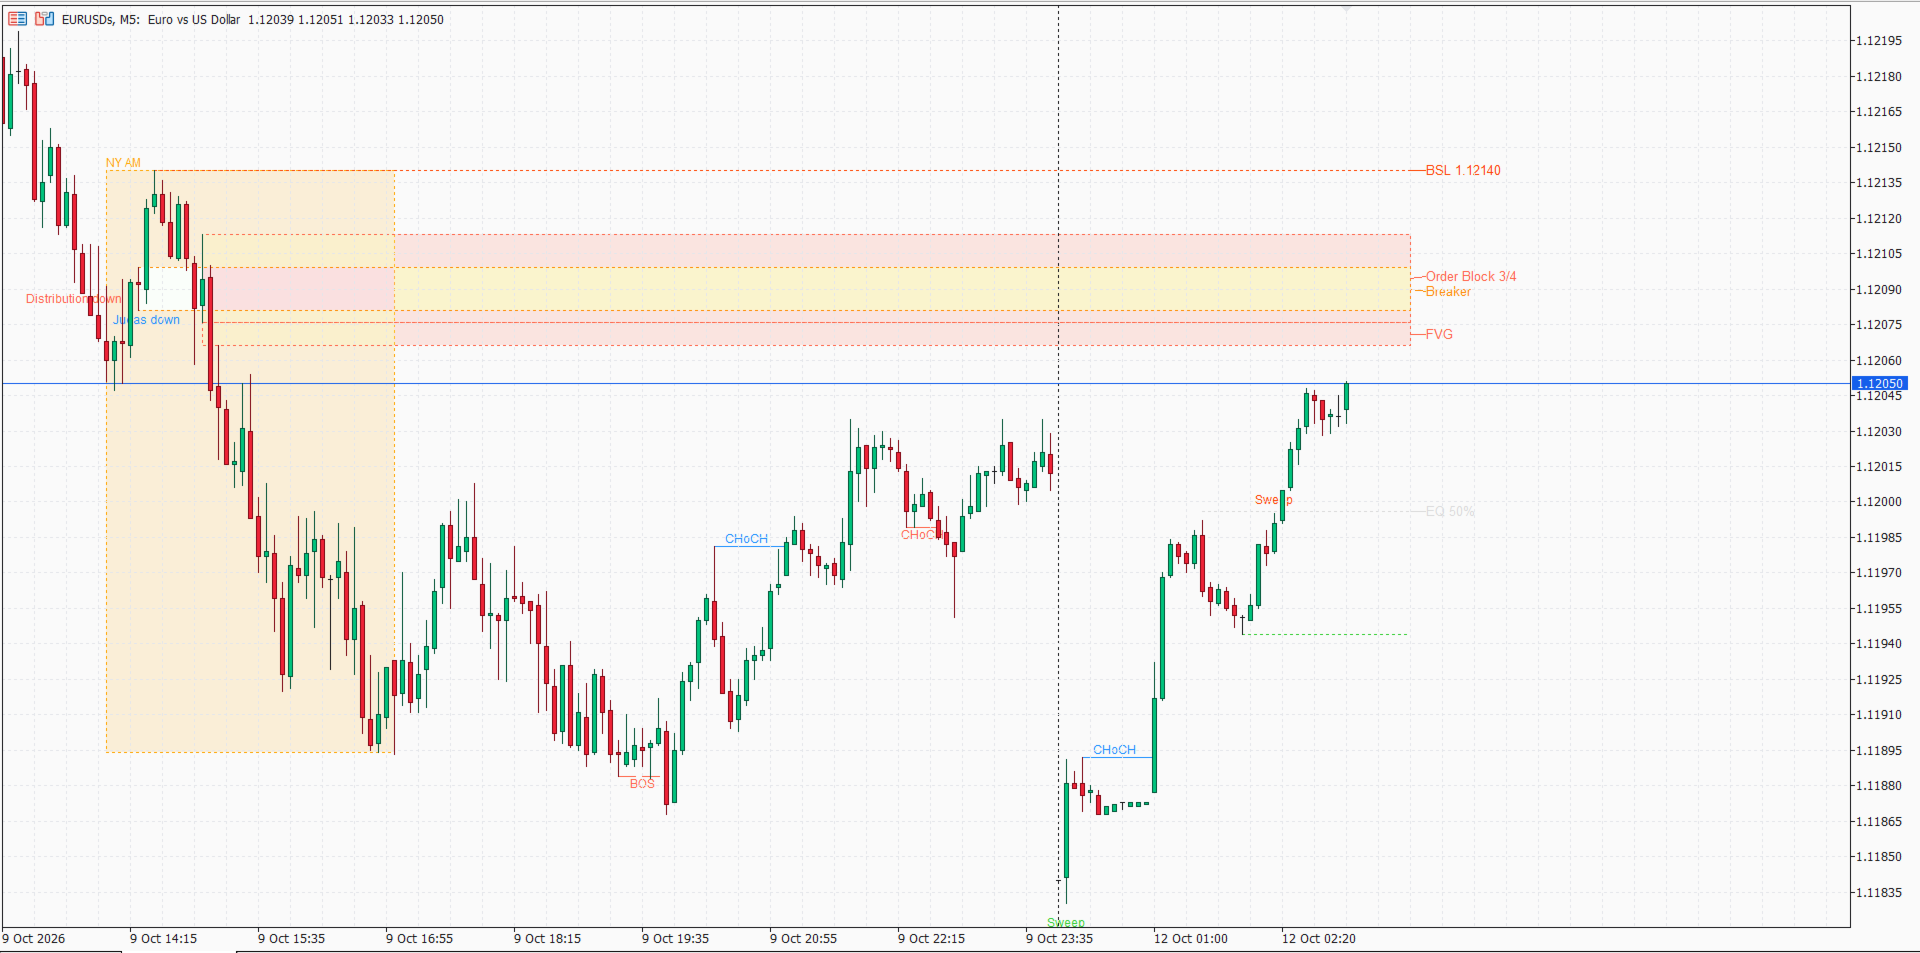
Highlights Fair Value Gaps, allowing traders to identify potential price imbalance areas and monitor how price interacts with them.
3. Order Blocks (OB)
Displays bullish and bearish Order Block zones to help traders study areas of potential buying and selling interest.
4. Liquidity Levels
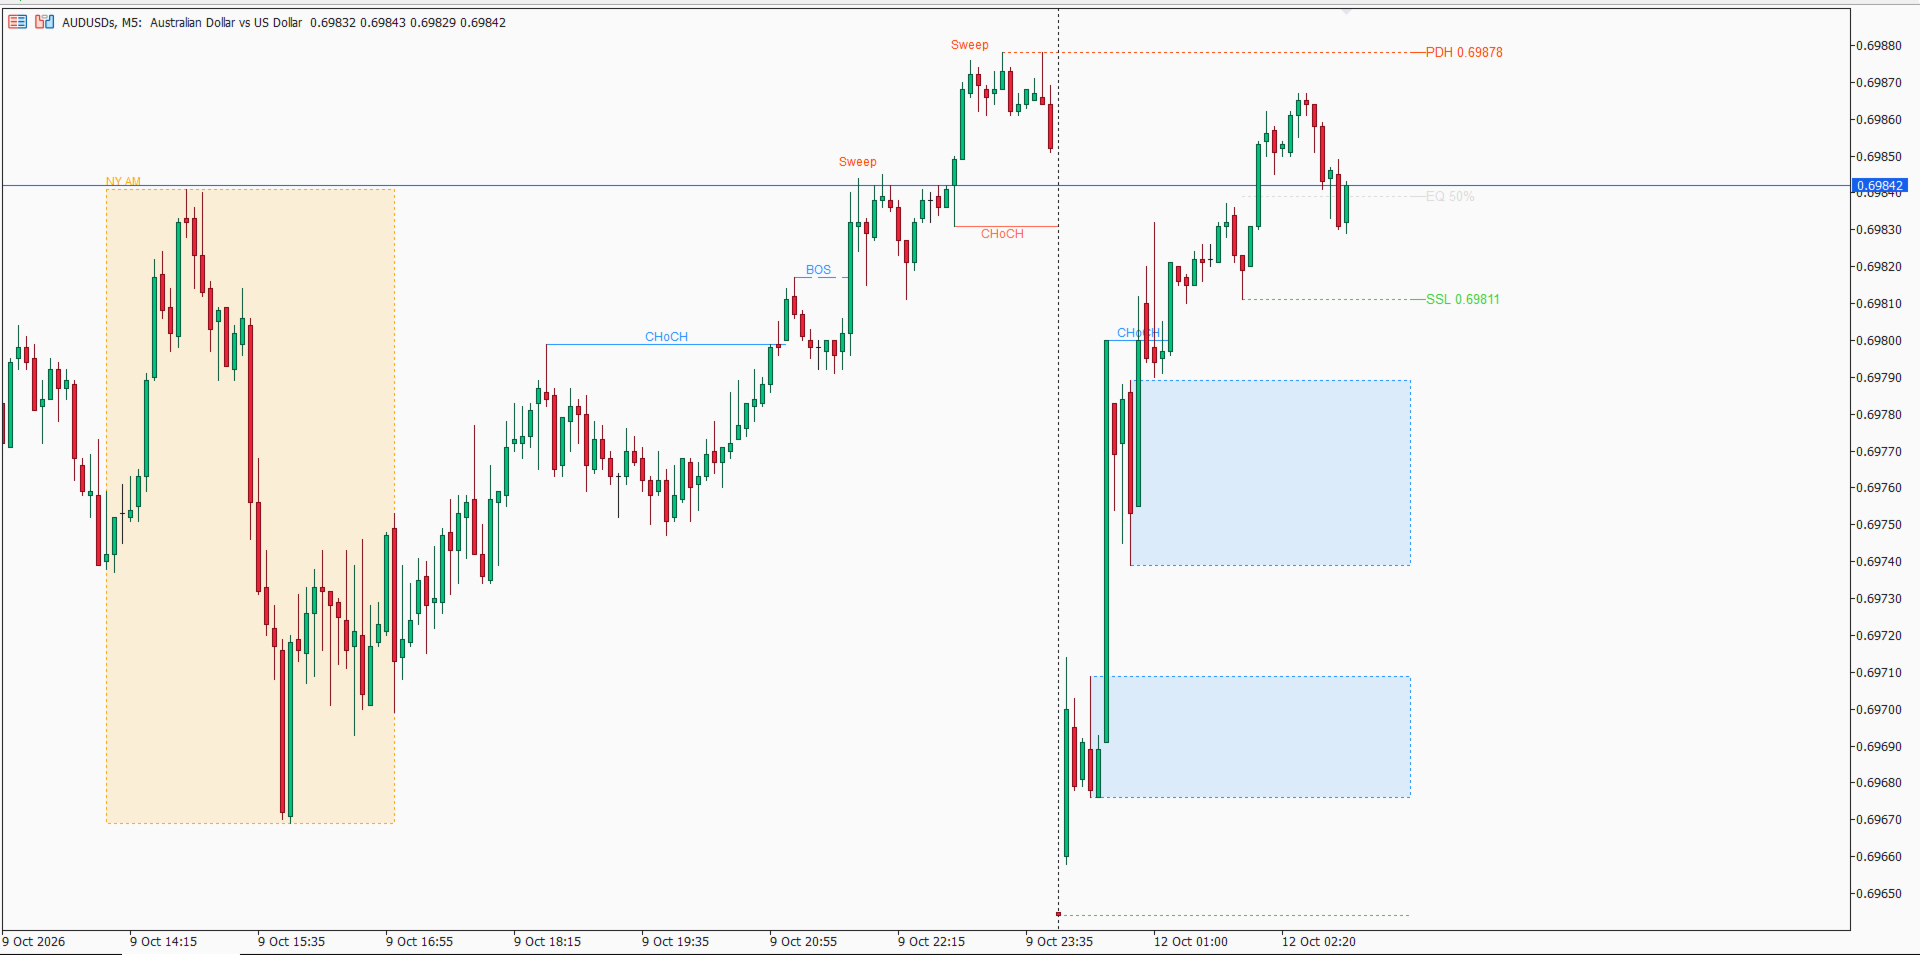
Helps visualize important liquidity references, including Buy-Side Liquidity (BSL), Sell-Side Liquidity (SSL), Equal Highs (EQH), Equal Lows (EQL), Previous Day High (PDH), and Previous Day Low (PDL).
5. Break of Structure (BOS) and Change of Character (CHoCH)
Marks key structural events to support market analysis and help traders recognize potential continuation or changes in market behavior.
6. Trading Sessions and Kill Zones
Includes London and New York AM session tools to help traders observe market activity during important trading periods.
7. Additional ICT Concepts
Supports visual analysis of Breaker Blocks, Mitigation Blocks, Sweeps, Discount Zones, and AMD concepts, bringing multiple ICT-related elements into one indicator.
Clean, Customizable Chart Display
Designed to present essential information in an organized format, with configurable visual elements that help traders adapt the chart to their preferences.
Understanding the Chart Labels
- FVG — Fair Value Gap: A price imbalance area.
- OB — Order Block: A zone associated with potential buying or selling interest.
- BOS — Break of Structure: A break of a significant market structure level.
- CHoCH — Change of Character: A potential shift in market structure behavior.
- BSL — Buy-Side Liquidity: Liquidity associated with buy orders above market highs.
- SSL — Sell-Side Liquidity: Liquidity associated with sell orders below market lows.
- EQH — Equal Highs: Two or more highs forming around a similar price level.
- EQL — Equal Lows: Two or more lows forming around a similar price level.
- PDH — Previous Day High: The previous trading day's high.
- PDL — Previous Day Low: The previous trading day's low.
- AMD — Accumulation, Manipulation, Distribution: A market model
describing three commonly discussed phases of price behavior.
- Discount Zone: A lower portion of a selected price range, often studied for potential buying opportunities.
- Bullish / Bearish: Labels indicating upward or downward market context.
Who Is ICT Strategy For?
ICT Strategy is suitable for beginners learning ICT terminology and experienced traders seeking a structured charting environment. It can be used across supported instruments and timeframes, subject to the trader's strategy and platform setup.
Trade with greater clarity. Analyze the market with structure. Discover ICT Strategy for MetaTrader 5.